UNITED
STATES
SECURITIES
AND EXCHANGE COMMISSION
Washington,
D. C. 20549
FORM
10-K
|
x
|
ANNUAL
REPORT PURSUANT TO SECTION 13 OR 15(d) OF THE SECURITIES EXCHANGE ACT OF
1934
|
For the
fiscal year ended September 30, 2009
Commission
File Number 0-09115
MATTHEWS
INTERNATIONAL CORPORATION
(Exact
name of registrant as specified in its charter)
|
COMMONWEALTH
OF PENNSYLVANIA
|
25-0644320
|
|
(State
or other jurisdiction of
|
(I.R.S.
Employer
|
|
incorporation
or organization)
|
Identification
No.)
|
|
|
|
|
TWO
NORTHSHORE CENTER, PITTSBURGH, PA
|
15212-5851
|
|
(Address
of principal executive offices)
|
(Zip
Code)
|
|
Registrant's
telephone number, including area code
|
(412)
442-8200
|
Securities
registered pursuant to Section 12(b) of the Act:
|
Title
of each class
|
|
Name
of each exchange on which registered
|
|
Class
A Common Stock, $1.00 par value
|
|
NASDAQ
Global Select Market System
|
Securities
registered pursuant to Section 12(g) of the Act: None
Indicate
by check mark if the registrant is a well-known seasoned issuer, as defined in
Rule 405 of the Securities Act.
Yes x No
o
Indicate
by check mark if the registrant is not required to file reports pursuant to
Section 13 or Section 15(d) of the Act.
Yes o No
x
Indicate
by check mark whether the registrant (1) has filed all reports required to be
filed by Section 13 or 15(d) of the Securities Exchange Act of 1934 during the
preceding 12 months (or for such shorter period that the registrant was required
to file such reports), and (2) has been subject to such filing requirements for
the past 90 days. x
Indicate
by check mark if disclosure of delinquent filers pursuant to Item 405a of
Regulation S-K is not contained herein, and will not be contained, to the best
of registrant's knowledge, in definitive proxy or information statements
incorporated by reference in Part III of this Form 10-K or any amendment to this
Form 10-K. o
Indicate
by check mark whether the registrant has submitted electronically and posted on
its corporate Web site, if any, every Interactive Data File required to be
submitted and posted pursuant to Rule 405 of Regulation S-T during the preceding
12 months (or for such shorter period that the registrant was required to submit
and post such files).
Indicate
by check mark whether the registrant is a large accelerated filer, an
accelerated filer, a non-accelerated filer or a smaller reporting company. See
definition of “large accelerated filer”, “accelerated filer”, and “smaller
reporting company” in Rule 12b-2 of the Exchange Act.
|
Large
accelerated filer x
|
Accelerated
filer o
|
Non-accelerated
filer o
|
Smaller
reporting company o
|
Indicate
by check mark whether the registrant is a shell company (as defined in Rule
12b-2 of the Exchange Act). Yes o No x
The
aggregate market value of the Class A Common Stock outstanding and held by
non-affiliates of the registrant, based upon the closing sale price of the Class
A Common Stock on the NASDAQ Global Select Market System on March 31, 2009, the
last business day of the registrant’s most recently completed second fiscal
quarter, was approximately $867 million.
As of
October 31, 2009, shares of common stock outstanding were: Class A Common Stock
30,331,268 shares
Documents incorporated by
reference: Specified portions of the Proxy Statement for the 2010 Annual
Meeting of Shareholders are incorporated by reference into Part III of this
Report.
The
index to exhibits is on pages 74-76
PART
I
CAUTIONARY
STATEMENT REGARDING FORWARD-LOOKING INFORMATION:
Any
forward-looking statements contained in this Annual Report on Form 10-K
(specifically those contained in Item 1, "Business", Item 1A, “Risk Factors” and
Item 7, "Management's Discussion and Analysis of Financial Condition and Results
of Operations") are included in this report pursuant to the "safe harbor"
provisions of the Private Securities Litigation Reform Act of
1995. Such forward-looking statements involve known and unknown risks
and uncertainties that may cause the Company's actual results in future periods
to be materially different from management's expectations. Although
Matthews International Corporation (“Matthews” or the “Company”) believes that
the expectations reflected in such forward-looking statements are reasonable, no
assurance can be given that such expectations will prove
correct. Factors that could cause the Company's results to differ
materially from the results discussed in such forward-looking statements
principally include changes in domestic or international economic conditions,
changes in foreign currency exchange rates, changes in the cost of materials
used in the manufacture of the Company’s products, changes in death rates,
changes in product demand or pricing as a result of consolidation in the
industries in which the Company operates, changes in product demand or pricing
as a result of domestic or international competitive pressures, unknown risks in
connection with the Company's acquisitions and technological factors beyond the
Company's control. In addition, although the Company does not have
any customers that would be considered individually significant to consolidated
sales, changes in the distribution of the Company’s products or the potential
loss of one or more of the Company’s larger customers are also considered risk
factors.
Matthews,
founded in 1850 and incorporated in Pennsylvania in 1902, is a designer,
manufacturer and marketer principally of memorialization products and brand
solutions. Memorialization products consist primarily of bronze
memorials and other memorialization products, caskets and cremation equipment
for the cemetery and funeral home industries. Brand solutions include
graphics imaging products and services, marking products, and merchandising
solutions. The Company's products and operations are comprised of six business
segments: Bronze, Casket, Cremation, Graphics Imaging, Marking
Products and Merchandising Solutions. The Bronze segment is a leading
manufacturer of cast bronze memorials and other memorialization products, cast
and etched architectural products and is a leading builder of mausoleums in the
United States. The Casket segment is a leading casket manufacturer
and distributor in North America and produces a wide variety of wood and metal
caskets. The Cremation segment is a leading designer and manufacturer
of cremation equipment and cremation caskets primarily in North America. The
Graphics Imaging segment manufactures and provides brand solutions, printing
plates, gravure cylinders, pre-press services and imaging services for the
primary packaging and corrugated industries. The Marking Products
segment designs, manufactures and distributes a wide range of marking and coding
equipment and consumables, and industrial automation products for identifying,
tracking and conveying various consumer and industrial products, components and
packaging containers. The Merchandising Solutions segment designs and
manufactures merchandising displays and systems and provides creative
merchandising and marketing solutions services.
At
October 31, 2009, the Company and its majority-owned subsidiaries had
approximately 4,500 employees. The Company's principal executive
offices are located at Two NorthShore Center, Pittsburgh, Pennsylvania 15212,
its telephone number is
(412)
442-8200 and its internet website is www.matw.com. The
Company files all required reports with the Securities and Exchange Commission
(“SEC”) in accordance with the Exchange Act. These reports are
available free of charge on the Company’s website as soon as practicable after
being filed or furnished to the SEC. The reports filed with the SEC are also
available to read and copy at the SEC’s Public Reference Room at 100 F Street,
N.E., Washington, D.C. 20549 or by contacting the SEC at
1-800-732-0330. All reports filed with the SEC can be found on its
website at www.sec.gov.
The
following table sets forth reported sales and operating profit for the Company's
business segments for the past three fiscal years. Detailed financial
information relating to business segments and to domestic and international
operations is presented in Note 16 (“Segment Information”) to the Consolidated
Financial Statements included in Part II of this Annual Report on Form
10-K.
|
ITEM
1.
|
BUSINESS,
continued
|
|
|
|
Years
Ended September 30,
|
|
|
|
|
2009
|
|
|
2008
|
|
|
2007
|
|
|
|
|
Amount
|
|
|
Percent
|
|
|
Amount
|
|
|
Percent
|
|
|
Amount
|
|
|
Percent
|
|
|
|
|
(Dollars
in Thousands)
|
|
|
Sales
to unaffiliated customers:
|
|
|
|
|
|
|
|
|
|
|
|
|
|
|
Memorialization:
|
|
|
|
|
|
|
|
|
|
|
|
|
|
|
|
|
|
|
|
Bronze
|
|
$ |
215,934 |
|
|
|
27.7 |
% |
|
$ |
243,063 |
|
|
|
29.7 |
% |
|
$ |
229,850 |
|
|
|
30.7 |
% |
|
Casket
|
|
|
203,247 |
|
|
|
26.0 |
|
|
|
219,792 |
|
|
|
26.8 |
|
|
|
210,673 |
|
|
|
28.1 |
|
|
Cremation
|
|
|
30,909 |
|
|
|
4.0 |
|
|
|
26,665 |
|
|
|
3.3 |
|
|
|
25,166 |
|
|
|
3.3 |
|
|
|
|
|
450,090 |
|
|
|
57.7 |
|
|
|
489,520 |
|
|
|
59.8 |
|
|
|
465,689 |
|
|
|
62.1 |
|
|
Brand
Solutions:
|
|
|
|
|
|
|
|
|
|
|
|
|
|
|
|
|
|
|
|
|
|
|
|
|
|
Graphics
Imaging
|
|
|
234,966 |
|
|
|
30.1 |
|
|
|
203,703 |
|
|
|
24.9 |
|
|
|
146,049 |
|
|
|
19.5 |
|
|
Marking
Products
|
|
|
42,355 |
|
|
|
5.4 |
|
|
|
60,031 |
|
|
|
7.3 |
|
|
|
57,450 |
|
|
|
7.7 |
|
|
Merchandising
Solutions
|
|
|
53,497 |
|
|
|
6.8 |
|
|
|
65,369 |
|
|
|
8.0 |
|
|
|
80,164 |
|
|
|
10.7 |
|
|
|
|
|
330,818 |
|
|
|
42.3 |
|
|
|
329,103 |
|
|
|
40.2 |
|
|
|
283,663 |
|
|
|
37.9 |
|
|
Total
|
|
$ |
780,908 |
|
|
|
100.0 |
% |
|
$ |
818,623 |
|
|
|
100.0 |
% |
|
$ |
749,352 |
|
|
|
100.0 |
% |
|
|
|
|
|
|
|
|
|
|
|
|
|
|
|
|
|
|
|
|
|
|
|
|
|
|
|
Operating
profit:
|
|
|
|
|
|
|
|
|
|
|
|
|
|
|
|
|
|
|
|
|
|
|
|
|
|
Memorialization:
|
|
|
|
|
|
|
|
|
|
|
|
|
|
|
|
|
|
|
|
|
|
|
|
|
|
Bronze
|
|
$ |
57,598 |
|
|
|
57.0 |
% |
|
$ |
71,576 |
|
|
|
53.8 |
% |
|
$ |
66,298 |
|
|
|
59.3 |
% |
|
Casket
|
|
|
17,716 |
|
|
|
17.5 |
|
|
|
23,339 |
|
|
|
17.6 |
|
|
|
11,801 |
|
|
|
10.6 |
|
|
Cremation
|
|
|
5,036 |
|
|
|
5.0 |
|
|
|
5,474 |
|
|
|
4.1 |
|
|
|
3,631 |
|
|
|
3.2 |
|
|
|
|
|
80,350 |
|
|
|
79.5 |
|
|
|
100,389 |
|
|
|
75.5 |
|
|
|
81,730 |
|
|
|
73.1 |
|
|
Brand
Solutions:
|
|
|
|
|
|
|
|
|
|
|
|
|
|
|
|
|
|
|
|
|
|
|
|
|
|
Graphics
Imaging
|
|
|
19,217 |
|
|
|
19.0 |
|
|
|
18,617 |
|
|
|
14.0 |
|
|
|
14,439 |
|
|
|
12.9 |
|
|
Marking
Products
|
|
|
1,500 |
|
|
|
1.5 |
|
|
|
9,137 |
|
|
|
6.9 |
|
|
|
9,931 |
|
|
|
8.9 |
|
|
Merchandising
Solutions
|
|
|
(56 |
) |
|
|
- |
|
|
|
4,809 |
|
|
|
3.6 |
|
|
|
5,724 |
|
|
|
5.1 |
|
|
|
|
|
20,661 |
|
|
|
20.5 |
|
|
|
32,563 |
|
|
|
24.5 |
|
|
|
30,094 |
|
|
|
26.9 |
|
|
Total
|
|
$ |
101,011 |
|
|
|
100.0 |
% |
|
$ |
132,952 |
|
|
|
100.0 |
% |
|
$ |
111,824 |
|
|
|
100.0 |
% |
In fiscal
2009, approximately 64% of the Company's sales were made from the United States,
and 32%, 2%, 1% and 1% were made from Europe, Canada, Australia and Asia,
respectively. For further information on Segments see Note 16, “Segment
Information” in Item 8 - “Financial Statements and Supplementary Data” on pages
59 and 60 of this report. Bronze segment products are sold throughout the world
with the segment's principal operations located in the United States, Europe,
Canada, and Australia. Casket segment products are primarily sold in
North America. Cremation segment products and services are sold primarily in
North America, Europe, Asia, and Australia. Products and services of
the Graphics Imaging segment are sold primarily in Europe, the United States and
Asia. The Marking Products segment sells equipment and consumables
directly to industrial consumers and distributors in the United States and
internationally through the Company's subsidiaries in Canada, Sweden and China,
and through other foreign distributors. Matthews owns a minority
interest in Marking Products distributors in Asia, Australia and
Europe. Merchandising Solutions segment products and services are
sold principally in the United States.
|
ITEM
1.
|
BUSINESS,
continued
|
MEMORIALIZATION
PRODUCTS AND MARKETS:
Bronze:
The
Bronze segment manufactures and markets products used primarily in the cemetery
and funeral home industries. The segment's products, which are sold
principally in the United States, Europe, Canada and Australia, include cast
bronze memorials and other memorialization products used primarily in
cemeteries. The segment also manufactures and markets cast and etched
architectural products that are produced from bronze, aluminum and other metals,
which are used to identify or commemorate people, places, events and
accomplishments.
Memorial
products, which comprise the majority of the Bronze segment's sales, include
flush bronze memorials, flower vases, crypt plates and letters, cremation urns,
niche units, cemetery features and statues, along with other related products
and services. Flush bronze memorials are bronze plaques which contain personal
information about a deceased individual such as name, birth date, death date and
emblems. These memorials are used in cemeteries as an alternative to
upright and flush granite monuments. The memorials are even or
"flush" with the ground and therefore are preferred by many cemeteries for
easier mowing and general maintenance. In order to provide products
for the granite memorial and mausoleum markets, the Company's other memorial
products include community and family mausoleums, granite monuments and benches,
bronze plaques, letters, emblems, vases, lights and photoceramics that can be
affixed to granite monuments, mausoleums, crypts and flush memorials. Matthews
is a leading builder of mausoleums within North America. Principal
customers for memorial products are cemeteries and memorial parks, which in turn
sell the Company's products to the consumer.
Customers
of the Bronze segment can also purchase memorials and vases on a “pre-need”
basis. The “pre-need” concept permits families to arrange for these
purchases in advance of their actual need. Upon request, the Company
will manufacture the memorial to the customer’s specifications (e.g., name and
birth date) and place it in storage for future delivery. All
memorials in storage have been paid in full with title conveyed to each pre-need
purchaser.
The
Bronze segment manufactures a full line of memorial products for cremation,
including urns in a variety of sizes, styles and shapes. The segment
also manufactures bronze and granite niche units, which are comprised of
numerous compartments used to display cremation urns in mausoleums and
churches. In addition, the Company also markets turnkey cremation
gardens, which include the design and all related products for a cremation
memorial garden.
Architectural
products include cast bronze and aluminum plaques, etchings and letters that are
used to recognize, commemorate and identify people, places, events and
accomplishments. The Company's plaques are frequently used to
identify the name of a building or the names of companies or individuals located
within a building. Such products are also used to commemorate events
or accomplishments, such as military service or financial
donations. The principal markets for the segment's architectural
products are corporations, fraternal organizations, contractors, churches,
hospitals, schools and government agencies. These products are sold
to and distributed through a network of independent dealers including sign
suppliers, awards and recognition companies, and trophy dealers.
Raw
materials used by the Bronze segment consist principally of bronze and aluminum
ingot, sheet metal, coating materials, photopolymers and construction materials
and are generally available in adequate supply. Ingot is obtained
from various North American, European and Australian smelters.
Competition
from other bronze memorialization product manufacturers is on the basis of
reputation, product quality, delivery, price and design availability. The
Company also competes with upright granite monument and flush granite memorial
providers. The Company believes that its superior quality, broad product lines,
innovative designs, delivery capability, customer responsiveness, experienced
personnel and consumer-oriented merchandising systems are competitive advantages
in its markets. Competition in the mausoleum construction industry
includes various construction companies throughout North America and is on the
basis of design, quality and price. Competitors in the architectural
market are numerous and include companies that manufacture cast and painted
signs, plastic materials, sand-blasted wood and other fabricated
products.
ITEM
1. BUSINESS,
continued
Casket:
The
Casket segment is a leading manufacturer and distributor of caskets in North
America. The segment produces two types of caskets: metal and
wood. Caskets can be customized with many different options such as
color, interior design, handles and trim in order to accommodate specific
religious, ethnic or other personal preferences.
Metal
caskets are made from various gauges of cold-rolled steel,
stainless steel, copper and bronze. Metal caskets are generally
categorized by whether the casket is non-gasketed or gasketed, and by material
(i.e., bronze, copper, or steel) and in the case of steel, by the gauge
(thickness) of the metal.
The
segment's wood caskets are manufactured from nine different species of wood, as
well as from veneer. The species of wood used are poplar, pine, ash,
oak, pecan, maple, cherry, walnut and mahogany. The Casket segment is
a leading manufacturer of all-wood constructed caskets, which are manufactured
using pegged and dowelled construction, and include no metal
parts. All-wood constructed caskets are preferred by certain
religious groups.
The
segment also produces casket components. Casket components include
stamped metal parts, metal locking mechanisms for gasketed metal caskets,
adjustable beds, interior panels and plastic ornamental hardware for the
exterior of the casket. Metal casket parts are produced by stamping
cold-rolled
steel, stainless steel, copper and bronze sheets into casket body
parts. Locking mechanisms and adjustable beds are produced by
stamping and assembling a variety of steel parts. Certain ornamental
hardware styles are produced from injection molded plastic. The
segment purchases from sawmills and lumber distributors various species of
uncured wood, which it dries and cures. The cured wood is processed
into casket components.
Additionally,
the segment provides assortment planning and merchandising and display products
to funeral service businesses. These products assist funeral service
professionals in providing value and satisfaction to their client
families.
The
primary materials required for casket manufacturing are cold-rolled
steel and lumber. The segment also purchases copper, bronze, stainless steel,
cloth, ornamental hardware and coating materials. Purchase orders or supply
agreements are typically negotiated with large, integrated steel producers that
have demonstrated timely delivery, high quality material and competitive
prices. Lumber is purchased from a number of sawmills and lumber
distributors. The Company purchases most of its lumber from sawmills
within 150 miles of its wood casket manufacturing facility in York,
Pennsylvania.
The
segment markets its casket products in the United States through a combination
of Company-owned and independent casket distribution facilities. The
Company operates approximately 45 distribution centers in the United
States. Over 75% of the segment’s casket products are currently sold
through Company-owned distribution centers.
The
casket business is highly competitive. The segment competes with other
manufacturers on the basis of product quality, price, service, design
availability and breadth of product line. The segment provides a line
of casket products that it believes is as comprehensive as any of its major
competitors. There are a large number of casket industry participants
operating in North America, and the industry has recently seen a few new foreign
casket manufacturers, primarily from China, enter the North American market. The
Casket segment and its two largest competitors account for a substantial portion
of the finished caskets produced and sold in North America.
Historically,
the segment's operations have experienced seasonal variations. Generally, casket
sales are higher in the second quarter and lower in the fourth quarter of each
fiscal year. These fluctuations are due in part to the seasonal variance in the
death rate, with a greater number of deaths generally occurring in cold weather
months.
|
ITEM
1.
|
BUSINESS,
continued
|
Cremation:
The
Cremation segment has four major groups of products and services: cremation
equipment, cremation caskets, equipment service and repair, and supplies and
urns.
The
Cremation segment is the leading designer and manufacturer of cremation
equipment, serving North America, Europe, Australia and Asia. Cremation
equipment includes systems for cremation of humans and animals, as well as
equipment for processing the cremated remains and other related equipment such
as handling equipment (tables, cooler racks, vacuums). Cremation
equipment and products are sold primarily to funeral homes, cemeteries,
crematories, animal disposers and veterinarians within North America, Europe,
Australia and Asia.
Cremation
casket products consist primarily of three types of caskets: cloth-covered wood,
cloth-covered corrugated material and paper veneer-covered particleboard and
corrugated material. These products are generally used in cremation
and are marketed principally in the United States through independent
distributors and company-owned distribution centers operated by the Company’s
Casket segment.
Service
and repair consists of maintenance work performed on various makes and models of
cremation equipment. This work can be as simple as routine
maintenance offered at-need or through annual service contracts, or as complex
as complete on-site reconstruction. The principal markets for these
services are the owners and operators of cremation equipment. These
services are marketed principally in North America through Company sales
representatives.
Supplies
and urns are consumable items associated with cremation
operations. Supplies distributed by the segment include operator
safety equipment, identification discs and combustible roller
tubes. Urns distributed by the segment include products ranging from
plastic containers to bronze urns for cremated remains. These
products are marketed primarily in North America.
Raw
materials used by the Cremation segment consist principally of structural steel,
sheet metal, electrical components, cloth, wood, particleboard, corrugated
materials, paper veneer and masonry materials and are generally available in
adequate supply from numerous suppliers.
The
Company competes with several manufacturers in the cremation equipment market
principally on the basis of product quality and price. The Cremation
segment and its three largest competitors account for a substantial portion of
the U.S. cremation equipment market. The cremation casket business is
highly competitive. The segment competes with other cremation casket
manufacturers on the basis of product quality, price and design
availability. Although there are a large number of casket industry
participants, the Cremation segment and its two largest competitors account for
a substantial portion of the cremation caskets sold in the United
States.
Historically,
the segment’s cremation casket operations have experienced seasonal
variations. These fluctuations are due in part to the seasonal
variance in the death rate, with a greater number of deaths generally occurring
in cold weather months.
|
ITEM
1.
|
BUSINESS,
continued
|
BRAND SOLUTIONS PRODUCTS AND
MARKETS:
Graphics
Imaging:
The
Graphics Imaging segment provides brand management, pre-press services, printing
plates and cylinders, embossing tools, and creative design services principally
to the primary packaging and corrugated industries. The primary packaging
industry consists of manufacturers of printed packaging materials such as boxes,
flexible packaging, folding cartons and bags commonly seen at retailers of
consumer goods. The corrugated packaging industry consists of manufacturers of
printed corrugated containers. Other major industries served include
the wallpaper, flooring, automotive, and textile industries.
The
principal products and services of this segment include brand management,
pre-press graphics services, printing plates, gravure cylinders, steel bases,
embossing tools, special purpose machinery, engineering assistance, print
process assistance, print production management, digital asset management,
content management, and package design. These products and services
are used by brand owners and packaging manufacturers to develop and print
packaging graphics that identify and help sell the product in the
marketplace. Other packaging graphics can include nutritional
information, directions for product use, consumer warning statements and UPC
codes. The primary packaging manufacturer produces printed packaging from paper,
film, foil and other composite materials used to display, protect and market the
product. The corrugated packaging manufacturer produces printed containers from
corrugated sheets. Using the Company's products, these sheets are
printed and die cut to make finished containers.
The
segment offers a wide array of value-added services and
products. These include print process and print production management
services; print engineering consultation; pre-press preparation, which includes
computer-generated art, film and proofs; plate mounting accessories and various
press aids; and rotary and flat cutting dies used to cut out intricately
designed containers and point-of-purchase displays. The segment also
provides creative digital graphics services to brand owners and packaging
markets.
The
Company works closely with manufacturers to provide the proper printing forms
and tooling used to print the packaging to the user's
specifications. The segment's printing plate products are made
principally from photopolymer resin and sheet materials. Upon
customer request, plates can be pre-mounted press-ready in a variety of
configurations that maximize print quality and minimize press
set-up time. Gravure cylinders, manufactured from steel, copper
and chrome, can be custom engineered for multiple print processes.
The
Graphics Imaging segment customer base consists primarily of brand owners and
packaging industry converters. Brand owners are generally large,
well-known consumer products companies and retailers with a national or global
presence. These types of companies tend to purchase their graphics
needs directly and supply the printing forms, or the electronic files to make
the printing plates and gravure cylinders, to the packaging printer for their
products. The Graphics Imaging segment serves customers primarily in
Europe, the United States and Asia. In Europe, the segment has its
principal operations in Germany, the United Kingdom, Poland and
Austria.
Major raw
materials for this segment's products include photopolymers, copper, steel, film
and graphic art supplies. All such materials are presently available
in adequate supply from various industry sources.
The
Graphics Imaging segment is one of several manufacturers of printing plates and
cylinders and providers of pre-press services with an international
presence. The segment competes in a fragmented industry consisting of
a few multi-plant regional printing form suppliers and a large number of local
single-facility companies located across Europe and the United
States. The combination of the Company's Graphics Imaging business in
Europe, the United States and Asia is an important part of Matthews’ strategy to
become a worldwide leader in the graphics industry and service multinational
customers on a global basis. Competition is on the basis of product
quality, timeliness of delivery, price and value-added services. The
Company differentiates itself from the competition by consistently meeting
customer demands, its ability to service customers nationally and globally, and
its ability to provide value-added services.
|
ITEM
1.
|
BUSINESS,
continued
|
Marking Products:
The
Marking Products segment designs, manufactures and distributes a wide range of
marking and coding products and related consumables, as well as industrial
automation products. The Company’s products are used by manufacturers
and suppliers to identify, track and convey their products and
packaging. Marking products can range from a simple hand stamp to
microprocessor-based ink-jet printing systems. Coding systems often
integrate into the customer’s manufacturing, inventory tracking and conveyance
control systems. The Company manufactures and markets products and
systems that employ the following marking methods to meet customer
needs: contact printing, indenting, etching and ink-jet
printing. Customers will often use a combination of these methods in
order to achieve an appropriate mark. These methods apply product
information required for identification and traceability as well as to
facilitate inventory and quality control, regulatory compliance and brand name
communication.
The
segment’s industrial automation products are based upon embedded control
architecture to create innovative custom solutions which can be
“productized.” Industries that products are created for include oil
exploration, material handling and security scanning. The material
handling industry customers include the largest automated assembly and mail
sorting companies in the United States.
A
significant portion of the revenue of the Marking Products segment is
attributable to the sale of consumables and replacement parts in connection with
the marking, coding and tracking hardware sold by the Company. The
Company develops inks, rubber and steel consumables in harmony with the marking
equipment in which they are used, which is critical to assure ongoing equipment
reliability and mark quality. Many marking equipment customers also
use the Company's inks, solvents and cleaners.
The
principal customers for the Company's marking products are consumer goods
manufacturers, including food and beverage processors, producers of
pharmaceuticals, and manufacturers of durable goods and building
products. The Company also serves a wide variety of industrial
markets, including metal fabricators, manufacturers of woven and non-woven
fabrics, plastic, rubber and automotive products.
A portion
of the segment's sales are outside the United States and are distributed through
the Company's subsidiaries in Canada, Sweden and China in addition to other
international distributors. Matthews owns a minority interest in
distributors in Asia, Australia and Europe.
The
marking products industry is diverse, with companies either offering limited
product lines for well-defined specialty markets, or similar to the Company,
offering a broad product line and competing in various product markets and
countries. In the United States, the Company has manufactured and
sold marking products and related consumable items since 1850.
Major raw
materials for this segment's products include precision components, electronics,
printing components, tool steels, rubber and chemicals, all of which are
presently available in adequate supply from various sources.
Competition
for marking products is based on product performance, integration into the
manufacturing process, service and price. The Company normally
competes with specialty companies in specific brand marking solutions and
traceability applications. The Company believes that, in general, it
offers the broadest line of marking products to address a wide variety of
marking applications.
|
ITEM
1.
|
BUSINESS,
continued
|
Merchandising
Solutions:
The
Merchandising Solutions segment provides merchandising and printing solutions
for manufacturers and retailers. The segment designs, manufactures
and installs merchandising and display systems, and also provides creative
merchandising and marketing solutions services.
The
majority of the segment’s sales are derived from the design, engineering,
manufacturing and installation of merchandising and display
systems. These systems include permanent and temporary displays,
custom store fixtures, brand concept shops, interactive kiosks, custom
packaging, and screen and digitally printed promotional
signage. Design and engineering services include concept and model
development, graphics design and prototyping. Merchandising and
display systems are manufactured to specifications developed by the segment in
conjunction with the customer. These products are marketed and sold
primarily in the United States.
The
segment operates in a fragmented industry consisting primarily of a number of
small, locally operated companies. Industry competition is intense
and the segment competes on the basis of reliability, creativity and providing a
broad array of merchandising products and services. The segment is
unique in its ability to provide in-depth marketing and merchandising services
as well as design, engineering and manufacturing capabilities. These
capabilities allow the segment to deliver complete turnkey merchandising
solutions quickly and cost effectively.
Major raw
materials for the segment’s products include wood, particleboard, corrugated
materials, structural steel, plastic, laminates, inks, film and graphic art
supplies. All of these raw materials are presently available in
adequate supply from various sources.
PATENTS,
TRADEMARKS AND LICENSES:
The
Company holds a number of domestic and foreign patents and
trademarks. However, the Company believes the loss of any or a
significant number of patents or trademarks would not have a material impact on
consolidated operations or revenues.
BACKLOG:
Because
the nature of the Company's Bronze, Graphics Imaging and Merchandising Solutions
businesses are primarily custom products made to order with short lead times,
backlogs are not generally material except for mausoleums. Backlogs vary in a
range of approximately one year of sales for mausoleums. Backlogs for the Casket
segment and the cremation casket businesses are not material. Cremation
equipment sales backlogs vary in a range of eight to ten months of
sales. Backlogs generally vary in a range of up to four weeks of
sales in the Marking Products segment. The Company’s backlog is
expected to be substantially filled in fiscal 2010.
REGULATORY
MATTERS:
The
Company's operations are subject to various federal, state and local laws and
regulations relating to the protection of the environment. These laws
and regulations impose limitations on the discharge of materials into the
environment and require the Company to obtain and operate in compliance with
conditions of permits and other government authorizations. As such,
the Company has developed environmental, health and safety policies and
procedures that include the proper handling, storage and disposal of hazardous
materials.
The
Company is party to various environmental matters. These include
obligations to investigate and mitigate the effects on the environment of the
disposal of certain materials at various operating and non-operating
sites. The Company is currently performing environmental assessments
and remediation at these sites, as appropriate. In addition, prior to
its acquisition, The York Group, Inc. was identified, along with others, by the
Environmental Protection Agency as a potentially responsible party for
remediation of a landfill
site in York, Pennsylvania. At this time, the Company has not been
joined in any lawsuit or administrative order related to the site or its
clean-up.
|
ITEM
1.
|
BUSINESS,
continued
|
At
September 30, 2009, an accrual of approximately $7.3 million had been recorded
for environmental remediation (of which $836,000 was classified in other current
liabilities), representing management's best estimate of the probable and
reasonably estimable costs of the Company's known remediation
obligations. The accrual does not consider the effects of inflation
and anticipated expenditures are not discounted to their present
value. While final resolution of these contingencies could result in
costs different than current accruals, management believes the ultimate outcome
will not have a significant effect on the Company's consolidated results of
operations or financial position.
ITEM
1A. RISK FACTORS.
There are
inherent risks and uncertainties associated with the Company’s businesses that
could adversely affect its operating performance and financial
condition. Set forth below are descriptions of those risks and
uncertainties that the Company currently believes to be
material. Additional risks not currently known or deemed immaterial
may also result in adverse effects on the Company.
Changes in Economic
Conditions. Generally, changes in domestic and international
economic conditions affect the industries in which the Company and its customers
and suppliers operate. These changes include changes in the rate of
consumption or use of the Company’s products due to economic downturns,
volatility in currency exchange rates, and changes in raw material prices
resulting from supply and/or demand conditions.
Uncertainty
about the current unprecedented global economic conditions poses a risk, as
consumers and businesses may continue to postpone or cancel
spending. Other factors that could influence customer spending
include energy costs, conditions in the credit markets, consumer confidence and
other factors affecting consumer spending behavior. These and other
economic factors could have an effect on demand for the Company’s products and
services and negatively impact the Company’s financial condition and results of
operations.
Changes in Foreign Currency Exchange
Rates. Manufacturing
and sales of a significant portion of the Company’s products are outside the
United States, and accordingly, the Company holds assets, incurs liabilities,
earns revenue and pays expenses in a variety of currencies. The
Company’s consolidated financial statements are presented in U.S. dollars, and
therefore, the Company must translate the reported values of its foreign assets,
liabilities, revenue and expenses into U.S. dollars. Increases or
decreases in the value of the U.S. dollar compared to foreign currencies may
negatively affect the value of these items in the Company’s consolidated
financial statements, even though their value has not changed in local
currency.
Increased Prices for Raw
Materials. The Company’s
profitability is affected by the prices of the raw materials used in the
manufacture of its products. These prices may fluctuate based on a
number of factors, including changes in supply and demand, domestic and global
economic conditions, currency exchange rates, labor costs and fuel-related costs. If
suppliers increase the price of critical raw materials, alternative sources of
supply, or an alternative material, may not exist. In addition, to
the extent that the Company has quoted prices to or has existing contracts with
customers, it may be unable to increase the price of its products to offset the
increased costs. Significant raw material price increases that cannot
be mitigated by selling price increases or productivity improvements will
negatively affect the Company’s results of operations.
ITEM
1. BUSINESS,
continued
Changes in Mortality and Cremation
Rates. Generally,
life expectancy in the United States and other countries in which the Company’s
Memorialization businesses operate has increased steadily for several decades
and is expected to continue to do so in the future. The increase in
life expectancy is also expected to impact the number of deaths in the
future. Additionally, cremations have steadily grown as a percentage
of total deaths in the United States since the 1960’s, and are expected to
continue to increase in the future. The Company expects that these
trends will continue in the future, and the result may affect the volume of
bronze memorialization products and burial caskets sold in the United
States. However, sales of the Company’s Cremation segment may benefit
from the growth in cremations.
Changes in Product Demand or Pricing.
The Company’s businesses have and will continue to operate in competitive
markets. Changes in product demand or pricing are affected by domestic and
foreign competition and an increase in consolidated purchasing by large
customers operating in both domestic and global markets. The Memorialization
businesses generally operate in markets with ample supply capacity and demand
which is correlated to death rates. The Brand Solutions businesses
serve global customers that are requiring their suppliers to be global in scope
and price competitive. Additionally, in recent years the Company has
witnessed an increase in products manufactured offshore, primarily in China, and
imported into the Company’s U.S. markets. It is expected that these
trends will continue and may affect the Company’s future results of
operations.
Risks in Connection with
Acquisitions. The Company
has grown in part through acquisitions, and continues to evaluate acquisition
opportunities that have the potential to support and strengthen its
businesses. There is no assurance however that future acquisition
opportunities will arise, or that if they do, that they will be
consummated. In addition, acquisitions involve inherent risks that
the businesses acquired will not perform in accordance with expectations, or
that synergies expected from the integration of the acquisitions will not be
achieved as rapidly as expected, if at all. Failure to effectively integrate
acquired businesses could prevent the realization of expected rates of return on
the acquisition investment and could have a negative effect on the Company’s
results of operations and financial condition.
Technological Factors Beyond the
Company’s Control. The Company
operates in certain markets in which technological product development
contributes to its ability to compete effectively. There can be no
assurance that the Company will be able to develop new products, that new
products can be manufactured and marketed profitably, or that new products will
successfully meet the expectations of customers.
Changes in the Distribution of the
Company’s Products or the Loss of a Large Customer. Although the
Company does not have any customer that is considered individually significant
to consolidated sales, it does have contracts with several large customers in
both the Memorialization and Brand Solutions businesses. While these
contracts provide important access to large purchasers of the Company’s
products, they can obligate the Company to sell products at contracted prices
for extended periods of time which may, in the short-term, limit the Company’s
ability to increase prices in response to significant raw material price
increases or other factors. Additionally, any significant divestiture
of business properties or operations by current customers could result in a loss
of business if the Company is not able to maintain the business with the
subsequent owners of the properties.
ITEM
1B. UNRESOLVED STAFF COMMENTS.
Not
Applicable.
Principal
properties of the Company and its majority-owned subsidiaries as of October 31,
2009 were as follows (properties are owned by the Company except as
noted):
|
Location
|
|
Description
of Property
|
|
|
Bronze:
|
|
|
|
|
Pittsburgh,
PA
|
|
Manufacturing
/ Division Offices
|
|
|
Kingwood,
WV
|
|
Manufacturing
|
|
|
Melbourne,
Australia
|
|
Manufacturing
|
(1)
|
|
Parma,
Italy
|
|
Manufacturing
/ Warehouse
|
(1)
|
|
Searcy,
AR
|
|
Manufacturing
|
|
|
Seneca
Falls, NY
|
|
Manufacturing
|
|
|
|
|
|
|
|
Casket
(2):
|
|
|
|
|
Monterrey,
Mexico
|
|
Manufacturing
|
(1)
|
|
Richmond,
IN
|
|
Manufacturing
|
(1)
|
|
Richmond,
IN
|
|
Manufacturing
/ Metal Stamping
|
|
|
Richmond,
IN
|
|
Injection
Molding
|
(1)
|
|
York,
PA
|
|
Manufacturing
|
|
|
|
|
|
|
|
Cremation:
|
|
|
|
|
Apopka,
FL
|
|
Manufacturing
/ Division Offices
|
|
|
Richmond,
IN
|
|
Manufacturing
|
(1)
|
|
Udine,
Italy
|
|
Manufacturing
|
(1)
|
|
|
|
|
|
|
Graphics
Imaging:
|
|
|
|
|
Pittsburgh,
PA
|
|
Manufacturing
/ Division Offices
|
|
|
Julich,
Germany
|
|
Manufacturing
/ Division Offices
|
|
|
Atlanta,
GA
|
|
Manufacturing
|
|
|
Beverly,
MA
|
|
Manufacturing
|
(1)
|
|
Bristol,
England
|
|
Manufacturing
|
|
|
Dallas,
TX
|
|
Manufacturing
|
(1)
|
|
Goslar,
Germany
|
|
Manufacturing
|
(1)
|
|
Leeds,
England
|
|
Manufacturing
|
(1)
|
|
Monchengladbach,
Germany
|
|
Manufacturing
|
|
|
Munich,
Germany
|
|
Manufacturing
|
(1)
|
|
Nuremberg,
Germany
|
|
Manufacturing
|
(1)
|
|
Oakland,
CA
|
|
Manufacturing
|
(1)
|
|
Poznan,
Poland
|
|
Manufacturing
|
|
|
St.
Louis, MO
|
|
Manufacturing
|
|
|
Shenzhen,
China
|
|
Manufacturing
|
(1)
|
|
Vienna,
Austria
|
|
Manufacturing
|
(1)
|
|
Vreden,
Germany
|
|
Manufacturing
|
|
|
Wan
Chai, Hong Kong
|
|
Manufacturing
|
(1)
|
|
|
|
|
|
|
Marking
Products:
|
|
|
|
|
Pittsburgh,
PA
|
|
Manufacturing
/ Division Offices
|
|
|
Gothenburg,
Sweden
|
|
Manufacturing
/ Distribution
|
(1)
|
|
Tualatin,
OR
|
|
Manufacturing
|
(1)
|
|
Beijing,
China
|
|
Manufacturing
|
(1)
|
|
|
|
|
|
|
ITEM
2.
|
PROPERTIES,
continued
|
|
Location
|
|
Description
of Property
|
|
|
|
|
|
|
|
Merchandising
Solutions:
|
|
|
|
|
East
Butler, PA
|
|
Manufacturing
/ Division Offices
|
|
|
|
|
|
|
|
Corporate
Office:
|
|
|
|
|
Pittsburgh,
PA
|
|
General
Offices
|
|
|
(1)
|
These
properties are leased by the Company under operating lease arrangements.
Rent expense incurred by the Company for all leased facilities was
approximately $13.3 million in fiscal
2009.
|
|
(2)
|
In
addition to the properties listed, the Casket division leases warehouse
facilities totaling approximately 836,000 square feet in 23 states under
operating leases.
|
All of
the owned properties are unencumbered. The Company believes its
facilities are generally well suited for their respective uses and are of
adequate size and design to provide the operating efficiencies necessary for the
Company to be competitive. The Company's facilities provide adequate
space for meeting its near-term production requirements and have availability
for additional capacity. The Company intends to continue to expand
and modernize its facilities as necessary to meet the demand for its
products.
|
|
ITEM
3. LEGAL PROCEEDINGS.
|
Matthews
is subject to various legal proceedings and claims arising in the ordinary
course of business. Management does not expect that the results of
any of these legal proceedings will have a material adverse effect on Matthews’
financial condition, results of operations or cash flows.
ITEM
4. SUBMISSION OF MATTERS TO A VOTE OF SECURITY HOLDERS.
No
matters were submitted to a vote of the Company's security holders during the
fourth quarter of fiscal 2009.
OFFICERS
AND EXECUTIVE MANAGEMENT OF THE REGISTRANT
The
following information is furnished with respect to officers and executive
management as of October 31, 2009:
|
Name
|
|
Age
|
|
Positions
with Registrant
|
|
|
|
|
|
|
|
Joseph
C. Bartolacci
|
|
49
|
|
President
and Chief Executive Officer
|
|
|
|
|
|
|
|
David
F. Beck
|
|
57
|
|
Controller
|
|
|
|
|
|
|
|
Jennifer
A. Ciccone
|
|
42
|
|
Vice
President, Human Resources
|
|
|
|
|
|
|
|
C.
Michael Dempe
|
|
53
|
|
Chief
Operating Officer, IDL Worldwide, Inc.
|
|
|
|
|
|
|
|
James
P. Doyle
|
|
58
|
|
Group
President, Memorialization
|
|
|
|
|
|
|
|
Brian
J. Dunn
|
|
52
|
|
Group
President, Graphics and Marking Products
|
|
|
|
|
|
|
|
Paul
C. Jensen
|
|
51
|
|
President,
Marking Products Division
|
|
|
|
|
|
|
|
Sean
F. Lydon
|
|
46
|
|
President,
Packaging Graphics Division
|
|
|
|
|
|
|
|
Steven
F. Nicola
|
|
49
|
|
Chief
Financial Officer, Secretary and Treasurer
|
|
|
|
|
|
|
|
Paul
F. Rahill
|
|
52
|
|
President,
Cremation Division
|
|
|
|
|
|
|
|
Franz
J. Schwarz
|
|
61
|
|
President,
Graphics Europe
|
|
|
|
|
|
|
|
Brian
D. Walters
|
|
40
|
|
Vice
President and General Counsel
|
|
|
|
|
|
|
Joseph C. Bartolacci was
appointed President and Chief Executive Officer effective October 1,
2006. He had been President and Chief Operating Officer since
September 1, 2005. Mr. Bartolacci was elected to the Board of
Directors on November 15, 2005. He had been President, Casket
Division since February 2004 and Executive Vice President of Matthews since
January 1, 2004. He had been President, Matthews Europe since April
2002. Prior thereto, he was President, Caggiati, S.p.A. (a wholly-owned
subsidiary of Matthews International Corporation) and served as General Counsel
of Matthews.
David F. Beck was appointed
Controller effective September 15, 2003.
Jennifer A. Ciccone was
appointed Vice President, Human Resources effective February 19,
2009. Prior thereto, Ms. Ciccone had been Director, Corporate Human
Resources since 2006. Ms. Ciccone joined the Company in 1998 and has
held various managerial positions within the Company’s Human Resources
Department.
C. Michael Dempe has served as
Chief Operating Officer of IDL Worldwide, Inc. (formerly Cloverleaf Group,
Inc.), a wholly-owned subsidiary of Matthews, since July 2004.
James P. Doyle joined the
Company as Group President, Memorialization in December 2006. Prior
to joining Matthews, he served as President, Kohler Engine Business (a
manufacturer of air and liquid-cooled four cycle engines), a division of Kohler
Company, from 2004 to 2006.
Brian J. Dunn was appointed
Group President, Graphics and Marking Products effective September 1,
2007. Prior thereto, Mr. Dunn had been President, Marking Products
Division.
OFFICERS AND EXECUTIVE
MANAGEMENT OF THE REGISTRANT, continued
Paul C. Jensen was appointed
President, Marking Products Division in November 2008. Prior thereto,
Mr. Jensen served as Vice President, Division Technology for the Marking
Products Division from March 2007, and served as Vice President of Holjeron
Corporation, a wholly-owned subsidiary of Matthews, since July
2004.
Sean F. Lydon was appointed
President, Packaging Graphics Division in October 2008. He joined
Matthews in July 2008 as an Operations Manager in the Company’s Graphics Imaging
segment. Prior to joining Matthews, he served as Director, Supply
Chain Operations at Sony Electronics from 2001 to 2008.
Steven F. Nicola was appointed
Chief Financial Officer, Secretary and Treasurer effective December 1,
2003.
Paul F. Rahill was appointed
President, Cremation Division in October 2002.
Franz J. Schwarz was named
President, Graphics Europe in May 2006. He had been Managing Director
of S+T Reprotechnik GmbH (“S+T GmbH”) (formerly Matthews International GmbH), a
wholly-owned subsidiary of Matthews International Corporation, since 2000. He
was a partial owner of S+T GmbH, a provider of printing plates and print
services located in Julich, Germany, until September 30,
2005. Matthews owns 100% of S+T GmbH.
Brian D. Walters was appointed
Vice President and General Counsel effective February 19, 2009. Mr.
Walters joined the Company as Legal Counsel in 2005. Prior to joining
the Company, Mr. Walters was a partner with Fried, Walters, Zuschlag &
Grochmal, a law firm in Pittsburgh, Pennsylvania.
PART
II
|
|
ITEM
5. MARKET FOR REGISTRANT'S COMMON EQUITY AND RELATED
STOCKHOLDER MATTERS.
|
Market
Information:
The
authorized common stock of the Company consists of 70,000,000 shares of Class A
Common Stock, $1 par value. The Company's Class A Common Stock is
traded on the NASDAQ Global Select Market System under the symbol
“MATW”. The following table sets forth the high, low and closing
prices as reported by NASDAQ for the periods indicated:
|
|
|
High
|
|
|
Low
|
|
|
Close
|
|
|
Fiscal
2009:
|
|
|
|
|
|
|
|
|
|
|
Quarter
ended: September 30,
2009
|
|
$ |
36.79 |
|
|
$ |
28.00 |
|
|
$ |
35.38 |
|
|
June
30, 2009
|
|
|
32.17 |
|
|
|
27.11 |
|
|
|
31.12 |
|
|
March
31, 2009
|
|
|
40.52 |
|
|
|
27.67 |
|
|
|
28.81 |
|
|
December
31, 2008
|
|
|
51.05 |
|
|
|
32.30 |
|
|
|
36.68 |
|
|
|
|
|
|
|
|
|
|
|
|
|
|
|
|
Fiscal
2008:
|
|
|
|
|
|
|
|
|
|
|
|
|
|
Quarter
ended: September 30,
2008
|
|
$ |
58.55 |
|
|
$ |
43.71 |
|
|
$ |
50.74 |
|
|
June
30, 2008
|
|
|
52.00 |
|
|
|
44.92 |
|
|
|
45.26 |
|
|
March
31, 2008
|
|
|
50.75 |
|
|
|
43.28 |
|
|
|
48.25 |
|
|
December
31, 2007
|
|
|
49.50 |
|
|
|
39.93 |
|
|
|
46.87 |
|
The
Company has a stock repurchase program, which was initiated in
1996. Under the program, the Company's Board of Directors has
authorized the repurchase of a total of 12,500,000 shares of Matthews’ common
stock, of which 12,279,922 shares have been repurchased as of September 30,
2009. The buy-back program is designed to increase shareholder value,
enlarge the Company's holdings of its common stock, and add to earnings per
share. Repurchased shares may be retained in treasury, utilized for
acquisitions, or reissued to employees or other purchasers, subject to the
restrictions of the Company’s Restated Articles of Incorporation.
All
purchases of the Company’s common stock during fiscal 2009 were part of this
repurchase program.
|
ITEM
5.
|
MARKET FOR
REGISTRANT'S COMMON EQUITY AND RELATED STOCKHOLDER MATTERS,
continued
|
The
following table shows the monthly fiscal 2009 stock repurchase
activity:
|
Period
|
|
Total
number of shares purchased
|
|
|
Average
price paid per share
|
|
|
Total
number of shares purchased as part of a publicly announced
plan
|
|
|
Maximum
number of shares that may yet be purchased under the plan
|
|
|
|
|
|
|
|
|
|
|
|
|
|
|
|
|
October
2008
|
|
|
295,000 |
|
|
$ |
43.14 |
|
|
|
295,000 |
|
|
|
721,994 |
|
|
November
2008
|
|
|
40,266 |
|
|
|
35.45 |
|
|
|
40,266 |
|
|
|
681,728 |
|
|
December
2008
|
|
|
45,000 |
|
|
|
37.64 |
|
|
|
45,000 |
|
|
|
636,728 |
|
|
January
2009
|
|
|
10,000 |
|
|
|
33.66 |
|
|
|
10,000 |
|
|
|
626,728 |
|
|
February
2009
|
|
|
52,500 |
|
|
|
35.43 |
|
|
|
52,500 |
|
|
|
574,228 |
|
|
March
2009
|
|
|
172,500 |
|
|
|
29.49 |
|
|
|
172,500 |
|
|
|
401,728 |
|
|
April
2009
|
|
|
47,500 |
|
|
|
27.96 |
|
|
|
47,500 |
|
|
|
354,228 |
|
|
May
2009
|
|
|
600 |
|
|
|
29.60 |
|
|
|
600 |
|
|
|
353,628 |
|
|
June
2009
|
|
|
93,050 |
|
|
|
30.62 |
|
|
|
93,050 |
|
|
|
260,578 |
|
|
July
2009
|
|
|
- |
|
|
|
- |
|
|
|
- |
|
|
|
260,578 |
|
|
August
2009
|
|
|
500 |
|
|
|
36.03 |
|
|
|
500 |
|
|
|
260,078 |
|
|
September
2009
|
|
|
40,000 |
|
|
|
35.39 |
|
|
|
40,000 |
|
|
|
220,078 |
|
|
Total
|
|
|
796,916 |
|
|
$ |
36.09 |
|
|
|
796,916 |
|
|
|
|
|
Holders:
Based on
records available to the Company, the number of registered holders of the
Company's common stock was 531 at October
31, 2009.
Dividends:
A
quarterly dividend of $.07 per share was paid for the fourth quarter of fiscal
2009 to shareholders of record on November 2, 2009. The Company paid quarterly
dividends of $.065 per share for the first three quarters of fiscal 2009 and the
fourth quarter of fiscal 2008. The Company paid quarterly
dividends of $.06 per share for the first three quarters of fiscal 2008 and the
fourth quarter of fiscal 2007. The Company paid quarterly dividends
of $.055 per share for the first three quarters of fiscal 2007.
Cash
dividends have been paid on common shares in every year for at least the past
forty years. It is the present intention of the Company to continue
to pay quarterly cash dividends on its common stock. However, there
is no assurance that dividends will be declared and paid as the declaration and
payment of dividends is at the discretion of the Board of Directors of the
Company and is dependent upon the Company's financial condition, results of
operations, cash requirements, future prospects and other factors deemed
relevant by the Board.
|
ITEM
5.
|
MARKET FOR
REGISTRANT'S COMMON EQUITY AND RELATED STOCKHOLDER MATTERS,
continued
|
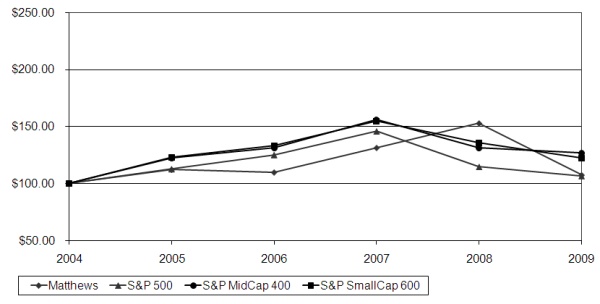
Performance
Graph:
COMPARISON
OF FIVE-YEAR CUMULATIVE RETURN *
AMONG
MATTHEWS INTERNATIONAL CORPORATION,
S&P
500 INDEX, S&P MIDCAP 400 INDEX AND S&P SMALLCAP 600 INDEX
**
* Total
return assumes dividend reinvestment
** Fiscal
year ended September 30
Note:
Performance graph assumes $100 invested on October 1, 2004 in Matthews
International Corporation Common Stock, Standard & Poor's (S&P) 500
Index, S&P MidCap 400 Index and S&P SmallCap 600 Index. The
results are not necessarily indicative of future performance.
|
|
ITEM
6. SELECTED FINANCIAL
DATA.
|
|
|
|
Years
Ended September 30,
|
|
|
|
|
2009(1)
|
|
|
2008(2)
|
|
|
2007(3)
|
|
|
2006(4)
|
|
2005
|
|
|
|
|
(Amounts
in thousands, except per share data)
|
|
|
|
|
(Not Covered by Report of Independent Registered Public Accounting
Firm)
|
|
|
|
|
|
|
|
|
|
|
|
|
|
|
|
|
|
|
|
Net
sales
|
|
$ |
780,908 |
|
|
$ |
818,623 |
|
|
$ |
749,352 |
|
|
$ |
715,891 |
|
|
$ |
639,822 |
|
|
|
|
|
|
|
|
|
|
|
|
|
|
|
|
|
|
|
|
|
|
|
|
Gross
profit
|
|
|
294,777 |
|
|
|
322,964 |
|
|
|
280,457 |
|
|
|
271,933 |
|
|
|
223,075 |
|
|
|
|
|
|
|
|
|
|
|
|
|
|
|
|
|
|
|
|
|
|
|
|
Operating
profit
|
|
|
101,011 |
|
|
|
132,952 |
|
|
|
111,824 |
|
|
|
113,884 |
|
|
|
98,413 |
|
|
|
|
|
|
|
|
|
|
|
|
|
|
|
|
|
|
|
|
|
|
|
|
Interest
expense
|
|
|
12,053 |
|
|
|
10,405 |
|
|
|
8,119 |
|
|
|
6,995 |
|
|
|
2,966 |
|
|
|
|
|
|
|
|
|
|
|
|
|
|
|
|
|
|
|
|
|
|
|
|
Income
before income taxes
|
|
|
88,543 |
|
|
|
121,572 |
|
|
|
103,716 |
|
|
|
105,408 |
|
|
|
93,056 |
|
|
|
|
|
|
|
|
|
|
|
|
|
|
|
|
|
|
|
|
|
|
|
|
Income
taxes
|
|
|
30,811 |
|
|
|
42,088 |
|
|
|
38,990 |
|
|
|
38,964 |
|
|
|
34,985 |
|
|
|
|
|
|
|
|
|
|
|
|
|
|
|
|
|
|
|
|
|
|
|
|
Net
income
|
|
$ |
57,732 |
|
|
$ |
79,484 |
|
|
$ |
64,726 |
|
|
$ |
66,444 |
|
|
$ |
58,071 |
|
|
|
|
|
|
|
|
|
|
|
|
|
|
|
|
|
|
|
|
|
|
|
|
|
|
|
|
|
|
|
|
|
|
|
|
|
|
|
|
|
|
|
|
|
|
Earnings
per common share:
|
|
|
|
|
|
|
|
|
|
|
|
|
|
|
|
|
|
|
|
|
|
Basic
|
|
|
$1.91 |
|
|
|
$2.57 |
|
|
|
$2.05 |
|
|
|
$2.08 |
|
|
|
$1.81 |
|
|
Diluted
|
|
|
1.90 |
|
|
|
2.55 |
|
|
|
2.04 |
|
|
|
2.06 |
|
|
|
1.79 |
|
|
|
|
|
|
|
|
|
|
|
|
|
|
|
|
|
|
|
|
|
|
|
|
Weighted-average
common
|
|
|
|
|
|
|
|
|
|
|
|
|
|
|
|
|
|
|
|
|
|
shares
outstanding:
|
|
|
|
|
|
|
|
|
|
|
|
|
|
|
|
|
|
|
|
|
|
Basic
|
|
|
30,245 |
|
|
|
30,928 |
|
|
|
31,566 |
|
|
|
31,999 |
|
|
|
32,116 |
|
|
Diluted
|
|
|
30,435 |
|
|
|
31,158 |
|
|
|
31,680 |
|
|
|
32,252 |
|
|
|
32,381 |
|
|
|
|
|
|
|
|
|
|
|
|
|
|
|
|
|
|
|
|
|
|
|
|
Cash
dividends per share
|
|
|
$.265 |
|
|
|
$.245 |
|
|
|
$.225 |
|
|
|
$.205 |
|
|
|
$.185 |
|
|
|
|
|
|
|
|
|
|
|
|
|
|
|
|
|
|
|
|
|
|
|
|
Total
assets
|
|
$ |
949,653 |
|
|
$ |
914,282 |
|
|
$ |
771,069 |
|
|
$ |
716,090 |
|
|
$ |
665,455 |
|
|
Long-term
debt, non-current
|
|
|
237,530 |
|
|
|
219,124 |
|
|
|
142,273 |
|
|
|
120,289 |
|
|
|
118,952 |
|
|
(1)
|
Fiscal
2009 included pre-tax unusual charges of approximately $16,500, which
primarily consisted of severance and other costs related to the
consolidation of certain production operations within the Company’s Bronze
segment, costs related to operational and systems improvements in several
of the Company’s other businesses, and asset adjustments resulting from
current market conditions. In addition, fiscal 2009 earnings
included the favorable effect of an adjustment of $1,255 to income tax
expense primarily related to the Company’s ability to utilize a European
tax loss carryover generated in prior years and changes in the estimated
tax accruals for open tax periods.
|
|
(2)
|
Fiscal
2008 included a reduction in income taxes of $1,882 to reflect the
adjustment of net deferred tax liabilities resulting from the enactment of
lower statutory income tax rates in certain European
countries.
|
|
(3)
|
Fiscal
2007 included a net pre-tax charge of approximately $8,765 which consisted
primarily of special charges related to the acceleration of earn-out
payments in the resolution of employment agreements from the Milso
Industries acquisition and pre-tax charges related to severance costs
incurred in several of the Company’s segments, partially offset by a
pre-tax gain on the sale of the marketing consultancy business of the
Merchandising Solutions segment and favorable legal settlements, net of
related legal costs, in the Casket
segment.
|
|
(4)
|
Fiscal
2006 included a net pre-tax gain of $1,016 which consisted of a pre-tax
gain from the sale of a facility, partially offset by a pre-tax charge
related to asset impairments and related
costs.
|
|
|
ITEM 7. MANAGEMENT'S DISCUSSION AND
ANALYSIS OF FINANCIAL CONDITION AND RESULTS OF
OPERATIONS.
|
The
following discussion should be read in conjunction with the consolidated
financial statements of Matthews International Corporation and related notes
thereto. In addition, see "Cautionary Statement Regarding
Forward-Looking Information" included in Part I of this Annual Report on Form
10-K.
The
following table sets forth certain income statement data of the Company
expressed as a percentage of net sales for the periods indicated and the
percentage change in such income statement data from year to year.
|
|
|
Years
Ended September 30,
|
|
|
Percentage
Change
|
|
|
|
|
|
|
|
|
|
|
|
|
|
|
|
|
|
|
|
|
|
2009
|
|
|
2008
|
|
|
2007
|
|
|
|
2009-2008 |
|
|
|
2008-2007 |
|
|
Sales
|
|
|
100.0 |
% |
|
|
100.0 |
% |
|
|
100.0 |
% |
|
|
(4.6 |
)% |
|
|
9.2 |
% |
|
Gross
profit
|
|
|
37.7 |
|
|
|
39.5 |
|
|
|
37.4 |
|
|
|
(8.7 |
) |
|
|
15.2 |
|
|
Operating
profit
|
|
|
12.9 |
|
|
|
16.2 |
|
|
|
14.9 |
|
|
|
(24.0 |
) |
|
|
18.9 |
|
|
Income
before taxes
|
|
|
11.3 |
|
|
|
14.9 |
|
|
|
13.8 |
|
|
|
(27.2 |
) |
|
|
17.2 |
|
|
Net
income
|
|
|
7.4 |
|
|
|
9.7 |
|
|
|
8.6 |
|
|
|
(27.4 |
) |
|
|
22.8 |
|
Comparison
of Fiscal 2009 and Fiscal 2008:
Sales for
the year ended September 30, 2009 were $780.9 million, compared to $818.6
million for the year ended September 30, 2008. Excluding the effects
of acquisitions, sales declined in each of the Company’s segments. The impact of
the global recession, an estimated lower domestic casketed death rate compared
to a year ago and changes in foreign currency values against the U.S. dollar
were the principal factors in the reduction in the Company’s consolidated
sales. The declines were partially offset by the acquisitions of
Saueressig GmbH & Co. KG (“Saueressig”), a manufacturer of gravure printing
cylinders, in May 2008 and the acquisition of a small European cremation
equipment manufacturer in December 2008. For the year ended September
30, 2009, changes in foreign currency values against the U.S. dollar had an
unfavorable impact of approximately $24.6 million on the Company’s consolidated
sales compared to the year ended September 30, 2008.
In the
Memorialization businesses, Bronze segment sales for fiscal 2009 were $215.9
million compared to $243.1 million for fiscal 2008. The decrease
primarily reflected a decline in unit volume and decreases in the value of
foreign currencies against the U.S. dollar. Sales for the Casket
segment were $203.2 million for fiscal 2009 compared to $219.8 million for the
same period in fiscal 2008. The decrease mainly resulted from lower
unit volume and an unfavorable change in product mix. The decline in
sales for both the Bronze and Casket segments reflected the impact of the
recession on consumer spending, and a decline in the estimated number of
casketed deaths compared to the prior year. Sales for the Cremation
segment were $30.9 million for fiscal 2009 compared to $26.7 million a year
ago. The increase principally resulted from the acquisition of a
small European cremation equipment manufacturer. In the Company’s
Brand Solutions businesses, sales for the Graphics Imaging segment in fiscal
2009 were $235.0 million, compared to $203.7 million a year ago. The
increase resulted from the inclusion of Saueressig for a full year in fiscal
2009, compared to five months in fiscal 2008. Excluding this
acquisition, sales were lower in this segment as a result of weak economic
conditions and a decrease in the values of foreign currencies against the U.S.
dollar. Marking Products segment sales for the year ended September 30,
2009 were $42.4 million, compared to $60.0 million for fiscal
2008. The decrease was principally due to lower product demand in the
U.S. and foreign markets, reflecting a decline in industrial capital spending
and lower sales of consumables. In addition, Marking Products sales
were adversely affected by an unfavorable change in the value of foreign
currencies against the U.S. dollar. Sales for the Merchandising
Solutions segment were $53.5 million for fiscal 2009, compared to $65.4 million
a year ago. The decrease is attributable to a decline in volume
mainly due to project delays or cancellations by customers, also resulting from
the downturn in the U.S. economy.
|
ITEM
7.
|
MANAGEMENT'S
DISCUSSION AND ANALYSIS,
continued
|
Gross
profit for the year ended September 30, 2009 was $294.8 million, compared to
$323.0 million for fiscal 2008. Consolidated gross profit as a
percent of sales decreased to 37.7% for fiscal 2009 from 39.5% for fiscal
2008. The decrease in consolidated gross profit primarily reflected
the impact of lower sales, unfavorable changes in the values of foreign
currencies against the U.S. dollar, and unusual charges. Unusual
charges included in cost of goods sold totaled $9.0 million and consisted of
severance and other expenses related to the facilities consolidations in the
Bronze segment, downsizing initiatives in the Sweden operations of the Marking
Products segment and costs related to operational and system improvements in
several of the Company’s other segments.
Selling
and administrative expenses for the year ended September 30, 2009 were $193.8
million, compared to $190.0 million for fiscal 2008. Consolidated
selling and administrative expenses as a percent of sales were 24.8% for the
year ended September 30, 2009, compared to 23.2% last year. The
increases in costs and percentage of sales primarily resulted from the
Saueressig acquisition and unusual charges. Unusual charges included
in fiscal 2009 selling and administrative expenses totaled approximately $7.5
million, and consisted principally of Saueressig integration costs, bad debt
expense, termination-related expenses and costs related to operational and
system improvements.
Operating
profit for fiscal 2009 was $101.0 million, compared to $133.0 million for fiscal
2008. Operating profit for fiscal 2009 included unusual charges of
approximately $16.5 million. In addition, changes in the values of
foreign currencies against the U.S. dollar had an unfavorable impact of
approximately $3.1 million on consolidated operating profit, compared to the
prior year. Bronze segment operating profit for fiscal 2009 was $57.6
million, compared to $71.6 million for fiscal 2008. The decrease
reflected the impact of lower sales and an unfavorable change in the value
of foreign currencies against the U.S. dollar. Additionally, Bronze
segment operating profit included unusual charges of approximately $7.2 million,
principally related to facilities consolidations. Operating profit
for the Casket segment for fiscal 2009 was $17.7 million, compared to $23.3
million for fiscal 2008. The decrease resulted mainly from lower
sales and unusual charges of approximately $2.7 million, which were principally
related to bad debt expense, severance and other employment termination-related
expenses and cost structure initiatives in the segment’s distribution
operations. Cremation segment operating profit for the year ended
September 30, 2009 was $5.0 million, compared to $5.5 million a year
ago. The decrease was mainly attributable to the impact of lower
domestic sales and unusual charges of approximately $272,000, partially offset
by the acquisition of a small European cremation equipment
manufacturer. The Graphics Imaging segment operating profit for
fiscal 2009 was $19.2 million, compared to $18.6 million for
2008. The increase principally reflected the Saueressig acquisition,
offset by the impact of lower sales, unfavorable changes in the values of
foreign currencies against the U.S. dollar, and unusual charges of approximately
$3.1 million, which consisted principally of severance charges, asset
impairments and Saueressig integration costs. Operating profit for
the Marking Products segment for fiscal 2009 was $1.5 million, compared to $9.1
million a year ago. The decrease resulted principally from lower
sales, an unfavorable change in the values of foreign currencies against the
U.S. dollar, and unusual charges of approximately $1.9 million, which
principally related to severance costs and downsizing initiatives in the
segment’s Sweden operation. The Merchandising Solutions segment
reported an operating loss of $56,000 for fiscal 2009, compared to operating
profit of $4.8 million for fiscal 2008. The decrease principally
reflected lower sales and unusual charges of approximately $1.3 million, which
principally related to employment termination-related expenses and asset
impairments.
Investment
income for the year ended September 30, 2009 was $2.0 million, compared to $1.8
million for the year ended September 30, 2008. The increase reflected
higher average levels of invested funds. Interest expense for fiscal
2009 was $12.1 million, compared to $10.4 million last year. The
increase in interest expense primarily reflected higher average debt levels. The
higher debt level resulted from borrowings related to the Saueressig acquisition
in May 2008.
Other
income (deductions), net, for the year ended September 30, 2009 represented a
reduction in pre-tax income of $12,000, compared to an increase in pre-tax
income of $510,000 in fiscal 2008. Minority interest deduction was
$2.5 million for fiscal 2009, compared to $3.3 million in fiscal
2008. The decrease in the minority interest deduction reflected the
Company’s purchase of the remaining interest in one of its less than
wholly-owned subsidiaries in September 2008, partially offset by improved
profitability at Saueressig.
ITEM
7. MANAGEMENT'S DISCUSSION AND
ANALYSIS, continued
The
Company's effective tax rate for fiscal 2009 was 34.8%, compared to 34.6% for
fiscal 2008. Fiscal 2009 included the favorable impact of adjustments totaling
$1.3 million in income tax expense related to the Company’s ability to utilize a
tax loss carryover in Europe and changes in the estimated tax accruals for open
tax periods. Fiscal 2008 included the favorable impact of a $1.9
million reduction in net deferred tax liabilities to reflect the enactment of
lower statutory income tax rates in certain European
countries. Excluding the one-time adjustments in both periods, the
Company’s effective tax rate was 36.2% for fiscal years 2009 and
2008. The difference between the Company's effective tax rate and the
Federal statutory rate of 35.0% primarily reflected the impact of state and
foreign income taxes.
Comparison
of Fiscal 2008 and Fiscal 2007:
Sales for
the year ended September 30, 2008 were $818.6 million, compared to $749.4
million for the year ended September 30, 2007. The increase principally
reflected the acquisition of a 78% interest in Saueressig in May 2008, higher
sales in the Company’s Memorialization businesses, and the effect of higher
foreign currency values against the U.S. dollar. The increases were
partially offset by the absence of a large one-time Merchandising Solutions
project completed in the second quarter of fiscal 2007 (which exceeded $10.0
million in revenue) and the sale of the segment’s marketing consultancy business
in August 2007. For the year ended September 30, 2008, changes in
foreign currency values against the U.S. dollar had a favorable impact of
approximately $18.0 million on the Company’s consolidated sales compared to the
year ended September 30, 2007.
In the
Memorialization businesses, Bronze segment sales for fiscal 2008 were $243.1
million compared to $229.8 million for fiscal 2007. The increase
primarily reflected higher selling prices and increases in the value of foreign
currencies against the U.S. dollar, partially offset by a decline in the volume
of memorial products. Sales for the Casket segment were $219.8
million for fiscal 2008 compared to $210.7 million for the same period in fiscal
2007. The increase mainly resulted from higher average selling prices
which was partly attributable to the transition to Company-owned distribution in
certain territories. Sales for the Cremation segment were $26.7
million for fiscal 2008 compared to $25.2 million in fiscal 2007. The
increase primarily reflected higher cremation equipment, services and repair
revenues. In the Company’s Brand Solutions businesses, sales for the
Graphics Imaging segment in fiscal 2008 were $203.7 million, compared to $146.0
million in fiscal 2007. The increase was mainly due to the Saueressig
acquisition, a favorable change in the value of foreign currencies against the
U.S. dollar and higher sales in the German markets. The increases
were partially offset by lower sales in the U.K. market. Marking
Products segment sales for the year ended September 30, 2008 were $60.0 million,
compared to $57.5 million for fiscal 2007. The increase primarily
reflected the acquisition of a 60% interest in Beijing Kenuohua Electronic
Technology Co., Ltd. (“Kenuohua”), a Chinese ink-jet equipment manufacturer, in
June 2007 and a favorable change in the value of foreign currencies against the
U.S. dollar. These increases were partially offset by lower product
demand in the domestic market, reflecting a slowdown in the U.S. economy. Sales
for the Merchandising Solutions segment were $65.4 million for fiscal 2008,
compared to $80.2 million in fiscal 2007. The decrease is
attributable to a significant one-time project for one of the segment’s
customers in the second quarter of fiscal 2007, which exceeded $10.0 million in
revenue and did not repeat in fiscal 2008, and the sale of the segment’s
marketing consultancy business in August 2007.
Gross
profit for the year ended September 30, 2008 was $323.0 million, compared to
$280.5 million for fiscal 2007. The increase in consolidated gross
profit primarily reflected the impact of higher sales, the expansion to direct
distribution by the Casket segment, the acquisition of Saueressig and the
effects of cost structure initiatives implemented in fiscal 2007 in several of
the Company’s businesses. These gains were partially offset by the
impact of lower sales in the U.K. graphics market, the domestic Marking Products
business and the Merchandising Solutions segment. Additionally,
fiscal 2007 gross profit was impacted by special charges incurred in several of
the Company’s segments. Consolidated gross profit as a percent of
sales increased from 37.4% for fiscal 2007 to 39.5% for fiscal
2008.
|
ITEM
7.
|
MANAGEMENT'S
DISCUSSION AND ANALYSIS,
continued
|
Selling
and administrative expenses for the year ended September 30, 2008 were $190.0
million, compared to $168.6 million for fiscal 2007. Consolidated
selling and administrative expenses as a percent of sales were 23.2% for the
year ended September 30, 2008, compared to 22.5% in fiscal 2007. The
increases in costs and percentage of sales primarily resulted from the continued
expansion of the Casket segment’s distribution capabilities and the acquisition
of Saueressig. Fiscal 2007 included special charges incurred in
several of the Company’s segments, the most significant of which was the
acceleration of earn-out payments in the resolution of employment agreements
from the fiscal 2005 acquisition of Milso Industries (“Milso”). These
special charges were partially offset by litigation settlements in the Casket
segment.
Operating
profit for fiscal 2008 was $133.0 million, compared to $111.8 million for fiscal
2007. Fiscal 2007 operating profit included unusual items which had a
net unfavorable impact of $8.8 million. The most significant portion
of these items (special charges of approximately $9.4 million) related to the
acceleration of earn-out payments in the resolution of employment agreements
from the Milso acquisition.
The
increase in consolidated operating profit in fiscal 2008 reflected the favorable
impact of higher sales, favorable changes in the values of foreign currencies
against the U.S. dollar and cost improvements in several of the Company’s
segments. Bronze segment operating profit for fiscal 2008 was $71.6
million, compared to $66.3 million for fiscal 2007. The increase
reflected the impact of higher sales and a favorable change in the value of
foreign currencies against the U.S. dollar. Operating profit for the
Casket segment for fiscal 2008 was $23.3 million, compared to $11.8 million for
fiscal 2007. Casket segment operating profit for fiscal 2007
reflected special charges of approximately $10.0 million, including costs
related to the resolution of employment agreements from the Milso acquisition
and charges related to cost reduction initiatives. These charges were
partially offset by favorable litigation settlements ($2.8 million net of legal
costs incurred) in the fiscal 2007 fourth quarter. Excluding
these special charges from fiscal 2007, the Casket segment’s fiscal 2008
operating profit improved compared to fiscal 2007, reflecting higher sales and
the favorable impact of fiscal 2007 cost structure
initiatives. Cremation segment operating profit for the year ended
September 30, 2008 was $5.5 million, compared to $3.6 million in fiscal
2007. The increase was mainly attributable to the impact of higher
cremation equipment, services and repair volume, improved price realization, and
cost control efforts. The Graphics Imaging segment operating profit
for fiscal 2008 was $18.6 million, compared to $14.4 million for
2007. Graphics Imaging segment operating profit for fiscal 2007
reflected special charges (mainly severance costs) of approximately $2.2 million
related to cost reduction initiatives in the segment’s U.S. and U.K.
operations. Excluding these special charges from fiscal 2007, the
Graphics Imaging segment fiscal 2008 operating profit improved compared to
fiscal 2007, reflecting higher sales in the German markets, a favorable change
in foreign currency values against the U.S. dollar and the favorable impact of
the fiscal 2007 cost structure initiatives. Operating profit for the
Marking Products segment for fiscal 2008 was $9.1 million, compared to $9.9
million in fiscal 2007. The decrease resulted principally from lower
domestic sales, offset partially by the acquisition of Kenuohua. The
Merchandising Solutions segment operating profit was $4.8 million for fiscal
2008, compared to $5.7 million for fiscal 2007. Fiscal 2007 operating
profit included a $1.3 million gain on the sale of the segment’s marketing
consultancy business and the benefit of a significant one-time sales project
completed in the second quarter of fiscal 2007. Excluding the gain on
the sale of the consulting business in fiscal 2007, the segment’s fiscal 2008
operating profit improved compared to fiscal 2007, reflecting the benefit of
recent cost structure initiatives. For the year ended September 30,
2008, changes in foreign currency values against the U.S. dollar had a favorable
impact of approximately $3.4 million on the Company’s consolidated operating
profit compared to the year ended September 30, 2007.
Investment
income for the year ended September 30, 2008 was $1.8 million, compared to $2.4
million for the year ended September 30, 2007. The decrease reflected
lower average levels of invested funds and a decline in investment
performance. Interest expense for fiscal 2008 was $10.4 million,
compared to $8.1 million in fiscal 2007. The increase in interest
expense primarily reflected higher average debt levels and higher average
interest rates during fiscal 2008 compared to fiscal 2007. The higher
debt level resulted from borrowings related to the Saueressig acquisition in May
2008.
ITEM
7. MANAGEMENT'S DISCUSSION AND
ANALYSIS, continued
Other
income, net, for year ended September 30, 2008 was $510,000, compared to
$354,000 in fiscal 2007. Minority interest deduction was $3.3 million
for fiscal 2008, compared to $2.7 million in fiscal 2007. The
increase in minority interest deduction reflected the Company’s acquisition of
Kenuohua in June 2007.
The
Company's effective tax rate for fiscal 2008 was 34.6%, compared to 37.6% for
fiscal 2007. Fiscal 2008 included the favorable impact of a $1.9 million
reduction in net deferred tax liabilities to reflect the enactment of lower
statutory income tax rates in certain European countries. Excluding
the one-time adjustment to deferred taxes, the Company’s effective tax rate was
36.2%. The decrease in the effective tax rate in fiscal 2008
primarily reflected lower statutory tax rates in Europe, the impact of the U.S.
Federal manufacturing credit and the closure of several open domestic and
foreign tax years. The difference between the Company's effective tax
rate and the Federal statutory rate of 35.0% primarily reflected the impact of
state and foreign income taxes.
LIQUIDITY AND CAPITAL
RESOURCES:
Net cash
provided by operating activities was $90.9 million for the year ended September
30, 2009, compared to $104.5 million and $74.6 million for fiscal 2008 and 2007,
respectively. Operating cash flow for fiscal 2009 primarily reflected
net income adjusted for depreciation and amortization, stock-based compensation
expense, minority interest expense and an increase in deferred taxes, partially
offset by a cash contribution of $12.0 million to the Company’s principal
pension plan. Operating cash flow for fiscal 2008 primarily reflected
net income adjusted for depreciation and amortization, stock-based compensation
expense, minority interest expense and an increase in deferred taxes, partially
offset by cash contributions of $15.2 million to the Company’s principal pension
plan. Operating cash flow for fiscal 2007 primarily reflected net
income adjusted for depreciation and amortization, stock-based compensation
expense, minority interest expense and an increase in deferred taxes, partially
offset by an increase in working capital.
Cash used
in investing activities was $32.7 million for the year ended September 30,
2009, compared to $108.7 million and $38.7 million for fiscal years 2008 and
2007, respectively. Investing activities for fiscal 2009 primarily reflected
payments (net of cash acquired) of $11.0 million for acquisitions, capital
expenditures of $19.4 million and purchases of investment securities of $2.6
million. Investing activities for fiscal 2008 primarily reflected
payments (net of cash acquired) of $98.1 million for acquisitions (primarily
Saueressig), capital expenditures of $12.1 million, net proceeds from the sale
of investments of $419,000 and proceeds from the sale of assets of $1.0
million. Investing activities for fiscal 2007 primarily reflected
payments (net of cash acquired) of $23.8 million for acquisitions, capital
expenditures of $20.6 million, net purchases of investments of $1.1
million and proceeds of $6.9 million from the sale of assets. See
“Acquisitions” for further discussion of the Company’s
acquisitions.
Capital
expenditures were $19.4 million for the year ended September 30, 2009, compared
to $12.1 million and $20.6 million for fiscal 2008 and 2007,
respectively. Capital expenditures in each of the last three fiscal
years reflected reinvestment in the Company's business segments and were made
primarily for the purchase of new manufacturing machinery, equipment and
facilities designed to improve product quality, increase manufacturing
efficiency, lower production costs and meet regulatory
requirements. Capital expenditures for the last three fiscal years
were primarily financed through operating cash.
Capital
spending for property, plant and equipment has averaged $17.4 million for the
last three fiscal years. The capital budget for fiscal 2010 is $25.8
million. The Company expects to generate sufficient cash from
operations to fund all anticipated capital spending projects.
ITEM
7. MANAGEMENT'S DISCUSSION AND
ANALYSIS, continued
Cash used
in financing activities for the year ended September 30, 2009 was $53.6 million,
reflecting repayments, net of proceeds, on long-term debt of $15.7 million,
purchases of treasury stock of $28.8 million, proceeds from the sale of treasury
stock (stock option exercises) of $1.2 million, payment of dividends to the
Company’s shareholders of $8.2 million ($0.265 per share) and distributions of
$2.3 million to minority interests. Cash provided by financing
activities for the year ended September 30, 2008 was $13.1 million, reflecting
proceeds, net of repayments, from long-term debt of $43.1 million, proceeds from
the sale of treasury stock (stock option exercises) of $19.2 million, a tax
benefit of $3.1 million from exercised stock options, purchases of treasury
stock of $43.3 million, payment of dividends to the Company’s shareholders of
$7.4 million ($0.245 per share) and distributions of $1.6 million to minority
interests. Cash used in financing activities for the year ended
September 30, 2007 was $27.1 million, reflecting treasury stock purchases of
$56.5 million, net proceeds of long-term debt of $17.7 million, proceeds of
$16.5 million from the sale of treasury stock (stock option exercises), a tax
benefit of $3.8 million from exercised stock options, dividends of $7.1 million
($0.225 per share) to the Company’s shareholders and distributions of $1.6
million to minority interests.
The
Company has a domestic Revolving Credit Facility with a syndicate of financial
institutions. The maximum amount of borrowings available under the
facility is $225.0 million and the facility’s maturity is September 2012.
Borrowings under the facility bear interest at LIBOR plus a factor ranging from
..40% to .80% based on the Company’s leverage ratio. The leverage
ratio is defined as net indebtedness divided by EBITDA (earnings before
interest, taxes, depreciation and amortization). The Company is
required to pay an annual commitment fee ranging from .15% to .25% (based on the
Company’s leverage ratio) of the unused portion of the facility. The
Revolving Credit Facility requires the Company to maintain certain leverage and
interest coverage ratios. A portion of the facility (not to exceed
$20.0 million) is available for the issuance of trade and standby letters of
credit. Outstanding borrowings on the Revolving Credit Facility at September 30,
2009 and 2008 were $177.5 million and $172.5 million,
respectively. The weighted-average interest rate on outstanding
borrowings at September 30, 2009 and 2008 was 2.96% and 4.35%,
respectively.
The
Company has entered into the following interest rate swaps:
|
Date
|
Initial
Amount
|
Fixed
Interest Rate
|
Interest
Rate
Spread
at
September
30, 2009
|
Maturity
Date
|
|
September
2007
|
$25
million
|
4.77%
|
.60%
|
September
2012
|
|
May
2008
|
40
million
|
3.72%
|
.60%
|
September
2012
|
|
October
2008
|
20
million
|
3.21%
|
.60%
|
October
2010
|
|
October
2008
|
20
million
|
3.46%
|
.60%
|
October
2011
|
The
interest rate swaps have been designated as cash flow hedges of the future
variable interest payments under the Revolving Credit Facility which are
considered probable of occurring. Based on the Company’s assessment,
all the critical terms of each of the hedges matched the underlying terms of the
hedged debt and related forecasted interest payments, and as such, these hedges
were considered highly effective.
The fair
value of the interest rate swaps reflected an unrealized loss of $5.7 million
($3.5 million after tax) at September 30, 2009 that is included in equity as
part of accumulated other comprehensive loss. Assuming market rates
remain constant with the rates at September 30, 2009, approximately $1.5 million
of the $3.5 million loss included in accumulated other comprehensive loss is
expected to be recognized in earnings as an adjustment to interest expense over
the next twelve months.
The
Company, through certain of its German subsidiaries, has a credit facility with
a European bank. The maximum amount of borrowings available under this facility
is 25.0 million Euros ($36.6 million). Outstanding borrowings under the credit
facility totaled 18.0 million Euros ($26.3 million) and 22.5 million Euros
($31.7 million) at September 30, 2009 and 2008, respectively. The
weighted-average interest rate on outstanding borrowings under the facility at
September 30, 2009 and 2008 was 1.75% and 5.86%, respectively. The facility’s
maturity is September 2012.
ITEM
7. MANAGEMENT'S DISCUSSION AND
ANALYSIS, continued
The
Company, through its German subsidiary, Saueressig, has several loans with
various European banks. Outstanding borrowings on these loans totaled
10.0 million Euros ($14.7 million) and 11.6 million Euros ($16.3 million) at
September 30, 2009 and 2008, respectively. The weighted-average
interest rate on outstanding borrowings of Saueressig at September 30, 2009 and
2008 was 5.89% and 5.79%, respectively.
The
Company, through its wholly-owned subsidiary Matthews International S.p.A., has
several loans with various Italian banks. Outstanding borrowings on
these loans totaled 12.2 million Euros ($18.0 million) and 15.3 million Euros
($21.6 million) at September 30, 2009 and 2008,
respectively. Matthews International S.p.A. also has three lines of
credit totaling 8.4 million Euros ($12.2 million) with the same Italian
banks. Outstanding borrowings on these lines were 2.0 million Euros
($2.9 million) and 2.3 million Euros ($3.3 million) at September 30, 2009 and
2008, respectively. The weighted-average interest rate on outstanding
Matthews International S.p.A. borrowings at September 30, 2009 and 2008 was
3.76% and 3.88%, respectively.
The
Company has a stock repurchase program, which was initiated in
1996. As of September 30, 2009, the Company's Board of Directors had
authorized the repurchase of a total of 12,500,000 shares of Matthews’ common
stock under the program, of which 12,279,922 shares had been repurchased as of
September 30, 2009. The buy-back program is designed to increase
shareholder value, enlarge the Company's holdings of its common stock, and add
to earnings per share. Repurchased shares may be retained in
treasury, utilized for acquisitions, or reissued to employees or other
purchasers, subject to the restrictions of the Company’s Restated Articles of
Incorporation.
Consolidated
working capital was $173.1 million at September 30, 2009, compared to $141.4
million and $143.1 million at September 30, 2008 and 2007,
respectively. Working capital at September 30, 2009 reflected an
increase in cash and investments and a reduction in current maturities of
long-term debt. Working capital at September 30, 2008 reflected the
impact of the Company’s working capital management initiatives, primarily in the
Casket segment, partially offset by the impact of the acquisition of
Saueressig. Working capital at September 30, 2007 reflected higher
levels of inventories resulting primarily from the Casket segment’s expansion of
its distribution capabilities. Cash and cash equivalents were $57.8
million at September 30, 2009, compared to $50.7 million and $44.0 million
at September 30, 2008 and 2007, respectively. The Company's
current ratio at September 30, 2009 was 2.3, compared to 1.9 and 2.2 at
September 30, 2008 and 2007, respectively.
ENVIRONMENTAL
MATTERS:
The
Company's operations are subject to various federal, state and local laws and
regulations relating to the protection of the environment. These laws
and regulations impose limitations on the discharge of materials into the
environment and require the Company to obtain and operate in compliance with
conditions of permits and other government authorizations. As such,
the Company has developed environmental, health, and safety policies and
procedures that include the proper handling, storage and disposal of hazardous
materials.
The
Company is party to various environmental matters. These include
obligations to investigate and mitigate the effects on the environment of the
disposal of certain materials at various operating and non-operating
sites. The Company is currently performing environmental assessments
and remediation at these sites, as appropriate. In addition, prior to
its acquisition, The York Group, Inc. (“York”) was identified, along with
others, by the Environmental Protection Agency as a potentially responsible
party for remediation of a landfill site in York, Pennsylvania. At
this time, the Company has not been joined in any lawsuit or administrative
order related to the site or its clean-up.
At
September 30, 2009, an accrual of approximately $7.3 million had been recorded
for environmental remediation (of which $836,000 was classified in other current
liabilities), representing management's best estimate of the probable and
reasonably estimable costs of the Company's known remediation
obligations. The accrual, which reflects previously established
reserves assumed with the acquisition of York and additional reserves recorded
as a purchase accounting adjustment, does not consider the effects of inflation
and anticipated expenditures are not discounted to their present
value. Changes in the accrued environmental remediation obligation
from the prior fiscal year reflect payments charged against the
accrual.
While
final resolution of these contingencies could result in costs different than
current accruals, management believes the ultimate outcome will not have a
significant effect on the Company's consolidated results of operations or
financial position.
ITEM
7 .MANAGEMENT'S DISCUSSION AND
ANALYSIS, continued
ACQUISITIONS:
Fiscal
2009:
Acquisition
spending, net of cash acquired, during the year ended September 30, 2009 totaled
$11.0 million. The acquisitions were not individually, or in the
aggregate, material to the Company’s consolidated financial position or results
of operations.
Fiscal
2008:
Acquisition
spending, net of cash acquired, during the year ended September 30, 2008 totaled
$98.1 million, and primarily included the following:
In
September 2008, the Company acquired the remaining 20% interest in S+T
Gesellschaft fur Reprotechnik GmbH (“S+T GmbH”). The Company had
acquired a 50% interest in S+T GmbH in 1998 and a 30% interest in
2005.
In May
2008, the Company acquired a 78% interest in Saueressig, a manufacturer of
gravure printing cylinders. Saueressig is headquartered in Vreden, Germany and
has its principal manufacturing operations in Germany, Poland and the United
Kingdom. The transaction was structured as a stock purchase with a
purchase price of approximately 58.1 million Euros ($90.8
million). The cash portion of the transaction was funded principally
through borrowings under the Company’s existing credit facilities. In addition,
the Company entered into an option agreement related to the remaining 22%
interest in Saueressig. The acquisition was designed to expand Matthews’
products and services in the global graphics imaging market.
Fiscal
2007:
Acquisition
spending, net of cash acquired, during the year ended September 30, 2007 totaled
$23.8 million, and primarily included the following:
In July
2007, York reached a settlement agreement with Yorktowne Caskets, Inc. and its
shareholders (collectively “Yorktowne”) with respect to all outstanding
litigation between the parties. In exchange for the mutual release,
the principal terms of the settlement included the assignment by Yorktowne of
certain customer and employment-related contracts to York and the purchase by
York of certain assets, including York-product inventory, of
Yorktowne.
In June
2007, the Company acquired a 60% interest in Kenuohua, an ink-jet equipment
manufacturer, headquartered in Beijing, China. The acquisition was
structured as a stock purchase. The acquisition was intended to
expand Matthews’ marking products manufacturing and distribution capabilities in
Asia.
In
December 2006, the Company paid additional purchase consideration of $7.0
million under the terms of the Milso acquisition
agreement.
DISPOSITION:
In August
2007, the Company sold its marketing consultancy business. The transaction
resulted in a pre-tax gain of $1.3 million, which was recorded as a reduction in
administrative expenses in the Company’s Consolidated Statement of
Income.
FORWARD-LOOKING
INFORMATION:
Matthews
has a three-pronged strategy to attain annual growth in earnings per share. This
strategy,
which has remained unchanged from prior years, consists of the
following: internal growth (which includes productivity improvements,
new product development and the expansion into new markets with existing
products), acquisitions and share repurchases under the Company’s stock
repurchase program (see "Liquidity and Capital Resources"). For the past ten
fiscal years, the Company has achieved an average annual increase in earnings
per share of 11.1%.
ITEM
7. MANAGEMENT'S DISCUSSION AND
ANALYSIS, continued
One of
the significant factors expected to impact fiscal 2010 results is the continued
weakness in the U.S. and global economies, which unfavorably affected sales in
both the Memorialization and Brand Solutions businesses in fiscal
2009. There has also been continued volatility in commodity costs,
such as bronze, steel and fuel. With these challenges, each of the Company’s
segments continues to work to increase productivity.
Based on
current market conditions, the Company expects these economic challenges to
continue, particularly in the next several quarters. Although some of
these markets may be beginning to stabilize, the Company is not yet in a
position to project a definitive trend toward improvement. In
addition, pension costs will increase by approximately $5.1 million in fiscal
2010 as a result of the market’s impact on plan assets and the valuation of the
pension obligation compared to fiscal 2009. On this basis, overall
earnings for fiscal 2010 are currently expected to be at a level relatively
consistent with fiscal 2009 (excluding unusual charges from both years), with
results relative to the comparable interim periods in fiscal 2009 improving as
fiscal 2010 progresses.
CRITICAL
ACCOUNTING POLICIES:
The
preparation of financial statements in conformity with generally accepted
accounting principles requires management to make estimates and assumptions that
affect the reported amounts of assets and liabilities and disclosure of
contingent assets and liabilities at the date of the financial statements and
the reported amounts of revenues and expenses during the reporting
period. Therefore, the determination of estimates requires the
exercise of judgment based on various assumptions and other factors such as
historical experience, economic conditions, and in some cases, actuarial
techniques. Actual results may differ from those
estimates. A discussion of market risks affecting the Company can be
found in Item 7A, "Quantitative and Qualitative Disclosures about Market Risk,"
of this Annual Report on Form 10-K.
The
Company's significant accounting policies are included in the Notes to
Consolidated Financial Statements included in this Annual Report on Form
10-K. Management believes that the application of these policies on a
consistent basis enables the Company to provide useful and reliable financial
information about the Company's operating results and financial
condition. The following accounting policies involve significant
estimates, which were considered critical to the preparation of the Company's
consolidated financial statements for the year ended September 30,
2009.
Allowance
for Doubtful Accounts:
The
allowance for doubtful accounts is based on an evaluation of specific customer
accounts for which available facts and circumstances indicate collectibility may
be uncertain. In addition, the allowance includes a reserve for all
customers based on historical collection experience.
Long-Lived
Assets:
Property,
plant and equipment, goodwill and other intangible assets are carried at
cost. Depreciation on property, plant and equipment is computed
primarily on the straight-line method over the estimated useful lives of the
assets. Property, plant and equipment are reviewed for impairment
whenever events or changes in circumstances indicate that the carrying amount of
such assets may not be recoverable. Recoverability of assets is
determined by evaluating the estimated undiscounted net cash flows of the
operations to which the assets relate. An impairment loss would be
recognized when the carrying amount of the assets exceeds the fair value which
is based on a discounted cash flow analysis.
Goodwill
is not amortized, but is subject to periodic review for
impairment. In general, when the carrying value of a reporting unit
exceeds its implied fair value, an impairment loss must be
recognized. For purposes of testing for impairment, the Company uses
a combination of valuation techniques, including discounted cash
flows. Intangible assets are amortized over their estimated useful
lives, unless such lives are considered to be indefinite. A
significant decline in cash flows generated from these assets may result in a
write-down of the carrying values of the related assets. The Company
performed its annual impairment reviews in the second quarters of fiscal 2009,
2008 and 2007 and determined that no adjustments to the carrying values of
goodwill or other intangibles were necessary at those times.
ITEM
7. MANAGEMENT'S DISCUSSION AND
ANALYSIS, continued
Share-Based
Payment:
Stock-based
compensation cost is measured at grant date, based on the fair value of the
award, and is recognized as expense over the employee requisite service
period.
Pension
and Postretirement Benefits:
Pension
assets and liabilities are determined on an actuarial basis and are affected by
the market value of plan assets, estimates of the expected return on plan assets
and the discount rate used to determine the present value of benefit
obligations. Actual changes
in the
fair market value of plan assets and differences between the actual return on
plan assets, the expected return on plan assets and changes in the selected
discount rate will affect the amount of pension cost.
The
Company's principal pension plan maintains a substantial portion of its assets
in equity securities in accordance with the investment policy established by the
Company’s pension board. Based on an analysis of the historical
performance of the plan's assets and information provided by its independent
investment advisor, the Company set the long-term rate of return assumption for
these assets at 8.5% at September 30, 2009 for purposes of determining pension
cost and funded status. The Company’s discount rate assumption
used in determining the present value of the projected benefit obligation is
based upon published indices as of September 30, 2009 for the fiscal 2009
valuation, and as of its plan year-end (July 31) in fiscal 2008 and
2007. The discount rate was 5.50%, 7.00% and 6.50% in fiscal 2009,
2008 and 2007, respectively.
Environmental:
Environmental
liabilities are recorded when the Company's obligation is probable and
reasonably estimable. Accruals for losses from environmental
remediation obligations do not consider the effects of inflation, and
anticipated expenditures are not discounted to their present value.
Revenue
Recognition:
Revenues
are generally recognized when title and risk of loss pass to the customer, which
is typically at the time of product shipment. For pre-need sales of
memorials and vases, revenue is recognized when the memorial has been
manufactured to the customer’s specifications (e.g., name and birth date), title
has been transferred to the customer and the memorial and vase are placed in
storage for future delivery. A liability has been recorded for the
estimated costs of finishing pre-need bronze memorials and vases that have been
manufactured and placed in storage prior to July 1, 2003 for future
delivery. Beginning July 1, 2003, revenue is deferred by the Company
on the portion of pre-need sales attributable to the final finishing and storage
of the pre-need merchandise. Deferred revenue for final finishing is
recognized at the time the pre-need merchandise is finished and shipped to the
customer. Deferred revenue related to storage is recognized on a
straight-line basis over the estimated average time that pre-need merchandise is
held in storage. At September 30, 2009, the Company held 342,336
memorials and 240,143 vases in its storage facilities under the pre-need sales
program.
Construction
revenues are recognized under the percentage-of-completion method of accounting
using the cost-to-cost method.
The
Company offers rebates to certain customers participating in volume purchase
programs. Rebates are estimated and recorded as a reduction in sales
at the time the Company’s products are sold.
ITEM
7. MANAGEMENT'S
DISCUSSION AND ANALYSIS, continued
LONG-TERM
CONTRACTUAL OBLIGATIONS AND COMMITMENTS:
The
following table summarizes the Company’s contractual obligations at September
30, 2009, and the effect such obligations are expected to have on its liquidity
and cash flows in future periods.
|
|
|
Payments due in fiscal
year:
|
|
|
|
|
|
|
|
|
|
|
|
|
|
|
|
|
After
|
|
|
|
|
Total
|
|
|
2010
|
|
|
2011
to 2012
|
|
|
2013
to 2014
|
|
|
2014
|
|
|
Contractual Cash
Obligations:
|
|
(Dollar
amounts in thousands)
|
|
|
Revolving
credit facilities
|
|
$ |
203,841 |
|
|
$ |
- |
|
|
$ |
203,841 |
|
|
$ |
- |
|
|
$ |
- |
|
|
Notes
payable to banks
|
|
|
36,544 |
|
|
|
6,820 |
|
|
|
14,723 |
|
|
|
13,183 |
|
|
|
1,818 |
|
|
Short-term
borrowings
|
|
|
2,855 |
|
|
|
2,855 |
|
|
|
- |
|
|
|
- |
|
|
|
- |
|
|
Capital
lease obligations
|
|
|
7,706 |
|
|
|
3,434 |
|
|
|
3,861 |
|
|
|
411 |
|
|
|
- |
|
|
Non-cancelable
operating leases
|
|
|
21,466 |
|
|
|
8,070 |
|
|
|
9,783 |
|
|
|
3,017 |
|
|
|
596 |
|
|
Other
|
|
|
1,391 |
|
|
|
1,391 |
|
|
|
- |
|
|
|
- |
|
|
|
- |
|
|
Total
contractual cash obligations
|
|
$ |
273,803 |
|
|
$ |
22,570 |
|
|
$ |
232,208 |
|
|
$ |
16,611 |
|
|
$ |
2,414 |
|
A
significant portion of the loans included in the table above bear interest at
variable rates. At September 30, 2009, the weighted-average interest rate was
2.96% on the Company’s domestic Revolving Credit Facility, 1.75% on the credit
facility through the Company’s wholly-owned German subsidiaries, 3.76% on bank
loans to the Company’s wholly-owned subsidiary, Matthews International S.p.A.,
and 5.89% on bank loans to its majority-owned subsidiary,
Saueressig.
Benefit
payments under the Company’s principal retirement plan are made from plan
assets, while benefit payments under the supplemental retirement plan and
postretirement benefit plan are funded from the Company’s operating cash. Under
IRS regulations, the Company was not required to make any significant
contributions to its principal retirement plan in fiscal 2009, however, in
fiscal 2009, the Company made a contribution of $12.0 million to its principal
retirement plan. The Company is not required to make any significant cash
contributions to its principal retirement plan in fiscal 2010. The
Company estimates that benefit payments to participants under its retirement
plans (including its supplemental retirement plan) and postretirement benefit
payments will be approximately $5.3 million and $1.1 million, respectively, in
fiscal 2010. The amounts are expected to increase incrementally each
year thereafter, to $6.6 million and $1.5 in 2014. The Company
believes that its current liquidity sources, combined with its operating cash
flow and borrowing capacity, will be sufficient to meet its capital needs for
the foreseeable future.
In
connection with its acquisition of a 78% interest in Saueressig, the Company
entered into an option agreement related to the remaining 22%
interest. The option agreement contains certain put and call
provisions for the purchase of the remaining 22% interest in future years at a
price to be determined by a specified formula based on future operating results
of Saueressig. The Company has recorded an estimate of $27.1 million
in “Minority interest and minority interest arrangement” on the September 30,
2009 Consolidated Balance Sheet representing the current estimate of the future
purchase price. The timing of the exercise of the put and call
provisions is not presently determinable.
Unrecognized
tax benefits are positions taken, or expected to be taken, on an income tax
return that may result in additional payments to tax authorities. If
a tax authority agrees with the tax position taken, or expected to be taken, or
the applicable statute of limitations expires, then additional payments will not
be necessary. As of September 30, 2009, the Company had unrecognized
tax benefits, excluding penalties and interest, of approximately $3.6
million. The timing of potential future payments related to the
unrecognized tax benefits is not presently determinable.
INFLATION:
Except
for the volatility in the cost of bronze ingot steel and fuel (see “Results of
Operations”), inflation has not had a material impact on the Company over the
past three years nor is it anticipated to have a material impact for the
foreseeable future.
|
ITEM
7.
|
MANAGEMENT'S
DISCUSSION AND ANALYSIS,
continued
|
ACCOUNTING
PRONOUNCEMENTS:
On
September 30, 2009, the Company adopted changes issued by the Financial
Accounting Standards Board (“FASB”) to the authoritative hierarchy of generally
accepted accounting principles (“GAAP”). These changes establish the
FASB Accounting Standards CodificationTM
(“Codification”) as the source of authoritative accounting principles recognized
by the FASB to be used in the preparation of financial statements of
nongovernmental entities that are presented in conformity with GAAP in the
U.S. The Codification is effective for financial statements issued
for interim and annual periods ending after September 15, 2009. The
adoption had no material impact on the Company’s consolidated results of
operations or financial condition.
The
Company adopted changes issued by the FASB regarding accounting for income tax
benefits of dividends on share-based payment awards on October 1,
2008. The changes require that tax benefits generated by dividends on
equity classified non-vested equity shares, non-vested equity share units, and
outstanding equity share options be classified as additional paid-in capital and
included in a pool of excess tax benefits available to absorb tax deficiencies
from share-based payment awards. The adoption had no material impact
on the Company’s consolidated results of operations or financial
condition.
In
December 2007, the FASB issued new guidance regarding business
combinations. This guidance requires recognition and measurement of
the identifiable assets acquired, the liabilities assumed, and any
noncontrolling interest in a business combination, goodwill acquired or a gain
from a bargain purchase. It is effective for fiscal years beginning
on or after December 15, 2008 and is to be applied
prospectively. Earlier adoption is not permitted. The
Company is currently evaluating the impact of the adoption of this
guidance.
In
December 2007, the FASB issued new guidance regarding noncontrolling interests
in consolidated financial statements. This guidance establishes
accounting and reporting standards for the noncontrolling interest in a
subsidiary. It requires that consolidated net income reflect the amounts
attributable to both the parent and the noncontrolling interest, and also
includes additional disclosure requirements. It is effective for fiscal years
beginning on or after December 15, 2008 and is to be applied prospectively as of
the beginning of the fiscal year in which the guidance is initially applied,
except for the presentation and disclosure requirements which shall be applied
retrospectively for all periods presented. Earlier adoption is not
permitted. The Company is currently evaluating the impact of the
adoption of this guidance.
In
December 2008, the FASB issued changes to employers’ disclosures about
postretirement benefit plan assets. These changes require enhanced disclosures
regarding assets in defined benefit pension or other postretirement
plans. It is effective for fiscal years ending after December 31,
2009. Earlier application is permitted. The Company is currently
evaluating the impact of the adoption of these changes.
In April
2009, the FASB issued changes to require disclosures about fair value of
financial instruments for interim reporting periods of publicly traded companies
as well as in annual financial statements. It also requires those disclosures in
summarized financial information at interim reporting periods. These changes are
effective for interim reporting periods ending after June 15, 2009 and were
adopted by the Company as of June 30, 2009. See Notes 3 and 7 to the
Consolidated Financial Statements included in Item 8 of this Annual Report on
Form 10-K.
Effective
September 30, 2007, the Company adopted the recognition and related disclosure
provisions of guidance on employers’ accounting for defined benefit pension and
other postretirement plans which amended earlier guidance. In the
first quarter of fiscal 2009, the Company adopted the provision requiring the
Company to measure the plan assets and benefit obligations of defined benefit
postretirement plans as of the date of its year-end balance
sheet. Adoption of this provision did not have a material effect on
the Company’s consolidated results of operations or financial condition. See
Note 11 to the Consolidated Financial Statements included in Item 8 of this
Annual Report on Form 10-K.
ITEM
7. MANAGEMENT'S DISCUSSION AND
ANALYSIS, continued
In May
2009, the FASB issued new guidance regarding subsequent events. The
guidance establishes general standards of accounting for and disclosure of
events that occur after the balance sheet date but before financial statements
are issued or are available to be issued. The Statement is effective
for interim or annual financial periods ending after June 15,
2009. Accordingly, the Company adopted these changes as of June 30,
2009. The adoption had no material impact on the Company’s
consolidated results of operations or financial condition. See Note
21 to the Consolidated Financial Statements included in Item 8 of this Annual
Report on Form 10-K.
In June
2008, the FASB issued guidance regarding instruments granted in share-based
payments. The guidance requires unvested share-based payment awards
that contain non-forfeitable rights to dividends or dividend equivalents
(whether paid or unpaid) to be considered participating securities and therefore
included in the computation of earnings per share pursuant to the two-class
method. This guidance is effective for years beginning after December
31, 2008. The Company is currently evaluating the impact of the
adoption of these changes.
ITEM
7A. QUANTITATIVE AND QUALITATIVE DISCLOSURES ABOUT MARKET
RISK.
The
following discussion about the Company's market risk involves forward-looking
statements. Actual results could differ materially from those
projected in the forward-looking statements. The Company has market
risk related to changes in interest rates, commodity prices and foreign currency
exchange rates. The Company does not generally use derivative
financial instruments in connection with these market risks, except as noted
below.
Interest Rates - The Company’s
most significant long-term debt instrument is the domestic Revolving Credit
Facility, which bears interest at variable rates based on LIBOR.
The
Company has entered into the following interest rate swaps:
|
Date
|
Initial
Amount
|
Fixed
Interest Rate
|
Interest
Rate
Spread
at
September
30, 2009
|
Maturity
Date
|
|
September
2007
|
$25
million
|
4.77%
|
.60%
|
September
2012
|
|
May
2008
|
40
million
|
3.72%
|
.60%
|
September
2012
|
|
October
2008
|
20
million
|
3.21%
|
.60%
|
October
2010
|
|
October
2008
|
20
million
|
3.46%
|
.60%
|
October
2011
|
The
interest rate swaps have been designated as cash flow hedges of the future
variable interest payments under the Revolving Credit Facility which are
considered probable of occurring. Based on the Company’s assessment,
all the critical terms of each of the hedges matched the underlying terms of the
hedged debt and related forecasted interest payments, and as such, these hedges
were considered highly effective.
The fair
value of the interest rate swaps reflected an unrealized loss of $5.7 million
($3.5 million after tax) at September 30, 2009 that is included in equity as
part of accumulated other comprehensive loss. A decrease of 10% in
market interest rates (e.g. a decrease from 5.0% to 4.5%) would result in an
increase of approximately $610,000 in the fair value liability of the interest
rate swaps.
Commodity Price Risks - In the
normal course of business, the Company is exposed to commodity price
fluctuations related to the purchases of certain materials and supplies (such as
bronze ingot, steel, fuel and wood) used in its manufacturing operations. The
Company obtains competitive prices for materials and supplies when
available.
Foreign Currency Exchange
Rates - The Company is subject to changes in various foreign currency
exchange rates, primarily including the Euro, British Pound, Canadian Dollar,
Australian Dollar, Swedish Krona, Chinese Yuan, Hong Kong Dollar and Polish
Zloty in the conversion from local currencies to the U.S. dollar of the reported
financial position and operating results of its non-U.S. based
subsidiaries. An adverse change (strengthening dollar) of 10% in
exchange rates would have resulted in a decrease in sales of $28.5 million and a
decrease in operating income of $3.3 million for the year ended September 30,
2009.
|
|
ITEM
8. FINANCIAL STATEMENTS AND SUPPLEMENTARY
DATA.
|
|
Description
|
|
Pages
|
|
|
|
|
|
Management’s
Report to Shareholders
|
|
34
|
|
|
|
|
|
Report
of Independent Registered Public Accounting Firm
|
|
35
|
|
|
|
|
|
Financial
Statements:
|
|
|
|
|
|
|
|
Consolidated
Balance Sheets as of September 30, 2009 and 2008
|
|
36-37
|
|
|
|
|
|
Consolidated
Statements of Income for the years ended September 30, 2009, 2008 and
2007
|
|
38
|
|
|
|
|
|
Consolidated
Statements of Shareholders' Equity for the years ended September 30, 2009,
2008 and 2007
|
|
39
|
|
|
|
|
|
Consolidated
Statements of Cash Flows for the years ended September 30, 2009, 2008 and
2007
|
|
40
|
|
|
|
|
|
Notes
to Consolidated Financial Statements
|
|
41-65
|
|
|
|
|
|
Supplementary
Financial Information (unaudited)
|
|
66
|
|
|
|
|
|
Financial
Statement Schedule – Schedule II-Valuation and Qualifying
|
|
|
|
Accounts
for the years ended September 30, 2009, 2008 and 2007
|
|
67
|
MANAGEMENT’S
REPORT TO SHAREHOLDERS
To the
Shareholders and Board of Directors of
Matthews
International Corporation:
Management’s
Report on Financial Statements
The
accompanying consolidated financial statements of Matthews International
Corporation and its subsidiaries (collectively, the “Company”) were prepared by
management, which is responsible for their integrity and objectivity. The
statements were prepared in accordance with generally accepted accounting
principles and include amounts that are based on management’s best judgments and
estimates. The other financial information included in this Annual Report on
Form 10-K is consistent with that in the financial statements.
Management’s
Report on Internal Control over Financial Reporting
Management
is responsible for establishing and maintaining adequate internal control over
financial reporting for the Company. In order to evaluate the effectiveness of
internal control over financial reporting management has conducted an assessment
using the criteria in Internal
Control – Integrated Framework, issued by the Committee of Sponsoring
Organizations of the Treadway Commission (“COSO”). The Company’s internal
controls over financial reporting include those policies and procedures that
(i) pertain to the maintenance of records that, in reasonable detail,
accurately and fairly reflect the transactions and dispositions of the assets of
the Company; (ii) provide reasonable assurance that transactions are
recorded as necessary to permit preparation of financial statements in
accordance with generally accepted accounting principles, and that receipts and
expenditures of the Company are being made only in accordance with
authorizations of management and directors of the Company; and
(iii) provide reasonable assurance regarding prevention or timely detection
of unauthorized acquisition, use, or disposition of the Company’s assets that
could have a material effect on the financial statements. Because of
its inherent limitations, internal control over financial reporting may not
prevent or detect misstatements. Also, projections of any evaluation of
effectiveness to future periods are subject to the risk that controls may become
inadequate because of changes in conditions, or that the degree of compliance
with the policies or procedures may deteriorate.
Based on
its assessment, management has concluded that the Company maintained effective
internal control over financial reporting as of September 30, 2009, based on
criteria in Internal Control –
Integrated Framework issued by the COSO. The effectiveness of the
Company’s internal control over financial reporting as of September 30, 2009 has
been audited by PricewaterhouseCoopers LLP, an independent registered public
accounting firm, as stated in their report which is included
herein.
Management’s
Certifications
The
certifications of the Company’s Chief Executive Officer and Chief Financial
Officer required by the Sarbanes-Oxley Act have been included as Exhibits 31 and
32 in the Company’s Form 10-K.
Report
of Independent Registered Public Accounting Firm
To the
Shareholders and Board of Directors of
Matthews
International Corporation:
In our
opinion, the consolidated financial statements listed in the accompanying index
present fairly, in all material respects, the financial position of Matthews
International Corporation and its subsidiaries at September 30, 2009 and 2008,
and the results of their operations and their cash flows for each of the three
years in the period ended September 30, 2009 in conformity with accounting
principles generally accepted in the United States of America. In
addition, in our opinion, the financial statement schedule listed in the
accompanying index presents
fairly, in all material respects, the information set forth therein when read in
conjunction with the related consolidated financial statements. Also
in our opinion, the Company maintained, in all material respects, effective
internal control over financial reporting as of September 30, 2009, based on
criteria established in Internal Control - Integrated
Framework issued by the Committee of Sponsoring Organizations of the
Treadway Commission (COSO). The Company's management is responsible
for these financial statements and financial statement schedule, for maintaining
effective internal control over financial reporting and for its assessment of
the effectiveness of internal control over financial reporting, included in
Management's Report on Internal Control over Financial Reporting appearing under
Item 8. Our responsibility is to express opinions on these financial
statements, on the financial statement schedule, and on the Company's internal
control over financial reporting based on our integrated audits. We conducted
our audits in accordance with the standards of the Public Company Accounting
Oversight Board (United States). Those standards require that we plan
and perform the audits to obtain reasonable assurance about whether the
financial statements are free of material misstatement and whether effective
internal control over financial reporting was maintained in all material
respects. Our audits of the financial statements included examining,
on a test basis, evidence supporting the amounts and disclosures in the
financial statements, assessing the accounting principles used and significant
estimates made by management, and evaluating the overall financial statement
presentation. Our audit of internal control over financial reporting
included obtaining an understanding of internal control over financial
reporting, assessing the risk that a material weakness exists, and testing and
evaluating the design and operating effectiveness of internal control based on
the assessed risk. Our audits also included performing such other
procedures as we considered necessary in the circumstances. We believe that our
audits provide a reasonable basis for our opinions.
As
discussed in Note 11 to the consolidated financial statements, the Company
changed the manner in which it accounts for defined benefit pension and other
postretirement benefit plans in 2007.
A
company’s internal control over financial reporting is a process designed to
provide reasonable assurance regarding the reliability of financial reporting
and the preparation of financial statements for external purposes in accordance
with generally accepted accounting principles. A company’s internal
control over financial reporting includes those policies and procedures that
(i) pertain to the maintenance of records that, in reasonable detail,
accurately and fairly reflect the transactions and dispositions of the assets of
the company; (ii) provide reasonable assurance that transactions are
recorded as necessary to permit preparation of financial statements in
accordance with generally accepted accounting principles, and that receipts and
expenditures of the company are being made only in accordance with
authorizations of management and directors of the company; and
(iii) provide reasonable assurance regarding prevention or timely detection
of unauthorized acquisition, use, or disposition of the company’s assets that
could have a material effect on the financial statements.
Because
of its inherent limitations, internal control over financial reporting may not
prevent or detect misstatements. Also, projections of any evaluation
of effectiveness to future periods are subject to the risk that controls may
become inadequate because of changes in conditions, or that the degree of
compliance with the policies or procedures may deteriorate.
/s/PricewaterhouseCoopers
LLP
Pittsburgh,
Pennsylvania
November
23, 2009
MATTHEWS
INTERNATIONAL CORPORATION AND SUBSIDIARIES
CONSOLIDATED
BALANCE SHEETS
September
30, 2009 and 2008
(Dollar
amounts in thousands, except per share data)
__________
|
ASSETS
|
|
2009
|
|
|
2008
|
|
|
Current
assets:
|
|
|
|
|
|
|
|
Cash
and cash equivalents
|
|
$ |
57,732 |
|
|
$ |
50,667 |
|
|
Short-term
investments
|
|
|
62 |
|
|
|
62 |
|
|
Accounts
receivable, net of allowance for doubtful
accounts
of $12,630 and $11,538, respectively
|
|
|
138,927 |
|
|
|
145,288 |
|
|
Inventories
|
|
|
94,455 |
|
|
|
96,388 |
|
|
Deferred
income taxes
|
|
|
1,816 |
|
|
|
1,271 |
|
|
Other
current assets
|
|
|
12,430 |
|
|
|
9,439 |
|
|
Total
current assets
|
|
|
305,422 |
|
|
|
303,115 |
|
|
|
|
|
|
|
|
|
|
|
|
Investments
|
|
|
13,389 |
|
|
|
10,410 |
|
|
|
|
|
|
|
|
|
|
|
|
Property,
plant and equipment, net
|
|
|
138,060 |
|
|
|
145,738 |
|
|
|
|
|
|
|
|
|
|
|
|
Deferred
income taxes
|
|
|
32,563 |
|
|
|
17,714 |
|
|
|
|
|
|
|
|
|
|
|
|
Other
assets
|
|
|
19,999 |
|
|
|
17,754 |
|
|
|
|
|
|
|
|
|
|
|
|
Goodwill
|
|
|
385,219 |
|
|
|
359,641 |
|
|
|
|
|
|
|
|
|
|
|
|
Other
intangible assets, net
|
|
|
55,001 |
|
|
|
59,910 |
|
|
|
|
|
|
|
|
|
|
|
|
Total
assets
|
|
$ |
949,653 |
|
|
$ |
914,282 |
|
The
accompanying notes are an integral part of these consolidated financial
statements.
MATTHEWS
INTERNATIONAL CORPORATION AND SUBSIDIARIES
CONSOLIDATED
BALANCE SHEETS, continued
September
30, 2009 and 2008
(Dollar
amounts in thousands, except per share data)
__________
|
LIABILITIES
AND SHAREHOLDERS' EQUITY
|
|
2009
|
|
|
2008
|
|
|
Current
liabilities:
|
|
|
|
|
|
|
|
Long-term
debt, current maturities
|
|
$ |
14,188 |
|
|
$ |
35,144 |
|
|
Trade
accounts payable
|
|
|
28,604 |
|
|
|
26,647 |
|
|
Accrued
compensation
|
|
|
35,592 |
|
|
|
40,188 |
|
|
Accrued
income taxes
|
|
|
8,120 |
|
|
|
12,075 |
|
|
Other
current liabilities
|
|
|
45,836 |
|
|
|
47,656 |
|
|
Total
current liabilities
|
|
|
132,340 |
|
|
|
161,710 |
|
|
|
|
|
|
|
|
|
|
|
|
Long-term
debt
|
|
|
237,530 |
|
|
|
219,124 |
|
|
|
|
|
|
|
|
|
|
|
|
Accrued
pension
|
|
|
53,734 |
|
|
|
17,208 |
|
|
|
|
|
|
|
|
|
|
|
|
Postretirement
benefits
|
|
|
24,599 |
|
|
|
20,918 |
|
|
|
|
|
|
|
|
|
|
|
|
Deferred
income taxes
|
|
|
13,464 |
|
|
|
10,594 |
|
|
|
|
|
|
|
|
|
|
|
|
Environmental
reserve
|
|
|
6,482 |
|
|
|
7,382 |
|
|
|
|
|
|
|
|
|
|
|
|
Other
liabilities and deferred revenue
|
|
|
15,489 |
|
|
|
12,500 |
|
|
Total
liabilities
|
|
|
483,638 |
|
|
|
449,436 |
|
|
|
|
|
|
|
|
|
|
|
|
Minority
interest and minority interest arrangement
|
|
|
31,797 |
|
|
|
30,891 |
|
|
|
|
|
|
|
|
|
|
|
|
Commitments
and contingent liabilities
|
|
|
|
|
|
|
|
|
|
|
|
|
|
|
|
|
|
|
|
Shareholders'
equity:
|
|
|
|
|
|
|
|
|
|
Class
A common stock, $1.00 par value; authorized
70,000,000
shares; 36,333,992 shares issued
|
|
|
36,334 |
|
|
|
36,334 |
|
|
Preferred
stock, $100 par value, authorized 10,000 shares, none
issued
|
|
|
- |
|
|
|
- |
|
|
Additional
paid-in capital
|
|
|
47,436 |
|
|
|
47,250 |
|
|
Retained
earnings
|
|
|
559,786 |
|
|
|
511,130 |
|
|
Accumulated
other comprehensive loss
|
|
|
(29,884 |
) |
|
|
(2,979 |
) |
|
Treasury
stock, 6,031,674 and 5,474,514 shares, respectively, at
cost
|
|
|
(179,454 |
) |
|
|
(157,780 |
) |
|
Total
shareholders' equity
|
|
|
434,218 |
|
|
|
433,955 |
|
|
|
|
|
|
|
|
|
|
|
|
Total
liabilities and shareholders' equity
|
|
$ |
949,653 |
|
|
$ |
914,282 |
|
The
accompanying notes are an integral part of these consolidated financial
statements.
MATTHEWS
INTERNATIONAL CORPORATION AND SUBSIDIARIES
CONSOLIDATED
STATEMENTS OF INCOME
for
the years ended September 30, 2009, 2008 and 2007
(Dollar
amounts in thousands, except per share data)
__________
|
|
|
2009
|
|
|
2008
|
|
|
2007
|
|
|
Sales
|
|
$ |
780,908 |
|
|
$ |
818,623 |
|
|
$ |
749,352 |
|
|
Cost
of sales
|
|
|
(486,131 |
) |
|
|
(495,659 |
) |
|
|
(468,895 |
) |
|
|
|
|
|
|
|
|
|
|
|
|
|
|
|
Gross
profit
|
|
|
294,777 |
|
|
|
322,964 |
|
|
|
280,457 |
|
|
|
|
|
|
|
|
|
|
|
|
|
|
|
|
Selling
expense
|
|
|
(83,576 |
) |
|
|
(82,677 |
) |
|
|
(71,623 |
) |
|
Administrative
expense
|
|
|
(110,190 |
) |
|
|
(107,335 |
) |
|
|
(97,010 |
) |
|
|
|
|
|
|
|
|
|
|
|
|
|
|
|
Operating
profit
|
|
|
101,011 |
|
|
|
132,952 |
|
|
|
111,824 |
|
|
|
|
|
|
|
|
|
|
|
|
|
|
|
|
Investment
income
|
|
|
2,048 |
|
|
|
1,808 |
|
|
|
2,390 |
|
|
Interest
expense
|
|
|
(12,053 |
) |
|
|
(10,405 |
) |
|
|
(8,119 |
) |
|
Other
income (deductions), net
|
|
|
(12 |
) |
|
|
510 |
|
|
|
354 |
|
|
Minority
interest
|
|
|
(2,451 |
) |
|
|
(3,293 |
) |
|
|
(2,733 |
) |
|
|
|
|
|
|
|
|
|
|
|
|
|
|
|
Income
before income taxes
|
|
|
88,543 |
|
|
|
121,572 |
|
|
|
103,716 |
|
|
|
|
|
|
|
|
|
|
|
|
|
|
|
|
Income
taxes
|
|
|
(30,811 |
) |
|
|
(42,088 |
) |
|
|
(38,990 |
) |
|
|
|
|
|
|
|
|
|
|
|
|
|
|
|
Net
income
|
|
$ |
57,732 |
|
|
$ |
79,484 |
|
|
$ |
64,726 |
|
|
|
|
|
|
|
|
|
|
|
|
|
|
|
|
|
|
|
|
|
|
|
|
|
|
|
|
|
|
Earnings
per share:
|
|
|
|
|
|
|
|
|
|
|
|
|
|
Basic
|
|
|
$1.91 |
|
|
|
$2.57 |
|
|
|
$2.05 |
|
|
|
|
|
|
|
|
|
|
|
|
|
|
|
|
Diluted
|
|
|
$1.90 |
|
|
|
$2.55 |
|
|
|
$2.04 |
|
The
accompanying notes are an integral part of these consolidated financial
statements.
MATTHEWS
INTERNATIONAL CORPORATION AND SUBSIDIARIES
CONSOLIDATED
STATEMENTS OF SHAREHOLDERS' EQUITY
for
the years ended September 30, 2009, 2008 and 2007
(Dollar
amounts in thousands, except per share data)
__________
|
|
|
|
|
|
|
|
|
|
|
|
Accumulated
|
|
|
|
|
|
|
|
|
|
|
|
|
|
|
|
|
|
|
|
Other
|
|
|
|
|
|
|
|
|
|
|
|
|
|
Additional
|
|
|
|
|
|
Comprehensive
|
|
|
|
|
|
|
|
|
|
|
Common
|
|
|
Paid-in
|
|
|
Retained
|
|
|
Income
(Loss)
|
|
|
Treasury
|
|
|
|
|
|
|
|
Stock
|
|
|
Capital
|
|
|
Earnings
|
|
|
(net
of tax)
|
|
|
Stock
|
|
|
Total
|
|
|
Balance,
September 30, 2006
|
|
$ |
36,334 |
|
|
$ |
33,953 |
|
|
$ |
410,203 |
|
|
$ |
4,386 |
|
|
$ |
(92,451 |
) |
|
$ |
392,425 |
|
|
Net
income
|
|
|
- |
|
|
|
- |
|
|
|
64,726 |
|
|
|
- |
|
|
|
- |
|
|
|
64,726 |
|
|
Minimum
pension liability
|
|
|
- |
|
|
|
- |
|
|
|
- |
|
|
|
2,191 |
|
|
|
- |
|
|
|
2,191 |
|
|
Translation
adjustment
|
|
|
- |
|
|
|
- |
|
|
|
- |
|
|
|
16,546 |
|
|
|
- |
|
|
|
16,546 |
|
|
Fair
value of derivatives
|
|
|
- |
|
|
|
- |
|
|
|
- |
|
|
|
(740 |
) |
|
|
- |
|
|
|
(740 |
) |
|
Total
comprehensive income
|
|
|
|
|
|
|
|
|
|
|
|
|
|
|
|
|
|
|
|
|
|
|
82,723 |
|
|
Initial
adoption of pension accounting
|
|
|
- |
|
|
|
- |
|
|
|
- |
|
|
|
(8,993 |
) |
|
|
- |
|
|
|
(8,993 |
) |
|
Stock-based
compensation
|
|
|
- |
|
|
|
3,509 |
|
|
|
- |
|
|
|
- |
|
|
|
- |
|
|
|
3,509 |
|
|
Treasury
stock transactions:
|
|
|
|
|
|
|
|
|
|
|
|
|
|
|
|
|
|
|
|
|
|
|
|
|
|
Purchase
of 1,366,297 shares
|
|
|
- |
|
|
|
- |
|
|
|
- |
|
|
|
- |
|
|
|
(56,526 |
) |
|
|
(56,526 |
) |
|
Issuance
of 789,164 shares under stock plans
|
|
|
- |
|
|
|
4,108 |
|
|
|
- |
|
|
|
- |
|
|
|
16,615 |
|
|
|
20,723 |
|
|
Dividends,
$.225 per share
|
|
|
- |
|
|
|
- |
|
|
|
(7,083 |
) |
|
|
- |
|
|
|
- |
|
|
|
(7,083 |
) |
|
Balance,
September 30, 2007
|
|
|
36,334 |
|
|
|
41,570 |
|
|
|
467,846 |
|
|
|
13,390 |
|
|
|
(132,362 |
) |
|
|
426,778 |
|
|
Net
income
|
|
|
- |
|
|
|
- |
|
|
|
79,484 |
|
|
|
- |
|
|
|
- |
|
|
|
79,484 |
|
|
Minimum
pension liability
|
|
|
- |
|
|
|
- |
|
|
|
- |
|
|
|
(3,049 |
) |
|
|
- |
|
|
|
(3,049 |
) |
|
Translation
adjustment
|
|
|
- |
|
|
|
- |
|
|
|
- |
|
|
|
(12,323 |
) |
|
|
- |
|
|
|
(12,323 |
) |
|
Fair
value of derivatives
|
|
|
- |
|
|
|
- |
|
|
|
- |
|
|
|
(997 |
) |
|
|
- |
|
|
|
(997 |
) |
|
Total
comprehensive income
|
|
|
|
|
|
|
|
|
|
|
|
|
|
|
|
|
|
|
|
|
|
|
63,115 |
|
|
Stock-based
compensation
|
|
|
- |
|
|
|
4,899 |
|
|
|
- |
|
|
|
- |
|
|
|
- |
|
|
|
4,899 |
|
|
Treasury
stock transactions:
|
|
|
|
|
|
|
|
|
|
|
|
|
|
|
|
|
|
|
|
|
|
|
|
|
|
Purchase
of 981,563 shares
|
|
|
- |
|
|
|
- |
|
|
|
- |
|
|
|
- |
|
|
|
(46,189 |
) |
|
|
(46,189 |
) |
|
Issuance
of 649,654 shares under stock plans
|
|
|
- |
|
|
|
781 |
|
|
|
- |
|
|
|
- |
|
|
|
20,771 |
|
|
|
21,552 |
|
|
Dividends,
$.245 per share
|
|
|
- |
|
|
|
- |
|
|
|
(7,437 |
) |
|
|
- |
|
|
|
- |
|
|
|
(7,437 |
) |
|
Minority
interest agreement
|
|
|
- |
|
|
|
- |
|
|
|
(28,763 |
) |
|
|
- |
|
|
|
- |
|
|
|
(28,763 |
) |
|
Balance,
September 30, 2008
|
|
|
36,334 |
|
|
|
47,250 |
|
|
|
511,130 |
|
|
|
(2,979 |
) |
|
|
(157,780 |
) |
|
|
433,955 |
|
|
Net
income
|
|
|
- |
|
|
|
- |
|
|
|
57,732 |
|
|
|
- |
|
|
|
- |
|
|
|
57,732 |
|
|
Minimum
pension liability
|
|
|
- |
|
|
|
- |
|
|
|
(702 |
) |
|
|
(28,430 |
) |
|
|
- |
|
|
|
(29,132 |
) |
|
Translation
adjustment
|
|
|
- |
|
|
|
- |
|
|
|
- |
|
|
|
4,189 |
|
|
|
- |
|
|
|
4,189 |
|
|
Fair
value of derivatives
|
|
|
- |
|
|
|
- |
|
|
|
- |
|
|
|
(2,664 |
) |
|
|
- |
|
|
|
(2,664 |
) |
|
Total
comprehensive income
|
|
|
|
|
|
|
|
|
|
|
|
|
|
|
|
|
|
|
|
|
|
|
30,125 |
|
|
Stock-based
compensation
|
|
|
- |
|
|
|
5,822 |
|
|
|
- |
|
|
|
- |
|
|
|
- |
|
|
|
5,822 |
|
|
Treasury
stock transactions:
|
|
|
|
|
|
|
|
|
|
|
|
|
|
|
|
|
|
|
|
|
|
|
|
|
|
Purchase
of 796,916 shares
|
|
|
- |
|
|
|
- |
|
|
|
- |
|
|
|
- |
|
|
|
(28,813 |
) |
|
|
(28,813 |
) |
|
Issuance
of 241,016 shares under stock plans
|
|
|
- |
|
|
|
(5,636 |
) |
|
|
- |
|
|
|
- |
|
|
|
7,139 |
|
|
|
1,503 |
|
|
Dividends,
$.265 per share
|
|
|
- |
|
|
|
- |
|
|
|
(8,199 |
) |
|
|
- |
|
|
|
- |
|
|
|
(8,199 |
) |
|
Minority
interest agreement
|
|
|
- |
|
|
|
- |
|
|
|
(175 |
) |
|
|
- |
|
|
|
- |
|
|
|
(175 |
) |
|
Balance,
September 30, 2009
|
|
$ |
36,334 |
|
|
$ |
47,436 |
|
|
$ |
559,786 |
|
|
$ |
(29,884 |
) |
|
$ |
(179,454 |
) |
|
$ |
434,218 |
|
The
accompanying notes are an integral part of these consolidated financial
statements.
MATTHEWS
INTERNATIONAL CORPORATION AND SUBSIDIARIES
CONSOLIDATED
STATEMENTS OF CASH FLOWS
for
the years ended September 30, 2009, 2008 and 2007
(Dollar
amounts in thousands, except per share data)
__________
|
|
|
2009
|
|
|
2008
|
|
|
2007
|
|
|
Cash
flows from operating activities:
|
|
|
|
|
|
|
|
|
|
|
Net
income
|
|
$ |
57,732 |
|
|
$ |
79,484 |
|
|
$ |
64,726 |
|
|
Adjustments
to reconcile net income to net cash
provided
by operating activities:
|
|
|
|
|
|
|
|
|
|
|
|
|
|
Depreciation
and amortization
|
|
|
30,292 |
|
|
|
24,935 |
|
|
|
20,528 |
|
|
Minority
interest
|
|
|
2,451 |
|
|
|
3,293 |
|
|
|
2,733 |
|
|
Stock-based
compensation expense
|
|
|
5,822 |
|
|
|
4,899 |
|
|
|
3,509 |
|
|
Increase
in deferred taxes
|
|
|
7,506 |
|
|
|
7,270 |
|
|
|
7,826 |
|
|
(Gain)
loss on dispositions of assets
|
|
|
(276 |
) |
|
|
926 |
|
|
|
(3,106 |
) |
|
Changes
in working capital items
|
|
|
(2,333 |
) |
|
|
(1,793 |
) |
|
|
(14,373 |
) |
|
Increase
in other assets
|
|
|
(2,245 |
) |
|
|
(3,653 |
) |
|
|
(5,113 |
) |
|
(Decrease)
increase in other liabilities
|
|
|
(488 |
) |
|
|
503 |
|
|
|
(1,225 |
) |
|
Decrease
in pension and postretirement
benefit obligations
|
|
|
(7,603 |
) |
|
|
(11,320 |
) |
|
|
(907 |
) |
|
Net cash provided by operating activities
|
|
|
90,858 |
|
|
|
104,544 |
|
|
|
74,598 |
|
|
Cash
flows from investing activities:
|
|
|
|
|
|
|
|
|
|
|
|
|
|
Capital
expenditures
|
|
|
(19,410 |
) |
|
|
(12,053 |
) |
|
|
(20,649 |
) |
|
Acquisitions,
net of cash acquired
|
|
|
(10,953 |
) |
|
|
(98,070 |
) |
|
|
(23,784 |
) |
|
Proceeds
from dispositions of assets
|
|
|
295 |
|
|
|
980 |
|
|
|
6,859 |
|
|
Purchases
of investment securities
|
|
|
(2,620 |
) |
|
|
(5,118 |
) |
|
|
(4,033 |
) |
|
Proceeds
from dispositions of investments
|
|
|
- |
|
|
|
5,537 |
|
|
|
2,919 |
|
|
Net cash used in investing activities
|
|
|
(32,688 |
) |
|
|
(108,724 |
) |
|
|
(38,688 |
) |
|
Cash
flows from financing activities:
|
|
|
|
|
|
|
|
|
|
|
|
|
|
Proceeds
from long-term debt
|
|
|
54,128 |
|
|
|
128,269 |
|
|
|
75,770 |
|
|
Payments
on long-term debt
|
|
|
(69,791 |
) |
|
|
(85,207 |
) |
|
|
(58,024 |
) |
|
Purchases
of treasury stock
|
|
|
(28,762 |
) |
|
|
(43,267 |
) |
|
|
(56,526 |
) |
|
Proceeds
from the sale of treasury stock
|
|
|
1,206 |
|
|
|
19,192 |
|
|
|
16,524 |
|
|
Tax
benefit on exercised stock options
|
|
|
111 |
|
|
|
3,134 |
|
|
|
3,834 |
|
|
Dividends
|
|
|
(8,199 |
) |
|
|
(7,437 |
) |
|
|
(7,083 |
) |
|
Distributions
to minority interests
|
|
|
(2,291 |
) |
|
|
(1,566 |
) |
|
|
(1,601 |
) |
|
Net cash (used in) provided by financing activities
|
|
|
(53,598 |
) |
|
|
13,118 |
|
|
|
(27,106 |
) |
|
Effect
of exchange rate changes on cash
|
|
|
2,493 |
|
|
|
(2,273 |
) |
|
|
5,478 |
|
|
Net
change in cash and cash equivalents
|
|
|
7,065 |
|
|
|
6,665 |
|
|
|
14,282 |
|
|
Cash
and cash equivalents at beginning of year
|
|
|
50,667 |
|
|
|
44,002 |
|
|
|
29,720 |
|
|
Cash
and cash equivalents at end of year
|
|
$ |
57,732 |
|
|
$ |
50,667 |
|
|
$ |
44,002 |
|
|
Cash
paid during the year for:
|
|
|
|
|
|
|
|
|
|
|
|
|
|
Interest
|
|
$ |
12,550 |
|
|
$ |
10,574 |
|
|
$ |
8,105 |
|
|
Income
taxes
|
|
|
26,032 |
|
|
|
32,305 |
|
|
|
31,470 |
|
The
accompanying notes are an integral part of these consolidated financial
statements.
MATTHEWS
INTERNATIONAL CORPORATION AND SUBSIDIARIES
NOTES
TO CONSOLIDATED FINANCIAL STATEMENTS
(Dollar
amounts in thousands, except per share data)
__________
Matthews
International Corporation ("Matthews" or the “Company”), founded in 1850 and
incorporated in Pennsylvania in 1902, is a designer, manufacturer and marketer
principally of memorialization products and brand
solutions. Memorialization products consist primarily of bronze
memorials and other memorialization products, caskets and cremation equipment
for the cemetery and funeral home industries. Brand solutions include
graphics imaging products and services, marking products and merchandising
solutions. The Company's products and operations are comprised of six business
segments: Bronze, Casket, Cremation, Graphics Imaging, Marking
Products and Merchandising Solutions. The Bronze segment is a leading
manufacturer of cast bronze memorials and other memorialization products, cast
and etched architectural products and is a leading builder of mausoleums in the
United States. The Casket segment is a leading casket manufacturer
and distributor in North America and produces a wide variety of wood and metal
caskets. The Cremation segment is a leading designer and manufacturer
of cremation equipment and cremation caskets primarily in North America. The
Graphics Imaging segment manufactures and provides brand management, printing
plates, gravure cylinders, pre-press services and imaging services for the
primary packaging and corrugated industries. The Marking Products
segment designs, manufactures and distributes a wide range of marking and coding
equipment and consumables, and industrial automation products for identifying,
tracking and conveying various consumer and industrial products, components and
packaging containers. The Merchandising Solutions segment designs and
manufactures merchandising displays and systems and provides creative
merchandising and marketing solutions services.
The
Company has manufacturing and marketing facilities in the United States, Mexico,
Canada, Europe, Australia and Asia.
|
2.
|
SUMMARY
OF SIGNIFICANT ACCOUNTING POLICIES:
|
Principles
of Consolidation:
The
consolidated financial statements include all domestic and foreign subsidiaries
in which the Company maintains an ownership interest and has operating
control. All intercompany accounts and transactions have
been eliminated.
Use
of Estimates:
The
preparation of financial statements in conformity with generally accepted
accounting principles requires management to make estimates and assumptions that
affect the reported amounts of assets and liabilities and the disclosure of
contingent assets and liabilities at the date of the financial statements and
the reported amounts of revenues and expenses during the reporting
period. Actual results could differ from those
estimates.
Foreign
Currency:
The
functional currency of the Company’s foreign subsidiaries is the local
currency. Balance sheet accounts for foreign subsidiaries are
translated into U.S. dollars at exchange rates in effect at the consolidated
balance sheet date. Gains or losses that result from this process are
recorded in accumulated other comprehensive income (loss). The
revenue and expense accounts of foreign subsidiaries are translated into U.S.
dollars at the average exchange rates that prevailed during the period. Gains
and losses from foreign currency transactions are recorded in other income
(deductions), net.
NOTES
TO CONSOLIDATED FINANCIAL STATEMENTS, continued
(Dollar
amounts in thousands, except per share data)
__________
|
2.
|
SUMMARY
OF SIGNIFICANT ACCOUNTING POLICIES,
continued:
|
Cash
and Cash Equivalents:
For
purposes of the consolidated statements of cash flows, the Company considers all
investments purchased with a remaining maturity of three months or less to be
cash equivalents. The carrying amount of cash and cash equivalents
approximates fair value due to the short-term maturities of these
instruments.
Allowance
for Doubtful Accounts:
The
allowance for doubtful accounts is based on an evaluation of specific customer
accounts for which available facts and circumstances indicate collectibility may
be uncertain. In addition, the allowance includes a reserve for all
customers based on historical collection experience.
Inventories:
Inventories
are stated at the lower of cost or market with cost generally determined under
the average cost method.
Property,
Plant and Equipment:
Property,
plant and equipment are carried at cost. Depreciation is computed
primarily on the straight-line method over the estimated useful lives of the
assets, which generally range from 10 to 45 years for buildings and 3 to 12
years for machinery and equipment. Gains or losses from the
disposition of assets are reflected in operating profit. The cost of
maintenance and repairs is charged against income as
incurred. Renewals and betterments of a nature considered to extend
the useful lives of the assets are capitalized. Property, plant and
equipment are reviewed for impairment whenever events or changes in
circumstances indicate that the carrying amount of such assets may not be
recoverable. Recoverability of assets is determined by evaluating the
estimated undiscounted net cash flows of the operations to which the assets
relate. An impairment loss would be recognized when the carrying
amount of the assets exceeds the fair value which is based on a discounted cash
flow analysis.
Goodwill
and Other Intangible Assets:
Goodwill
and indefinite-lived intangible assets are not amortized but are subject to
annual review for impairment. Other intangible assets are amortized
over their estimated useful lives, ranging from 2 to 20 years. In general, when
the carrying value of a reporting unit exceeds its implied fair value, an
impairment loss must be recognized. For purposes of testing for
impairment, the Company uses a combination of valuation techniques, including
discounted cash flows. A significant decline in cash flows generated
from these assets may result in a write-down of the carrying values of the
related assets.
Environmental:
Costs
that mitigate or prevent future environmental issues or extend the life or
improve equipment utilized in current operations are capitalized and depreciated
on a straight-line basis over the estimated useful lives of the related
assets. Costs that relate to current operations or an existing
condition caused by past operations are expensed. Environmental
liabilities are recorded when the Company’s obligation is probable and
reasonably estimable. Accruals for losses from environmental
remediation obligations do not consider the effects of inflation, and
anticipated expenditures are not discounted to their present value.
Treasury
Stock:
Treasury
stock is carried at cost. The cost of treasury shares sold is
determined under the average cost method.
NOTES
TO CONSOLIDATED FINANCIAL STATEMENTS, continued
(Dollar
amounts in thousands, except per share data)
__________
|
2.
|
SUMMARY
OF SIGNIFICANT ACCOUNTING POLICIES,
continued:
|
Income
Taxes:
Deferred
tax assets and liabilities are provided for the differences between the
financial statement and tax bases of assets and liabilities using enacted tax
rates in effect for the years in which the differences are expected to
reverse. Valuation allowances are recorded to reduce deferred tax
assets when it is more likely than not that a tax benefit will not be
realized. Deferred income taxes for U.S. tax purposes have not been
provided on certain undistributed earnings of foreign subsidiaries, as such
earnings are considered to be reinvested indefinitely. To the extent
earnings are expected to be returned in the foreseeable future, the associated
deferred tax liabilities are provided.
Revenue
Recognition:
Revenues
are generally recognized when title and risk of loss pass to the customer, which
is typically at the time of product shipment. For pre-need sales of
memorials and vases, revenue is recognized when the memorial has been
manufactured to the customer’s specifications (e.g., name and birth date), title
has been transferred to the customer and the memorial and vase are placed in
storage for future delivery. A liability has been recorded for the
estimated costs of finishing pre-need bronze memorials and vases that have been
manufactured and placed in storage prior to July 1, 2003 for future
delivery. Beginning July 1, 2003, revenue is deferred by the Company
on the portion of pre-need sales attributable to the final finishing and storage
of the pre-need merchandise. Deferred revenue for final finishing is
recognized at the time the pre-need merchandise is finished and shipped to the
customer. Deferred revenue related to storage is recognized on a
straight-line basis over the estimated average time that pre-need merchandise is
held in storage.
At
September 30, 2009, the Company held 342,336 memorials and 240,143 vases in its
storage facilities under the pre-need sales program.
Construction
revenues are recognized under the percentage-of-completion method of accounting
using the cost-to-cost method.
The
Company offers rebates to certain customers participating in volume purchase
programs. Rebates are estimated and recorded as a reduction in sales
at the time the Company’s products are sold.
Share-Based
Payment:
Stock-based
compensation cost is measured at grant date, based on the fair value of the
award, and is recognized as expense over the employee requisite service
period.
Derivatives
and Hedging:
Derivatives
are held as part of a formal documented hedging program. All
derivatives are straight forward and held for purposes other than
trading. Matthews measures effectiveness by formally assessing, at
least quarterly, the historical and probable future high correlation of changes
in the fair value or future cash flows of the hedged item. If the
hedging relationship ceases to be highly effective or it becomes probable that
an expected transaction will no longer occur, gains and losses on the derivative
will be recorded in other income (deductions) at that time.
Changes
in the fair value of derivatives designated as cash flow hedges are recorded in
other comprehensive income (loss), net of tax, and are reclassified to earnings
in a manner consistent with the underlying hedged item. The cash
flows from derivative activities are recognized in the statement of cash flows
in a manner consistent with the underlying hedged item.
NOTES
TO CONSOLIDATED FINANCIAL STATEMENTS, continued
(Dollar
amounts in thousands, except per share data)
__________
|
2.
|
SUMMARY
OF SIGNIFICANT ACCOUNTING POLICIES,
continued:
|
Research
and Development Expenses:
Research
and development costs are expensed as incurred and were approximately $2,200,
$2,100 and $2,700 for the years ended September 30, 2009, 2008 and 2007,
respectively.
Earnings
Per Share:
Basic
earnings per share is computed by dividing net income by the average number of
common shares outstanding. Diluted earnings per share is computed
using the treasury stock method, which assumes the issuance of common stock for
all dilutive securities.
3. FAIR
VALUE MEASUREMENTS:
The
Company adopted new guidance issued by the Financial Accounting Standards Board
(“FASB”) on fair value measurements as of October 1, 2008 for financial assets
and liabilities. This guidance extended the effective date for nonfinancial
assets and liabilities to fiscal years beginning after November 15, 2008. The
Company is evaluating the potential impact of the provision of the guidance, as
it relates to pension plan assets and nonfinancial assets and liabilities on the
consolidated financial statements. This new guidance defines fair value as the
price that would be received to sell an asset or paid to transfer a liability in
an orderly transaction between market participants at the measurement date. It
establishes a three level fair value hierarchy to prioritize the inputs used in
valuations, as defined below:
Level
1: Observable
inputs that reflect unadjusted quoted prices for identical assets or liabilities
in active markets.
Level
2: Inputs
other than quoted prices included within Level 1 that are observable for the
asset or liability, either directly or indirectly.
Level
3: Unobservable
inputs for the asset or liability.
As of
September 30, 2009, the fair values of the Company’s assets and liabilities
measured on a recurring basis are categorized as follows:
|
|
|
Level
1
|
|
|
Level
2
|
|
|
Level
3
|
|
|
Total
|
|
|
Assets:
|
|
|
|
|
|
|
|
|
|
|
|
|
|
Short
term investments
|
|
$ |
62 |
|
|
|
- |
|
|
|
- |
|
|
$ |
62 |
|
|
Trading
securities
|
|
|
10,774 |
|
|
|
- |
|
|
|
- |
|
|
|
10,774 |
|
|
Total
assets at fair value
|
|
$ |
10,836 |
|
|
|
- |
|
|
|
- |
|
|
$ |
10,836 |
|
|
|
|
|
|
|
|
|
|
|
|
|
|
|
|
|
|
|
|
Liabilities:
|
|
|
|
|
|
|
|
|
|
|
|
|
|
|
|
|
|
Derivatives
(1)
|
|
|
- |
|
|
$ |
5,708 |
|
|
|
- |
|
|
$ |
5,708 |
|
|
Total
liabilities at fair value
|
|
|
- |
|
|
$ |
5,708 |
|
|
|
- |
|
|
$ |
5,708 |
|
|
|
|
|
|
|
|
|
|
|
|
|
|
|
|
|
|
|
|
(1) Interest
rate swaps are valued based on observable market swap rates and are
classified within Level 2 of the fair value hierarchy.
|
|
NOTES
TO CONSOLIDATED FINANCIAL STATEMENTS, continued
(Dollar
amounts in thousands, except per share data)
__________
Inventories
at September 30, 2009 and 2008 consisted of the following:
|
|
|
2009
|
|
|
2008
|
|
|
|
|
|
|
|
|
|
|
Materials
and finished goods
|
|
$ |
80,692 |
|
|
$ |
84,925 |
|
|
Labor
and overhead in process
|
|
|
13,763 |
|
|
|
11,463 |
|
|
|
|
$ |
94,455 |
|
|
$ |
96,388 |
|
Investment
securities are recorded at estimated market value at the consolidated balance
sheet date and are classified as trading securities. Short-term
investments consisted principally of corporate obligations with purchased
maturities of over three months but less than one year. The cost of
short-term investments approximated market value at September 30, 2009 and
2008. Accrued interest on these non-current investment securities was
classified with short-term investments. Investments classified as
non-current and trading securities consisted of equity and fixed income mutual
funds.
At
September 30, 2009 and 2008, non-current investments were as
follows:
|
|
|
2009
|
|
|
2008
|
|
|
Trading
securities:
|
|
|
|
|
|
|
|
Mutual
funds
|
|
$ |
10,774 |
|
|
$ |
7,671 |
|
|
Equity
and other investments
|
|
|
2,615 |
|
|
|
2,739 |
|
|
|
|
$ |
13,389 |
|
|
$ |
10,410 |
|
Non-current
investments classified as trading securities are recorded at market value, which
exceeded cost at September 30, 2009 by approximately $231. At
September 30, 2008, cost exceeded market value of trading securities by
approximately $727.
Realized
gains and losses are based on the specific identification method and are
recorded in investment income. Realized gains (losses) for fiscal
2009, 2008 and 2007 were not material.
Equity
investments primarily included ownership interests in various entities of less
than 20%, which are recorded under the cost method of accounting.
NOTES
TO CONSOLIDATED FINANCIAL STATEMENTS, continued
(Dollar
amounts in thousands, except per share data)
__________
|
6.
|
PROPERTY,
PLANT AND EQUIPMENT:
|
Property,
plant and equipment and the related accumulated depreciation at September 30,
2009 and 2008 were as follows:
|
|
|
2009
|
|
|
2008
|
|
|
Buildings
|
|
$ |
65,824 |
|
|
$ |
74,682 |
|
|
Machinery
and equipment
|
|
|
221,723 |
|
|
|
203,271 |
|
|
|
|
|
287,547 |
|
|
|
277,953 |
|
|
Less
accumulated depreciation
|
|
|
(167,038 |
) |
|
|
(143,127 |
) |
|
|
|
|
120,509 |
|
|
|
134,826 |
|
|
Land
|
|
|
8,638 |
|
|
|
8,455 |
|
|
Construction
in progress
|
|
|
8,913 |
|
|
|
2,457 |
|
|
|
|
$ |
138,060 |
|
|
$ |
145,738 |
|
Long-term
debt at September 30, 2009 and 2008 consisted of the following:
|
|
|
2009
|
|
|
2008
|
|
|
Revolving
credit facilities
|
|
$ |
203,841 |
|
|
$ |
204,171 |
|
|
Notes
payable to banks
|
|
|
36,544 |
|
|
|
43,678 |
|
|
Short-term
borrowings
|
|
|
2,855 |
|
|
|
3,266 |
|
|
Other
|
|
|
1,391 |
|
|
|
1,327 |
|
|
Capital
lease obligations
|
|
|
7,087 |
|
|
|
1,826 |
|
|
|
|
|
251,718 |
|
|
|
254,268 |
|
|
Less
current maturities
|
|
|
(14,188 |
) |
|
|
(35,144 |
) |
|
|
|
$ |
237,530 |
|
|
$ |
219,124 |
|
The
Company has a domestic Revolving Credit Facility with a syndicate of financial
institutions. The maximum amount of borrowings available under the
facility is $225,000 and the facility’s maturity is September 2012. Borrowings
under the facility bear interest at LIBOR plus a factor ranging from .40% to
..80% based on the Company’s leverage ratio. The leverage ratio is
defined as net indebtedness divided by EBITDA (earnings before interest, taxes,
depreciation and amortization). The Company is required to pay an
annual commitment fee ranging from .15% to .25% (based on the Company’s leverage
ratio) of the unused portion of the facility. The Revolving
Credit Facility requires the Company to maintain certain leverage and interest
coverage ratios. A portion of the
facility (not to exceed $20,000) is available for the issuance of trade and
standby letters of credit. Outstanding borrowings on the Revolving
Credit Facility at September 30, 2009 and 2008 were $177,500 and $172,500
respectively. The weighted-average interest rate on outstanding
borrowings at September 30, 2009 and 2008 was 2.96% and 4.35%,
respectively.
NOTES
TO CONSOLIDATED FINANCIAL STATEMENTS, continued
(Dollar
amounts in thousands, except per share data)
__________
|
7.
|
LONG-TERM
DEBT, continued:
|
The
Company has entered into the following interest rate swaps:
|
Date
|
Initial
Amount
|
Fixed
Interest Rate
|
Interest
Rate
Spread
at
September
30, 2009
|
Maturity
Date
|
|
September
2007
|
$25,000
|
4.77%
|
.60%
|
September
2012
|
|
May
2008
|
40,000
|
3.72%
|
.60%
|
September
2012
|
|
October
2008
|
20,000
|
3.21%
|
.60%
|
October
2010
|
|
October
2008
|
20,000
|
3.46%
|
.60%
|
October
2011
|
The
Company enters into interest rate swaps in order to achieve a mix of fixed and
variable rate debt that it deems appropriate. The interest rate swaps have been
designated as cash flow hedges of the future variable interest payments under
the Revolving Credit Facility which are considered probable of
occurring. Based on the Company’s assessment, all of the critical
terms of each of the hedges matched the underlying terms of the hedged debt and
related forecasted interest payments, and as such, these hedges were considered
highly effective.
The fair
value of the interest rate swaps reflected an unrealized loss of $5,708 ($3,482
after tax) at September 30, 2009 that is included in shareholders’ equity as
part of accumulated other comprehensive loss (“AOCL”). Assuming
market rates remain constant with the rates at September 30, 2009, approximately
$1,489 of the $3,482 loss included in AOCL is expected to be recognized in
earnings as an adjustment to interest expense over the next twelve
months.
On
January 1, 2009, the Company adopted guidance issued by the FASB regarding
disclosures about derivative instruments and hedging activities. This
guidance amends and expands the disclosure requirements of previous guidance to
require qualitative disclosures about objectives and strategies for using
derivatives, quantitative disclosures about fair value amounts of and gains and
losses on derivative instruments, and disclosures about credit risk-related
contingent features in derivative agreements.
At
September 30, 2009 and 2008, the interest rate swap contracts were reflected as
a liability on the balance sheets. The following derivatives are
designated as hedging instruments:
|
Liability Derivatives
|
|
|
|
|
Balance
Sheet Location:
|
|
2009
|
|
|
2008
|
|
|
Current
liabilities:
|
|
|
|
|
|
|
|
Other
current liabilities
|
|
$ |
2,441 |
|
|
$ |
580 |
|
|
Long-term
liabilities:
|
|
|
|
|
|
|
|
|
|
Other
accrued liabilities and deferred revenue
|
|
|
3,267 |
|
|
|
760 |
|
|
Total
derivatives
|
|
$ |
5,708 |
|
|
$ |
1,340 |
|
|
|
|
|
|
|
|
|
|
|
NOTES
TO CONSOLIDATED FINANCIAL STATEMENTS, continued
(Dollar
amounts in thousands, except per share data)
__________
|
7.
|
LONG-TERM
DEBT, continued:
|
The
income recognized on derivatives was as follows:
|
|
|
Location
of
|
|
Amount
of
|
|
|
Derivatives
in
|
|
Gain
or (Loss)
|
|
Loss
|
|
|
Fair
Value Hedging
|
|
Recognized
in
|
|
Recognized
in Income
|
|
|
Relationships
|
|
Income
on Derivative
|
|
on Derivatives
|
|
|
|
|
|
|
2009
|
|
|
2008
|
|
|
|
|
|
|
|
|
|
|
|
|
|
|
Interest
rate swaps
|
|
Interest
expense
|
|
$
|
(3,499
|
)
|
|
$
|
(587
|
)
|
The
Company recognized the following gains or losses in AOCL:
|
|
|
|
|
|
|
Amount
of Gain
|
|
|
|
|
|
|
Location
of Gain
|
|
or
(Loss)
|
|
|
|
|
|
|
or
(Loss)
|
|
Reclassified
from
|
|
|
Derivatives
in
|
|
Amount
of Loss
|
|
Reclassified
from
|
|
AOCL
|
|
|
Cash
Flow
|
|
Recognized
in
|
|
AOCL
|
|
into
Income
|
|
|
Hedging
|
|
AOCL
on Derivatives
|
|
into
Income
|
|
(Effective
Portion*)
|
|
|
Relationships
|
|
2009
|
|
|
2008
|
|
(Effective
Portion*)
|
|
2009
|
|
|
2008
|
|
|
|
|
|
|
|
|
|
|
|
|
|
|
|
|
|
Interest
rate swaps
|
|
$ |
(3,482 |
) |
|
$ |
(818 |
) |
Interest
expense
|
|
$ |
(2,134 |
) |
|
$ |
358 |
|
|
|
|
|
|
|
|
|
|
|
|
|
|
|
|
|
|
|
|
|
*There is no ineffective portion or
amount excluded from effectiveness testing.
|
|
The
Company, through certain of its German subsidiaries, has a credit facility with
a European bank. The maximum amount of borrowings available under this facility
is 25.0 million Euros ($36,585). Outstanding borrowings under the credit
facility totaled 18.0 million Euros ($26,341) and 22.5 million Euros ($31,671)
at September 30, 2009 and 2008, respectively. The weighted-average
interest rate on outstanding borrowings under this facility at September 30,
2009 and 2008 was 1.75% and 5.86%, respectively. The facility’s
maturity is September 2012.
The
Company, through its German subsidiary, Saueressig GmbH & Co. KG
(“Saueressig”), has several loans with various European
banks. Outstanding borrowings under these loans totaled 10.0 million
Euros ($14,717) and 11.6 million Euros ($16,330) at September 30, 2009 and 2008,
respectively. The weighted-average interest rate on outstanding borrowings of
Saueressig at September 30, 2009 and 2008 was 5.89% and 5.79%,
respectively.
The
Company, through its wholly-owned subsidiary, Matthews International S.p.A., has
several loans with various Italian banks. Outstanding borrowings on
these loans totaled 12.2 million Euros ($17,962) and 15.3 million Euros
($21,565) at September 30, 2009 and 2008, respectively. Matthews
International S.p.A. also has three lines of credit totaling 8.4 million Euros
($12,249) with the same Italian banks. Outstanding borrowings on
these lines were 2.0 million Euros ($2,855) and 2.3 million Euros ($3,256) at
September 30, 2009 and 2008, respectively. The weighted-average
interest rate on outstanding Matthews International S.p.A. borrowings at
September 30, 2009 and 2008 was 3.76% and 3.88%, respectively.
NOTES
TO CONSOLIDATED FINANCIAL STATEMENTS, continued
(Dollar
amounts in thousands, except per share data)
__________
|
7.
|
LONG-TERM
DEBT, continued:
|
As of
September 30, 2009, the fair value of the Company’s long-term debt, including
current maturities, was as follows:
|
Long
term debt, including current maturities:
|
|
|
|
|
Carrying
value included in the Balance Sheet
|
|
$ |
251,718 |
|
|
Fair
Value
|
|
$ |
230,482 |
|
The carrying amounts of the
Company's borrowings under its financing arrangements at September 30, 2008
approximated fair value.
Aggregate
maturities of long-term debt, including short-term borrowings and capital
leases, follows:
|
2010
|
|
$ |
14,188 |
|
|
2011
|
|
|
8,182 |
|
|
2012
|
|
|
213,942 |
|
|
2013
|
|
|
12,046 |
|
|
2014
|
|
|
1,542 |
|
|
Thereafter
|
|
|
1,818 |
|
|
|
|
$ |
251,718 |
|
The
authorized common stock of the Company consists of 70,000,000 shares of Class A
Common Stock, $1 par value.
The
Company has a stock repurchase program, which was initiated in
1996. Under the program, the Company's Board of Directors has
authorized the repurchase of a total of 12,500,000 shares of Matthews’ common
stock, of which 12,279,922 shares have been repurchased as of September 30,
2009. The buy-back program is designed to increase shareholder value,
enlarge the Company's holdings of its common stock, and add to earnings per
share. Repurchased shares may be retained in treasury, utilized for
acquisitions, or reissued to employees or other purchasers, subject to the
restrictions of the Company’s Restated Articles of Incorporation.
Comprehensive
income consists of net income adjusted for changes, net of any related income
tax effect, in cumulative foreign currency translation, the fair value of
derivatives, unrealized investment gains and losses and minimum pension
liability.
Accumulated
other comprehensive loss at September 30, 2009 and 2008 consisted of the
following:
|
|
|
2009
|
|
|
2008
|
|
|
Cumulative
foreign currency translation
|
|
$ |
22,392 |
|
|
$ |
18,203 |
|
|
Fair
value of derivatives, net of tax of $2,226 and $522,
respectively
|
|
|
(3,482 |
) |
|
|
(818 |
) |
|
Minimum
pension liability, net of tax of $30,965 and $12,789,
respectively
|
|
|
(48,794 |
) |
|
|
(20,364 |
) |
|
|
|
$ |
(29,884 |
) |
|
$ |
(2,979 |
) |
NOTES
TO CONSOLIDATED FINANCIAL STATEMENTS, continued
(Dollar
amounts in thousands, except per share data)
__________
The
Company maintains a stock incentive plan (the “1992 Incentive Stock Plan”) that
provided for grants of stock options, restricted shares and certain other types
of stock-based awards. In February 2008, the Company’s shareholders
approved the adoption of a new plan, the 2007 Equity Incentive Plan (the “2007
Plan”), that provides for the grants of stock options, restricted shares,
stock-based performance units and certain other types of stock-based awards.
Under the 2007 Plan, which has a ten-year term, the maximum number of shares
available for grants or awards is an aggregate of 2,200,000. There
will be no further grants under the 1992 Incentive Stock Plan. At
September 30, 2009, there were 1,878,010 shares reserved for future issuance
under the 2007 Plan. Both plans are administered by the Compensation Committee
of the Board of Directors.
The
option price for each stock option granted under either plan may not be less
than the fair market value of the Company's common stock on the date of
grant. Outstanding stock options are generally exercisable in
one-third increments upon the attainment of 10%, 33% and 60% appreciation in the
market value of the Company’s Class A Common Stock. In addition,
options generally vest in one-third increments after three, four and five years,
respectively, from the grant date (but, in any event, not until the attainment
of the market value thresholds). The options expire on the earlier of
ten years from the date of grant, upon employment termination, or within
specified time limits following voluntary employment termination (with the
consent of the Company), retirement or death. The Company generally
settles employee stock option exercises with treasury shares. With
respect to outstanding restricted share grants, generally one-half of the shares
vest on the third anniversary of the grant. The remaining one-half of
the shares vest in one-third increments upon attainment of 10%, 25% and 40%
appreciation in the market value of the Company’s Class A Common
Stock. Unvested restricted shares generally expire on the earlier of
five years from the date of grant, upon employment termination, or within
specified time limits following voluntary employment termination (with the
consent of the Company), retirement or death. The Company issues
restricted shares from treasury shares.
For the
years ended September 30, 2009, 2008 and 2007, stock-based compensation cost
totaled $5,822, $4,899 and $3,509, respectively. The associated
future income tax benefit recognized was $2,270, $1,911 and $1,369 for the years
ended September 30, 2009, 2008 and 2007, respectively.
The
amount of cash received from the exercise of stock options was $1,206, $19,192
and $16,524, for the years ended September 30, 2009, 2008 and 2007,
respectively. In connection with these exercises, the tax benefits
realized by the Company were $260, $5,111 and $5,976 for the years ended
September 30, 2009, 2008 and 2007, respectively.
The
transactions for restricted stock for the year ended September 30, 2009 were as
follows:
|
|
|
|
|
|
Weighted-
|
|
|
|
|
|
|
|
average
|
|
|
|
|
|
|
|
grant-date
|
|
|
|
|
Shares
|
|
|
fair
value
|
|
|
Non-vested
at September 30, 2008
|
|
|
113,121 |
|
|
$ |
39.05 |
|
|
Granted
|
|
|
160,995 |
|
|
|
36.64 |
|
|
Vested
|
|
|
(1,200 |
) |
|
|
43.72 |
|
|
Expired
or forfeited
|
|
|
(1,260 |
) |
|
|
36.41 |
|
|
Non-vested
at September 30, 2009
|
|
|
271,656 |
|
|
|
37.61 |
|
As of
September 30, 2009, the total unrecognized compensation cost related to unvested
restricted stock was $4,026 which is expected to be recognized over a
weighted-average period of 1.6 years.
NOTES
TO CONSOLIDATED FINANCIAL STATEMENTS, continued
(Dollar
amounts in thousands, except per share data)
__________
|
9.
|
SHARE-BASED
PAYMENTS, continued:
|
The
transactions for shares under options for the year ended September 30, 2009 were
as follows:
|
|
|
|
|
|
|
|
|
Weighted-
|
|
|
|
|
|
|
|
|
|
|
Weighted-
|
|
|
average
|
|
|
Aggregate
|
|
|
|
|
|
|
|
average
|
|
|
remaining
|
|
|
intrinsic
|
|
|
|
|
Shares
|
|
|
exercise
price
|
|
|
contractual
term
|
|
|
value
|
|
|
Outstanding,
September 30, 2008
|
|
|
1,366,342 |
|
|
$ |
35.56 |
|
|
|
|
|
|
|
|
Granted
|
|
|
- |
|
|
|
- |
|
|
|
|
|
|
|
|
Exercised
|
|
|
(49,568 |
) |
|
|
24.33 |
|
|
|
|
|
|
|
|
Expired
or forfeited
|
|
|
(91,865 |
) |
|
|
36.57 |
|
|
|
|
|
|
|
|
Outstanding,
September 30, 2009
|
|
|
1,224,909 |
|
|
|
35.94 |
|
|
|
5.8 |
|
|
$ |
- |
|
|
Exercisable,
September 30, 2009
|
|
|
551,874 |
|
|
|
32.51 |
|
|
|
4.9 |
|
|
$ |
1,582 |
|
The fair
value of option shares earned was $2,722, $4,906 and $4,331 during the years
ended September 30, 2009, 2008 and 2007, respectively. The intrinsic
value of options (which is the amount by which the stock price exceeded the
exercise price of the options on the date of exercise) exercised during the
years ended September 30, 2009, 2008 and 2007 was $753, $13,422 and $15,336,
respectively.
The
transactions for non-vested option shares for the year ended September 30, 2009
were as follows:
|
|
|
|
|
|
Weighted-
|
|
|
|
|
|
|
|
average
|
|
|
|
|
|
|
|
grant-date
|
|
|
|
|
Shares
|
|
|
fair
value
|
|
|
Non-vested
at September 30, 2008
|
|
|
1,034,868 |
|
|
$ |
11.46 |
|
|
Granted
|
|
|
- |
|
|
|
- |
|
|
Vested
|
|
|
(270,818 |
) |
|
|
10.05 |
|
|
Expired
or forfeited
|
|
|
(91,015 |
) |
|
|
10.40 |
|
|
Non-vested
at September 30, 2009
|
|
|
673,035 |
|
|
|
12.17 |
|
As of
September 30, 2009, the total unrecognized compensation cost related to
non-vested stock options was approximately $1,213. This cost is
expected to be recognized over a weighted-average period of 1.8 years in
accordance with the vesting periods of the options.
The fair
value of each option and restricted stock grant is estimated on the date of
grant using a binomial lattice valuation model. The following table
indicates the assumptions used in estimating fair value of stock options (fiscal
2007) and restricted stock (fiscal 2009 and 2008) for the years ended September
30, 2009, 2008 and 2007.
|
|
|
2009
|
|
|
2008
|
|
|
2007
|
|
|
Expected
volatility
|
|
|
27.0 |
% |
|
|
24.0 |
% |
|
|
24.0 |
% |
|
Dividend
yield
|
|
|
.6 |
% |
|
|
.6 |
% |
|
|
.6 |
% |
|
Average
risk-free interest rate
|
|
|
2.4 |
% |
|
|
3.6 |
% |
|
|
4.7 |
% |
|
Average
expected term (years):
|
|
|
|
|
|
|
|
|
|
|
|
|
|
Restricted
shares
|
|
|
2.3 |
|
|
|
2.3 |
|
|
|
- |
|
|
Stock
options
|
|
|
- |
|
|
|
- |
|
|
|
6.3 |
|
NOTES
TO CONSOLIDATED FINANCIAL STATEMENTS, continued
(Dollar
amounts in thousands, except per share data)
__________
|
9.
|
SHARE-BASED
PAYMENTS, continued:
|
The
risk-free interest rate is based on United States Treasury yields at the date of
grant. The dividend yield is based on the most recent dividend payment and
average stock price over the 12 months prior to the grant
date. Expected volatilities are based on the historical volatility of
the Company’s stock price. The expected term for grants in the year
ended September 30, 2007 represents an estimate of the period of time options
are expected to remain outstanding. The expected term for
grants in the years ended September 30, 2009 and 2008 represent an estimate of
the average period of time for restricted shares to vest. Separate
employee groups and option characteristics are considered separately for
valuation purposes.
Under the
Company’s Director Fee Plan, directors (except for the Chairman of the Board)
who are not also officers of the Company each receive, as an annual retainer
fee, either cash or shares of the Company's Class A Common Stock equivalent to
$60. The equivalent amount paid to a non-employee Chairman of the
Board is $130. Where the annual retainer fee is provided in shares, each
director may elect to be paid these shares on a current basis or have such
shares credited to a deferred stock account as phantom stock, with such shares
to be paid to the director subsequent to leaving the Board. The value
of deferred shares is recorded in other liabilities. A total of
25,013 shares had been deferred under the Director Fee Plan at September
30, 2009. Additionally, directors who are not also officers of
the Company each receive an annual stock-based grant (non-statutory stock
options, stock appreciation rights and/or restricted shares) with a value of
$70. A total of 22,300 stock options have been granted under the
plan. At September 30, 2009, 17,800 options were outstanding and
vested. Additionally, 37,210 shares of restricted stock have been granted under
the plan, 22,810 of which were unvested at September 30, 2009. A
total of 300,000 shares have been authorized to be issued under the Director Fee
Plan.
10. EARNINGS
PER SHARE:
|
|
|
2009
|
|
|
2008
|
|
|
2007
|
|
|
|
|
|
|
|
|
|
|
|
|
|
Net
income
|
|
$ |
57,732 |
|
|
$ |
79,484 |
|
|
$ |
64,726 |
|
|
|
|
|
|
|
|
|
|
|
|
|
|
|
|
|
|
|
|
|
|
|
|
|
|
|
|
|
|
Weighted-average
common shares outstanding
|
|
|
30,245,343 |
|
|
|
30,927,719 |
|
|
|
31,565,716 |
|
|
|
|
|
|
|
|
|
|
|
|
|
|
|
|
Dilutive
securities, stock options and restricted stock
|
|
|
189,727 |
|
|
|
230,584 |
|
|
|
113,900 |
|
|
|
|
|
|
|
|
|
|
|
|
|
|
|
|
Diluted
weighted-average common shares outstanding
|
|
|
30,435,070 |
|
|
|
31,158,303 |
|
|
|
31,679,616 |
|
|
|
|
|
|
|
|
|
|
|
|
|
|
|
|
Basic
earnings per share
|
|
|
$1.91 |
|
|
|
$2.57 |
|
|
|
$2.05 |
|
|
|
|
|
|
|
|
|
|
|
|
|
|
|
|
Diluted
earnings per share
|
|
|
$1.90 |
|
|
|
$2.55 |
|
|
|
$2.04 |
|
|
|
|
|
|
|
|
|
|
|
|
|
|
|
Options
to purchase 764,650 shares of common stock were not included in the computation
of diluted earnings per share for the year ended September 30, 2009 because the
inclusion of these options would be anti-dilutive. There were no
anti-dilutive securities in the years ended September 30, 2008 and
2007.
NOTES
TO CONSOLIDATED FINANCIAL STATEMENTS, continued
(Dollar
amounts in thousands, except per share data)
__________
|
11.
|
PENSION
AND OTHER POSTRETIREMENT PLANS:
|
The
Company provides defined benefit pension and other postretirement plans to
certain employees. Effective September 30, 2007, the Company adopted the FASB
guidance on accounting for defined benefit pension and other post retirement
plans. The following provides a reconciliation of benefit obligations, plan
assets and funded status of the plans as of the Company’s actuarial valuation as
of September 30, 2009:
|
|
|
Pension
|
|
|
Other
Postretirement
|
|
|
|
|
2009
|
|
|
2008
|
|
|
2009
|
|
|
2008
|
|
|
Change in benefit
obligation:
|
|
|
|
|
|
|
|
|
|
|
|
|
|
Benefit obligation, beginning
|
|
$ |
108,631 |
|
|
$ |
111,543 |
|
|
$ |
21,887 |
|
|
$ |
21,819 |
|
|
Effect of change to fiscal year-end valuation
|
|
|
(6,322 |
) |
|
|
- |
|
|
|
(953 |
) |
|
|
- |
|
|
Adjusted balance, beginning of year
|
|
|
102,309 |
|
|
|
111,543 |
|
|
|
20,934 |
|
|
|
21,819 |
|
|
Service cost
|
|
|
3,366 |
|
|
|
4,107 |
|
|
|
572 |
|
|
|
585 |
|
|
Interest cost
|
|
|
7,496 |
|
|
|
7,042 |
|
|
|
1,542 |
|
|
|
1,391 |
|
|
Assumption changes
|
|
|
33,600 |
|
|
|
(6,970 |
) |
|
|
4,890 |
|
|
|
943 |
|
|
Actuarial gain
|
|
|
(2,638 |
) |
|
|
(1,608 |
) |
|
|
(1,507 |
) |
|
|
(1,882 |
) |
|
Benefit payments
|
|
|
(5,198 |
) |
|
|
(5,483 |
) |
|
|
(781 |
) |
|
|
(968 |
) |
|
Benefit obligation, ending
|
|
|
138,935 |
|
|
|
108,631 |
|
|
|
25,650 |
|
|
|
21,888 |
|
|
|
|
|
|
|
|
|
|
|
|
|
|
|
|
|
|
|
|
Change in plan
assets:
|
|
|
|
|
|
|
|
|
|
|
|
|
|
|
|
|
|
Fair value, beginning
|
|
|
90,516 |
|
|
|
87,040 |
|
|
|
- |
|
|
|
- |
|
|
Effect of change to fiscal year-end valuation
|
|
|
(6,057 |
) |
|
|
- |
|
|
|
- |
|
|
|
- |
|
|
Adjusted balance, beginning of year
|
|
|
84,459 |
|
|
|
87,040 |
|
|
|
- |
|
|
|
- |
|
|
Actual return
|
|
|
(7,792 |
) |
|
|
(7,511 |
) |
|
|
- |
|
|
|
- |
|
|
Benefit payments
|
|
|
(5,198 |
) |
|
|
(5,483 |
) |
|
|
(781 |
) |
|
|
(968 |
) |
|
Employer contributions
|
|
|
12,959 |
|
|
|
16,470 |
|
|
|
781 |
|
|
|
968 |
|
|
Fair value, ending
|
|
|
84,428 |
|
|
|
90,516 |
|
|
|
- |
|
|
|
- |
|
|
|
|
|
|
|
|
|
|
|
|
|
|
|
|
|
|
|
|
Funded status
|
|
|
(54,506 |
) |
|
|
(18,115 |
) |
|
|
(25,650 |
) |
|
|
(21,888 |
) |
|
Unrecognized
actuarial loss
|
|
|
72,996 |
|
|
|
29,462 |
|
|
|
8,467 |
|
|
|
6,665 |
|
|
Unrecognized
prior service cost
|
|
|
251 |
|
|
|
283 |
|
|
|
(1,414 |
) |
|
|
(2,926 |
) |
|
Net
amount recognized
|
|
$ |
18,741 |
|
|
$ |
11,630 |
|
|
$ |
(18,597 |
) |
|
$ |
(18,149 |
) |
|
|
|
|
|
|
|
|
|
|
|
|
|
|
|
|
|
|
|
Amounts recognized in
the consolidated balance sheet:
|
|
|
|
|
|
|
|
|
|
|
|
|
|
|
|
|
|
Current liability
|
|
$ |
(772 |
)
|
|
$ |
(907 |
)
|
|
$ |
(1,051 |
) |
|
$ |
(970 |
) |
|
Noncurrent benefit liability
|
|
|
(53,734 |
) |
|
|
(17,208 |
) |
|
|
(24,599 |
) |
|
|
(20,917 |
) |
|
Accumulated other comprehensive loss
|
|
|
73,247 |
|
|
|
29,745 |
|
|
|
7,053 |
|
|
|
3,738 |
|
|
Net
amount recognized
|
|
$ |
18,741 |
|
|
$ |
11,630 |
|
|
$ |
(18,
597 |
) |
|
$ |
(18,149 |
) |
|
|
|
|
|
|
|
|
|
|
|
|
|
|
|
|
|
|
|
Amounts recognized in
accumulated
|
|
|
|
|
|
|
|
|
|
|
|
|
|
other
comprehensive loss:
|
|
|
|
|
|
|
|
|
|
|
|
|
|
Net
actuarial loss
|
|
$ |
72,996 |
|
|
$ |
29,462 |
|
|
$ |
8,467 |
|
|
$ |
6,665 |
|
|
Prior
service cost
|
|
|
251 |
|
|
|
283 |
|
|
|
(1,414 |
) |
|
|
(2,926 |
) |
|
Net
amount recognized
|
|
$ |
73,247 |
|
|
$ |
29,745 |
|
|
$ |
7,053 |
|
|
$ |
3,739 |
|
|
|
|
|
|
|
|
|
|
|
|
|
|
|
|
|
|
|
NOTES
TO CONSOLIDATED FINANCIAL STATEMENTS, continued
(Dollar
amounts in thousands, except per share data)
__________
|
11.
|
PENSION
AND OTHER POSTRETIREMENT PLANS,
continued:
|
Based
upon actuarial valuations performed as of September 30, 2009 and July 31, 2008
(plan year-end), the accumulated benefit obligation for the Company’s defined
benefit pension plans was $120,825 and $95,703 at September 30, 2009 and 2008,
respectively, and the projected benefit obligation for the Company’s defined
benefit pension plans was $138,935 and $108,631 at September 30, 2009 and 2008,
respectively.
Net
periodic pension and other postretirement benefit cost for the plans included
the following:
|
|
|
Pension
|
|
|
Other
Postretirement
|
|
|
|
|
2009
|
|
|
2008
|
|
|
2007
|
|
|
2009
|
|
|
2008
|
|
|
2007
|
|
|
|
|
|
|
|
|
|
|
|
|
|
|
|
|
|
|
|
|
|
|
Service
cost
|
|
$ |
3,366 |
|
|
$ |
4,107 |
|
|
$ |
3,892 |
|
|
$ |
572 |
|
|
$ |
585 |
|
|
$ |
533 |
|
|
Interest
cost
|
|
|
7,496 |
|
|
|
7,042 |
|
|
|
6,525 |
|
|
|
1,542 |
|
|
|
1,391 |
|
|
|
1,188 |
|
|
Expected
return on plan assets
|
|
|
(7,593 |
) |
|
|
(7,454 |
) |
|
|
(6,410 |
) |
|
|
- |
|
|
|
- |
|
|
|
- |
|
|
Amortization:
|
|
|
|
|
|
|
|
|
|
|
|
|
|
|
|
|
|
|
|
|
|
|
|
|
|
Prior
service cost
|
|
|
28 |
|
|
|
28 |
|
|
|
31 |
|
|
|
(1,297 |
) |
|
|
(1,287 |
) |
|
|
(1,287 |
) |
|
Net
actuarial loss
|
|
|
1,759 |
|
|
|
1,220 |
|
|
|
1,527 |
|
|
|
294 |
|
|
|
486 |
|
|
|
288 |
|
|
Net
benefit cost
|
|
$ |
5,056 |
|
|
$ |
4,943 |
|
|
$ |
5,565 |
|
|
$ |
1,111 |
|
|
$ |
1,175 |
|
|
$ |
722 |
|
Benefit
payments under the Company’s principal retirement plan are made from plan
assets, while benefit payments under the supplemental retirement plan and
postretirement benefit plan are made from the Company’s operating
cash. Under IRS regulations, the Company was not required to make any
significant contributions to its principal retirement plan in fiscal 2009,
however, the Company made a contribution of $12,000 to its principal retirement
plan. The Company is not required to make any significant contributions to its
principal retirement plan in fiscal 2010. Contributions of $835
and $781 were made under the Company’s supplemental retirement plan and
postretirement benefit plan, respectively, in fiscal 2009.
Amounts
of AOCL expected to be recognized in net periodic benefit costs in fiscal 2010
include:
|
|
|
|
|
|
Other
|
|
|
|
|
Pension
|
|
|
Postretirement
|
|
|
|
|
Benefits
|
|
|
Benefits
|
|
|
|
|
|
|
|
|
|
|
Net
actuarial gain/loss
|
|
$ |
5,406 |
|
|
$ |
521 |
|
|
Prior
service cost
|
|
|
24 |
|
|
|
726 |
|
NOTES
TO CONSOLIDATED FINANCIAL STATEMENTS, continued
(Dollar
amounts in thousands, except per share data)
__________
|
11.
|
PENSION
AND OTHER POSTRETIREMENT PLANS,
continued:
|
The
measurement date of annual actuarial valuations for the Company’s principal
retirement and other postretirement benefit plans was September 30 for fiscal
2009, and was July 31 (plan year-end) for fiscal 2008 and 2007. The
weighted-average assumptions for those plans were:
|
|
|
Pension
|
|
|
Other
Postretirement
|
|
|
|
|
2009
|
|
|
2008
|
|
|
2007
|
|
|
2009
|
|
|
2008
|
|
|
2007
|
|
|
Discount
rate
|
|
|
5.50 |
% |
|
|
7.00 |
% |
|
|
6.50 |
% |
|
|
5.50 |
% |
|
|
7.00 |
% |
|
|
6.50 |
% |
|
Return
on plan assets
|
|
|
8.50 |
|
|
|
8.50 |
|
|
|
9.00 |
|
|
|
- |
|
|
|
- |
|
|
|
- |
|
|
Compensation
increase
|
|
|
4.25 |
|
|
|
4.25 |
|
|
|
4.25 |
|
|
|
- |
|
|
|
- |
|
|
|
- |
|
The
Company's principal pension plan maintains a substantial portion of its assets
in equity securities in accordance with the investment policy established by the
Company’s pension board. Based on an analysis of the historical
performance of the plan's assets and information provided by its independent
investment advisor, the Company set the long-term rate of return assumption for
these assets at 8.5% in 2009 for purposes of determining pension cost and funded
status under current guidance. The Company’s discount rate assumption
used in determining the present value of the projected benefit obligation is
based upon published indices.
Benefit
payments expected to be paid are as follows:
|
|
|
|
|
|
Other
|
|
|
|
|
Pension
|
|
|
Postretirement
|
|
|
Years ending September
30:
|
|
Benefits
|
|
|
Benefits
|
|
|
|
|
|
|
|
|
|
|
2010
|
|
$ |
5,320 |
|
|
$ |
1,051 |
|
|
2011
|
|
|
5,614 |
|
|
|
1,163 |
|
|
2012
|
|
|
5,957 |
|
|
|
1,255 |
|
|
2013
|
|
|
6,244 |
|
|
|
1,379 |
|
|
2014
|
|
|
6,612 |
|
|
|
1,530 |
|
|
2015-2019
|
|
|
39,514 |
|
|
|
9,669 |
|
|
|
|
$ |
69,261 |
|
|
$ |
16,047 |
|
For
measurement purposes, a rate of increase of 8% in the per capita cost of health
care benefits was assumed for 2010; the rate was assumed to decrease gradually
to 5.0% for 2030 and remain at that level thereafter. Assumed health
care cost trend rates have a significant effect on the amounts
reported. An increase in the assumed health care cost trend rates by
one percentage point would have increased the accumulated postretirement benefit
obligation as of September 30, 2009 by $1,418 and the aggregate of the service
and interest cost components of net periodic postretirement benefit cost for the
year then ended by $144. A decrease in the assumed health care cost
trend rates by one percentage point would have decreased the accumulated
postretirement benefit obligation as of September 30, 2009 by $1,250 and the
aggregate of the service and interest cost components of net periodic
postretirement benefit cost for the year then ended by $126.
NOTES
TO CONSOLIDATED FINANCIAL STATEMENTS, continued
(Dollar
amounts in thousands, except per share data)
__________
The
provision for income taxes consisted of the following:
|
|
|
2009
|
|
|
2008
|
|
|
2007
|
|
|
Current:
|
|
|
|
|
|
|
|
|
|
|
Federal
|
|
$ |
15,896 |
|
|
$ |
22,270 |
|
|
$ |
20,941 |
|
|
State
|
|
|
1,584 |
|
|
|
4,735 |
|
|
|
2,762 |
|
|
Foreign
|
|
|
5,461 |
|
|
|
7,813 |
|
|
|
7,461 |
|
|
|
|
|
22,941 |
|
|
|
34,818 |
|
|
|
31,164 |
|
|
Statutory
rate changes
|
|
|
- |
|
|
|
(1,882 |
) |
|
|
- |
|
|
Deferred
|
|
|
7,870 |
|
|
|
9,152 |
|
|
|
7,826 |
|
|
Total
|
|
$ |
30,811 |
|
|
$ |
42,088 |
|
|
$ |
38,990 |
|
|
|
|
|
|
|
|
|
|
|
|
|
|
|
|
|
|
2009
|
|
|
2008
|
|
|
Deferred
tax assets:
|
|
|
|
|
|
|
|
Postretirement
benefits
|
|
$ |
10,014 |
|
|
$ |
8,536 |
|
|
Environmental
reserve
|
|
|
2,854 |
|
|
|
3,215 |
|
|
Pension
costs
|
|
|
20,463 |
|
|
|
6,271 |
|
|
Deferred
compensation
|
|
|
1,752 |
|
|
|
2,646 |
|
|
Stock
options
|
|
|
5,361 |
|
|
|
3,714 |
|
|
Other
|
|
|
16,772 |
|
|
|
14,082 |
|
|
|
|
|
57,216 |
|
|
|
38,464 |
|
|
Deferred
tax liabilities:
|
|
|
|
|
|
|
|
|
|
Depreciation
|
|
|
(365 |
) |
|
|
(1,647 |
) |
|
Goodwill
|
|
|
(35,605 |
) |
|
|
(28,426 |
) |
|
Other
|
|
|
(331 |
) |
|
|
- |
|
|
|
|
|
(36,301 |
) |
|
|
(30,073 |
) |
|
|
|
|
|
|
|
|
|
|
|
Net
deferred tax asset
|
|
$ |
20,915 |
|
|
$ |
8,391 |
|
The
reconciliation of the federal statutory tax rate to the consolidated effective
tax rate was as follows:
|
|
|
2009
|
|
|
2008
|
|
|
2007
|
|
|
Federal
statutory tax rate
|
|
|
35.0 |
% |
|
|
35.0 |
% |
|
|
35.0 |
% |
|
Effect
of state income taxes, net of federal deduction
|
|
|
2.9 |
|
|
|
3.2 |
|
|
|
2.2 |
|
|
Foreign
taxes (less than) in excess of federal statutory rate
|
|
|
(1.4 |
) |
|
|
(0.5 |
) |
|
|
.5 |
|
|
Changes
in statutory tax rates
|
|
|
-
|
|
|
|
(1.5 |
)
|
|
|
- |
|
|
Other
|
|
|
(1.7 |
) |
|
|
(1.6 |
) |
|
|
(0.1 |
) |
|
Effective
tax rate
|
|
|
34.8 |
% |
|
|
34.6 |
% |
|
|
37.6 |
% |
The
Company's foreign subsidiaries had income before income taxes for the years
ended September 30, 2009, 2008 and 2007 of approximately $24,815, $24,326 and
$24,300, respectively. At September 30, 2009, undistributed earnings
of foreign subsidiaries for which deferred U.S. income taxes have not been
provided approximated $120,540.
NOTES
TO CONSOLIDATED FINANCIAL STATEMENTS, continued
(Dollar
amounts in thousands, except per share data)
__________
12. INCOME
TAXES, continued
On
October 1, 2007, the Company adopted FASB guidance on uncertainty in income
taxes which clarifies the accounting for uncertainty in income taxes recognized
in an enterprise's financial statements. This guidance prescribes a
recognition threshold and measurement attribute for the financial statement
recognition and measurement of a tax position taken or expected to be taken in a
tax return and provides guidance on recognition, classification, interest and
penalties, accounting in interim periods, disclosures and transition. The
adoption of this guidance did not have a material effect on the Company's
financial statements.
Changes
in the total amount of gross unrecognized tax benefits (excluding penalties and
interest) are as follows:
|
Balance
at September 30, 2008
|
|
$ |
4,370 |
|
|
Increases
for tax positions of prior years
|
|
|
120 |
|
|
Decreases
for tax positions of prior years
|
|
|
(607 |
) |
|
Increases
based on tax positions related to the current year
|
|
|
674 |
|
|
Decreases
due to settlements with taxing authorities
|
|
|
(542 |
) |
|
Decreases
due to lapse of statute of limitation
|
|
|
(440 |
) |
|
Balance
at September 30, 2009
|
|
$ |
3,575 |
|
The
Company had unrecognized tax benefits of $3,575 and $4,370 at September 30, 2009
and 2008, respectively, all of which, if recorded, would impact the annual
effective tax rate. It is reasonably possible that the amount of
unrecognized tax benefits could change by approximately $406 in the next 12
months primarily due to expiration of statutes related to specific tax
positions.
The
Company classifies interest and penalties on tax uncertainties as a component of
the provision for income taxes. For Fiscal 2009, the Company included a net
increase of $64 in interest and penalties as a component of the provision for
income taxes. Total penalties and interest accrued were $2,838 and $2,774 at
September 30, 2009 and 2008, respectively. These accruals may
potentially be applicable in the event of an unfavorable outcome of uncertain
tax positions.
The
Company is currently under examination in several tax jurisdictions and remains
subject to examination until the statute of limitation expires for those tax
jurisdictions. As of September 30, 2009, the tax years that remain
subject to examination by major jurisdiction generally are:
|
United
States - Federal
|
2007
and forward
|
|
United
States - State
|
2006
and forward
|
|
Canada
|
2004
and forward
|
|
Europe
|
2002
and forward
|
|
United
Kingdom
|
2008
and forward
|
|
Australia
|
2005
and forward
|
|
13.
|
COMMITMENTS
AND CONTINGENT LIABILITIES:
|
The
Company operates various production, warehouse and office facilities and
equipment under operating lease agreements. Annual rentals under
these and other operating leases were $14,881, $16,938 and $15,621 in fiscal
2009, 2008 and 2007, respectively. Future minimum rental commitments
under non-cancelable operating lease arrangements for fiscal years 2010 through
2014 are $8,070, $5,933, $3,850, $2,115 and $902, respectively, and $596
thereafter.
The
Company is party to various legal proceedings, the eventual outcome of which are
not predictable. Although the ultimate disposition of these
proceedings is not presently determinable, management is of the opinion that
they should not result in liabilities in an amount which would materially affect
the Company’s consolidated financial position, results of operations or cash
flows.
NOTES
TO CONSOLIDATED FINANCIAL STATEMENTS, continued
(Dollar
amounts in thousands, except per share data)
__________
|
13.
|
COMMITMENTS
AND CONTINGENT LIABILITIES,
continued:
|
The
Company has employment agreements with certain employees, the terms of which
expire at various dates between 2009 and 2013. The agreements
generally provide for base salary and bonus levels and include non-compete
provisions. The aggregate commitment for salaries under these
agreements at September 30, 2009 was $6,676.
|
14.
|
ENVIRONMENTAL
MATTERS:
|
The
Company's operations are subject to various federal, state and local laws and
regulations relating to the protection of the environment. These laws
and regulations impose limitations on the discharge of materials into the
environment and require the Company to obtain and operate in compliance with
conditions of permits and other government authorizations. As such,
the Company has developed environmental, health and safety policies and
procedures that include the proper handling, storage and disposal of hazardous
materials.
The
Company is party to various environmental matters. These include
obligations to investigate and mitigate the effects on the environment of the
disposal of certain materials at various operating and non-operating
sites. The Company is currently performing environmental assessments
and remediation at these sites, as appropriate. In addition, prior to
its acquisition, The York Group, Inc. (“York”) was identified, along with
others, by the Environmental Protection Agency as a potentially responsible
party for remediation of a landfill site in York, Pennsylvania. At
this time, the Company has not been joined in any lawsuit or administrative
order related to the site or its clean-up.
At
September 30, 2009, an accrual of $7,318 had been recorded for environmental
remediation (of which $836 was classified in other current liabilities),
representing management's best estimate of the probable and reasonably estimable
costs of the Company's known remediation obligations. The accrual,
which reflects previously established reserves assumed with the acquisition of
York and additional reserves recorded as a purchase accounting adjustment, does
not consider the effects of inflation and anticipated expenditures are not
discounted to their present value. While final resolution of these
contingencies could result in costs different than current accruals, management
believes the ultimate outcome will not have a significant effect on the
Company's consolidated results of operations or financial position.
|
15.
|
SUPPLEMENTAL
CASH FLOW INFORMATION:
|
Changes
in working capital items as presented in the Consolidated Statements of Cash
Flows consisted of the following:
|
|
|
2009
|
|
|
2008
|
|
|
2007
|
|
|
Current
assets:
|
|
|
|
|
|
|
|
|
|
|
Accounts
receivable
|
|
$ |
8,828 |
|
|
$ |
(6,677 |
) |
|
$ |
1,502 |
|
|
Inventories
|
|
|
4,751 |
|
|
|
9,361 |
|
|
|
(2,135 |
) |
|
Other
current assets
|
|
|
(2,940 |
) |
|
|
(1,729 |
) |
|
|
(2,567 |
) |
|
|
|
|
10,639 |
|
|
|
955 |
|
|
|
(3,200 |
) |
|
Current
liabilities:
|
|
|
|
|
|
|
|
|
|
|
|
|
|
Trade
accounts payable
|
|
|
1,444 |
|
|
|
(1,418 |
) |
|
|
1,064 |
|
|
Accrued
compensation
|
|
|
(4,791 |
) |
|
|
6,314 |
|
|
|
(2,411 |
) |
|
Accrued
income taxes
|
|
|
(4,104 |
) |
|
|
4,601 |
|
|
|
(3,644 |
) |
|
Customer
prepayments
|
|
|
(974 |
) |
|
|
(2,397 |
) |
|
|
514 |
|
|
Other
current liabilities
|
|
|
(4,547 |
) |
|
|
(9,848 |
) |
|
|
(6,696 |
) |
|
|
|
|
(12,972 |
) |
|
|
(2,748 |
) |
|
|
(11,173 |
) |
|
Net
change
|
|
$ |
(2,333 |
) |
|
$ |
(1,793 |
) |
|
$ |
(14,373 |
) |
NOTES
TO CONSOLIDATED FINANCIAL STATEMENTS, continued
(Dollar
amounts in thousands, except per share data)
__________
The
Company's products and operations consist of two principal businesses that are
comprised of three operating segments each, as described under Nature of
Operations (Note 1): Memorialization Products (Bronze, Casket,
Cremation) and Brand Solutions (Graphics Imaging, Marking Products,
Merchandising Solutions). Management evaluates segment performance
based on operating profit (before income taxes) and does not allocate
non-operating items such as investment income, interest expense, other income
(deductions), net and minority interest.
The
accounting policies of the segments are the same as those described in Summary
of Significant Accounting Policies (Note 2). Intersegment sales are
accounted for at negotiated prices. Operating profit is total revenue
less operating expenses. Segment assets include those assets that are
used in the Company's operations within each segment. Assets
classified under “Other” principally consist of cash and cash equivalents,
investments, deferred income taxes and corporate headquarters'
assets. Long-lived
assets
include property, plant and equipment (net of accumulated depreciation),
goodwill, and other intangible assets (net of accumulated
amortization).
Information
about the Company's segments follows:
|
|
|
Memorialization
|
|
|
Brand
Solutions
|
|
|
|
|
|
|
|
|
|
|
|
|
|
|
|
|
|
|
|
Graphics
|
|
|
Marking
|
|
|
Merchandising
|
|
|
|
|
|
|
|
|
|
|
Bronze
|
|
|
Casket
|
|
|
Cremation
|
|
|
Imaging
|
|
|
Products
|
|
|
Solutions
|
|
|
Other
|
|
|
Consolidated
|
|
|
|
|
|
|
|
|
|
|
|
|
|
|
|
|
|
|
|
|
|
|
|
|
|
|
|
|
Sales
to external customers:
|
|
|
|
|
|
|
|
|
|
|
|
|
|
|
|
|
|
|
|
|
2009
|
|
$ |
215,934 |
|
|
$ |
203,247 |
|
|
$ |
30,909 |
|
|
$ |
234,966 |
|
|
$ |
42,355 |
|
|
$ |
53,497 |
|
|
$ |
- |
|
|
$ |
780,908 |
|
|
2008
|
|
|
243,063 |
|
|
|
219,792 |
|
|
|
26,665 |
|
|
|
203,703 |
|
|
|
60,031 |
|
|
|
65,369 |
|
|
|
- |
|
|
|
818,623 |
|
|
2007
|
|
|
229,850 |
|
|
|
210,673 |
|
|
|
25,166 |
|
|
|
146,049 |
|
|
|
57,450 |
|
|
|
80,164 |
|
|
|
- |
|
|
|
749,352 |
|
|
|
|
|
|
|
|
|
|
|
|
|
|
|
|
|
|
|
|
|
|
|
|
|
|
|
|
|
|
|
|
|
|
|
|
Intersegment
sales:
|
|
|
|
|
|
|
|
|
|
|
|
|
|
|
|
|
|
|
|
|
|
|
|
|
|
|
2009
|
|
|
192 |
|
|
|
276 |
|
|
|
4,182 |
|
|
|
64 |
|
|
|
30 |
|
|
|
34 |
|
|
|
- |
|
|
|
4,778 |
|
|
2008
|
|
|
213 |
|
|
|
542 |
|
|
|
3,883 |
|
|
|
30 |
|
|
|
32 |
|
|
|
45 |
|
|
|
- |
|
|
|
4,745 |
|
|
2007
|
|
|
208 |
|
|
|
220 |
|
|
|
2,594 |
|
|
|
13 |
|
|
|
41 |
|
|
|
41 |
|
|
|
- |
|
|
|
3,117 |
|
|
|
|
|
|
|
|
|
|
|
|
|
|
|
|
|
|
|
|
|
|
|
|
|
|
|
|
|
|
|
|
|
|
|
|
Depreciation
and amortization:
|
|
|
|
|
|
|
|
|
|
|
|
|
|
|
|
|
|
|
|
|
|
|
|
|
|
|
2009
|
|
|
4,136 |
|
|
|
7,081 |
|
|
|
251 |
|
|
|
14,677 |
|
|
|
614 |
|
|
|
2,088 |
|
|
|
1,445 |
|
|
|
30,292 |
|
|
2008
|
|
|
3,182 |
|
|
|
7,840 |
|
|
|
179 |
|
|
|
9,716 |
|
|
|
691 |
|
|
|
2,433 |
|
|
|
894 |
|
|
|
24,935 |
|
|
2007
|
|
|
3,707 |
|
|
|
6,680 |
|
|
|
164 |
|
|
|
5,431 |
|
|
|
630 |
|
|
|
2,896 |
|
|
|
1,020 |
|
|
|
20,528 |
|
|
|
|
|
|
|
|
|
|
|
|
|
|
|
|
|
|
|
|
|
|
|
|
|
|
|
|
|
|
|
|
|
|
|
|
Operating
profit:
|
|
|
|
|
|
|
|
|
|
|
|
|
|
|
|
|
|
|
|
|
|
|
|
|
|
|
2009
|
|
|
57,598 |
|
|
|
17,716 |
|
|
|
5,036 |
|
|
|
19,217 |
|
|
|
1,500 |
|
|
|
(56 |
) |
|
|
- |
|
|
|
101,011 |
|
|
2008
|
|
|
71,576 |
|
|
|
23,339 |
|
|
|
5,474 |
|
|
|
18,617 |
|
|
|
9,137 |
|
|
|
4,809 |
|
|
|
- |
|
|
|
132,952 |
|
|
2007
|
|
|
66,298 |
|
|
|
11,801 |
|
|
|
3,631 |
|
|
|
14,439 |
|
|
|
9,931 |
|
|
|
5,724 |
|
|
|
- |
|
|
|
111,824 |
|
|
|
|
|
|
|
|
|
|
|
|
|
|
|
|
|
|
|
|
|
|
|
|
|
|
|
|
|
|
|
|
|
|
|
|
Total
assets:
|
|
|
|
|
|
|
|
|
|
|
|
|
|
|
|
|
|
|
|
|
|
|
|
|
|
|
2009
|
|
|
182,194 |
|
|
|
253,012 |
|
|
|
22,541 |
|
|
|
337,407 |
|
|
|
39,569 |
|
|
|
51,492 |
|
|
|
63,438 |
|
|
|
949,653 |
|
|
2008
|
|
|
168,050 |
|
|
|
264,607 |
|
|
|
11,990 |
|
|
|
339,308 |
|
|
|
48,514 |
|
|
|
56,714 |
|
|
|
25,099 |
|
|
|
914,282 |
|
|
2007
|
|
|
158,666 |
|
|
|
280,598 |
|
|
|
11,910 |
|
|
|
180,987 |
|
|
|
42,851 |
|
|
|
59,436 |
|
|
|
36,621 |
|
|
|
771,069 |
|
|
|
|
|
|
|
|
|
|
|
|
|
|
|
|
|
|
|
|
|
|
|
|
|
|
|
|
|
|
|
|
|
|
|
|
Capital
expenditures:
|
|
|
|
|
|
|
|
|
|
|
|
|
|
|
|
|
|
|
|
|
|
|
|
|
|
|
2009
|
|
|
3,017 |
|
|
|
2,648 |
|
|
|
138 |
|
|
|
8,011 |
|
|
|
251 |
|
|
|
492 |
|
|
|
4,853 |
|
|
|
19,410 |
|
|
2008
|
|
|
1,369 |
|
|
|
1,672 |
|
|
|
130 |
|
|
|
6,158 |
|
|
|
365 |
|
|
|
489 |
|
|
|
1,870 |
|
|
|
12,053 |
|
|
2007
|
|
|
3,557 |
|
|
|
5,811 |
|
|
|
170 |
|
|
|
3,850 |
|
|
|
545 |
|
|
|
6,426 |
|
|
|
290 |
|
|
|
20,649 |
|
NOTES
TO CONSOLIDATED FINANCIAL STATEMENTS, continued
(Dollar
amounts in thousands, except per share data)
__________
|
16.
|
SEGMENT
INFORMATION, continued:
|
Information
about the Company's operations by geographic area follows:
|
|
|
United
States
|
|
|
Mexico
|
|
|
Canada
|
|
|
Europe
|
|
|
Australia
|
|
|
Asia
|
|
|
Consolidated
|
|
|
|
|
|
|
|
|
|
|
|
|
|
|
|
|
|
|
|
|
|
|
|
|
|
Sales
to external customers:
|
|
|
|
|
|
|
|
|
|
|
|
|
|
|
|
|
|
|
|
|
2009
|
|
$ |
498,782 |
|
|
$ |
- |
|
|
$ |
11,995 |
|
|
$ |
251,823 |
|
|
$ |
9,647 |
|
|
$ |
8,661 |
|
|
$ |
780,908 |
|
|
2008
|
|
|
562,991 |
|
|
|
- |
|
|
|
14,122 |
|
|
|
221,378 |
|
|
|
11,801 |
|
|
|
8,331 |
|
|
|
818,623 |
|
|
2007
|
|
|
563,594 |
|
|
|
- |
|
|
|
14,475 |
|
|
|
158,651 |
|
|
|
9,969 |
|
|
|
2,663 |
|
|
|
749,352 |
|
|
|
|
|
|
|
|
|
|
|
|
|
|
|
|
|
|
|
|
|
|
|
|
|
|
|
|
|
|
|
|
Long-lived
assets:
|
|
|
|
|
|
|
|
|
|
|
|
|
|
|
|
|
|
|
|
|
|
|
|
|
|
|
2009
|
|
|
303,342 |
|
|
|
5,685 |
|
|
|
466 |
|
|
|
256,271 |
|
|
|
3,987 |
|
|
|
8,529 |
|
|
|
578,280 |
|
|
2008
|
|
|
304,614 |
|
|
|
5,588 |
|
|
|
469 |
|
|
|
247,310 |
|
|
|
2,673 |
|
|
|
4,635 |
|
|
|
565,289 |
|
|
2007
|
|
|
312,694 |
|
|
|
6,377 |
|
|
|
504 |
|
|
|
131,786 |
|
|
|
3,066 |
|
|
|
4,103 |
|
|
|
458,530 |
|
Fiscal
2009:
Acquisition
spending, net of cash acquired, during the year ended September 30, 2009 totaled
$11.0 million. The acquisitions were not individually, or in the
aggregate, material to the Company’s consolidated financial position or results
of operations.
Fiscal
2008:
Acquisition
spending, net of cash acquired, during the year ended September 30, 2008 totaled
$98,070, and primarily included the following:
In
September 2008, the Company acquired the remaining 20% interest in S+T
Gesellschaft fur Reprotechnik GmbH (“S+T GmbH”). The Company had
acquired a 50% interest in S+T GmbH in 1998 and a 30% interest in
2005.
In May
2008, the Company acquired a 78% interest in Saueressig, a manufacturer of
gravure printing cylinders. Saueressig is headquartered in Vreden,
Germany and has its principal manufacturing operations in Germany, Poland and
the United Kingdom. The transaction was structured as a stock
purchase with a purchase price of approximately 58.1 million Euros ($90,783).
The cash portion of the transaction was funded principally through borrowings
under the Company’s existing credit facilities. The acquisition was
designed to expand Matthews products and services in the global graphics imaging
market.
In
addition, the Company entered into an option agreement related to the remaining
22% interest in Saueressig. The option agreement contains certain put
and call provisions for the purchase of the remaining 22% interest in future
years at a price to be determined by a specified formula based on future
operating results of Saueressig. The initial carrying value of
minority interest was adjusted to the estimated future purchase price
(“Redemption Value”) of the minority interest, with a corresponding charge to
retained earnings. For subsequent periods, the carrying value of minority
interest reflected on the Company’s balance sheet will be adjusted for changes
in Redemption Value, with a corresponding adjustment to retained
earnings. To the extent Redemption Value in future periods is less
than or greater than the estimated fair value of the minority interest, income
available to common shareholders in the determination of earnings per share will
increase or decrease, respectively, by such amount. However, income
available to common shareholders will only increase to the extent that a
decrease was previously recognized. In any case, net income will not
be affected by such amounts. At September 30, 2009, Redemption Value was equal
to fair value, and there was no impact on income available to common
shareholders.
NOTES
TO CONSOLIDATED FINANCIAL STATEMENTS, continued
(Dollar
amounts in thousands, except per share data)
__________
|
17.
|
ACQUISITIONS,
continued:
|
The
Company has made an assessment of the fair value in all material respects of the
assets acquired and liabilities assumed in the Saueressig
acquisition. Operating results of the acquired business have been
included in the consolidated statement of income from the acquisition date
forward.
The
following table summarizes the fair value of major assets and liabilities of
Saueressig at the date of acquisition.
|
Cash
|
|
$ |
504 |
|
|
Trade
receivables
|
|
|
22,324 |
|
|
Inventory
|
|
|
11,500 |
|
|
Other
current assets
|
|
|
1,013 |
|
|
Property,
plant and equipment
|
|
|
68,493 |
|
|
Goodwill
|
|
|
55,789 |
|
|
Intangible
assets
|
|
|
14,287 |
|
|
Other
assets
|
|
|
3,581 |
|
|
Total
assets acquired
|
|
|
177,491 |
|
|
|
|
|
|
|
|
Trade
accounts payable
|
|
|
5,016 |
|
|
Debt
|
|
|
53,714 |
|
|
Other
liabilities
|
|
|
25,458 |
|
|
Minority
interest
|
|
|
2,520 |
|
|
Total
liabilities assumed
|
|
|
86,708 |
|
|
|
|
|
|
|
|
Net
assets acquired
|
|
$ |
90,783 |
|
The
estimated fair value of the acquired intangible assets of Saueressig include
trade names with an assigned value of $1,705, customer relationships with an
assigned value of $11,584, and technology and non-compete values of
approximately $998. The intangible assets will be amortized between 2
and 20 years.
The
following unaudited pro-forma information presents a summary of the consolidated
results of Matthews combined with Saueressig as if the acquisition had occurred
on October 1, 2007:
|
|
|
2009
|
|
|
2008
|
|
|
Sales
|
|
$ |
780,908 |
|
|
$ |
901,001 |
|
|
Income
before income taxes
|
|
|
88,543 |
|
|
|
120,162 |
|
|
Net
income
|
|
|
57,732 |
|
|
|
78,353 |
|
|
Earnings
per share
|
|
|
$1.90 |
|
|
|
$2.52 |
|
These
unaudited pro forma results have been prepared for comparative purposes only and
include certain adjustments, such as interest expense on acquisition
debt. The pro forma information does not purport to be indicative of
the results of operations which actually would have resulted had the acquisition
occurred on the date indicated, or which may result in the
future.
NOTES
TO CONSOLIDATED FINANCIAL STATEMENTS, continued
(Dollar
amounts in thousands, except per share data)
__________
|
17.
|
ACQUISITIONS,
continued:
|
Fiscal
2007:
Acquisition
spending, net of cash acquired, during the year ended September 30, 2007 totaled
$23,784, and primarily included the following:
In July
2007, York reached a settlement agreement with Yorktowne Caskets, Inc. and its
shareholders (collectively “Yorktowne”) with respect to all outstanding
litigation between the parties. In exchange for the mutual release,
the principal terms of the settlement included the assignment by Yorktowne of
certain customer and employment-related contracts to York and the purchase by
York of certain assets, including York-product inventory, of
Yorktowne.
In June
2007, the Company acquired a 60% interest in Beijing Kenuohua Electronic
Technology Co., Ltd., (“Kenuohua”), an ink-jet equipment manufacturer,
headquartered in Beijing, China. The acquisition was structured as a
stock purchase. The acquisition was intended to expand Matthews’
marking products manufacturing and distribution capabilities in
Asia.
In
December 2006, the Company paid additional purchase consideration of $7,000
under the terms of the Milso Industries (“Milso”) acquisition
agreement.
Matthews
has accounted for these acquisitions using the purchase method and, accordingly,
recorded the acquired assets and liabilities at their estimated fair values at
the acquisition dates. The excess of the purchase price over the
estimated fair value of the net assets acquired was recorded as
goodwill.
18. DISPOSITION:
In August
2007, the Company sold its marketing consultancy business. The transaction
resulted in a pre-tax gain of $1,322, which was recorded as a reduction in
administrative expenses in the Consolidated Statement of Income.
|
19.
|
GOODWILL
AND OTHER INTANGIBLE ASSETS:
|
Goodwill
is not amortized but is subject to annual review for impairment. In general,
when the carrying value of a reporting unit exceeds its implied fair value, an
impairment loss must be recognized. For purposes of testing for impairment the
Company uses a combination of valuation techniques, including discounted cash
flows. Intangible assets are amortized over their estimated useful lives unless
such lives are considered to be indefinite. A significant decline in cash flows
generated from these assets may result in a write-down of the carrying values of
the related assets.
NOTES
TO CONSOLIDATED FINANCIAL STATEMENTS, continued
(Dollar
amounts in thousands, except per share data)
__________
|
19.
|
GOODWILL
AND OTHER INTANGIBLE ASSETS,
continued:
|
The
Company performed its annual impairment reviews in the second quarters of fiscal
2009 and fiscal 2008 and determined that no adjustments to the carrying values
of goodwill or other indefinite lived intangibles were
necessary. Changes to goodwill, net of accumulated amortization,
during the years ended September 30, 2009 and 2008, follow.
|
|
|
|
|
|
|
|
|
|
|
|
Graphics
|
|
|
Marking
|
|
|
Merchandising
|
|
|
|
|
|
|
|
Bronze
|
|
|
Casket
|
|
|
Cremation
|
|
|
Imaging
|
|
|
Products
|
|
|
Solutions
|
|
|
Consolidated
|
|
|
|
|
|
|
|
|
|
|
|
|
|
|
|
|
|
|
|
|
|
|
|
|
|
Balance
at
September 30, 2007
|
|
$ |
77,375 |
|
|
$ |
120,555 |
|
|
$ |
6,536 |
|
|
$ |
95,632 |
|
|
$ |
9,062 |
|
|
$ |
9,138 |
|
|
$ |
318,298 |
|
|
Additions
|
|
|
- |
|
|
|
882 |
|
|
|
- |
|
|
|
41,865 |
|
|
|
151 |
|
|
|
- |
|
|
|
42,898 |
|
|
Dispositions
|
|
|
- |
|
|
|
- |
|
|
|
- |
|
|
|
(160 |
) |
|
|
- |
|
|
|
- |
|
|
|
(160 |
) |
|
Translation
and adjustments
|
|
|
(588 |
) |
|
|
- |
|
|
|
- |
|
|
|
(1,183 |
) |
|
|
376 |
|
|
|
- |
|
|
|
(1,395 |
) |
|
Balance
at September 30, 2008
|
|
|
76,787 |
|
|
|
121,437 |
|
|
|
6,536 |
|
|
|
136,154 |
|
|
|
9,589 |
|
|
|
9,138 |
|
|
|
359,641 |
|
|
Additions
|
|
|
1,266 |
|
|
|
1,459 |
|
|
|
2,041 |
|
|
|
17,685 |
|
|
|
379 |
|
|
|
- |
|
|
|
22,830 |
|
|
Translation
and adjustments
|
|
|
1,242 |
|
|
|
- |
|
|
|
310 |
|
|
|
1,184 |
|
|
|
12 |
|
|
|
- |
|
|
|
2,748 |
|
|
Balance
at
September 30, 2009
|
|
$ |
79,295 |
|
|
$ |
122,896 |
|
|
$ |
8,887 |
|
|
$ |
155,023 |
|
|
$ |
9,980 |
|
|
$ |
9,138 |
|
|
$ |
385,219 |
|
In 2009,
the addition to Bronze goodwill reflects the acquisition of a small bronze
manufacturer in Europe; the addition to Casket goodwill reflects the acquisition
of a small casket distributor in the United States; the addition to Cremation
goodwill reflects the acquisition of a small cremation equipment manufacturer in
Europe; the addition to Graphics Imaging goodwill principally represents the
effect of final adjustments to the allocation of purchase price for the
Saueressig acquisition; and the addition to Marking Products goodwill reflects
the acquisition of a small distributor in Europe.
In 2008,
the addition to Graphics Imaging relates to the purchase of a 78% interest in
Saueressig which is expected to be deductible for tax purposes, and the
remaining 20% interest in S+T GmbH. The additions to Casket goodwill during
fiscal 2008 related primarily to additional consideration paid in accordance
with the purchase agreement with Royal Casket Company.
NOTES
TO CONSOLIDATED FINANCIAL STATEMENTS, continued
(Dollar
amounts in thousands, except per share data)
__________
19. GOODWILL
AND OTHER INTANGIBLE ASSETS, continued:
The
following tables summarize the carrying amounts and related accumulated
amortization for intangible assets as of September 30, 2009 and 2008,
respectively.
|
|
|
Carrying
|
|
|
Accumulated
|
|
|
|
|
|
|
|
Amount
|
|
|
Amortization
|
|
|
Net
|
|
|
September
30, 2009:
|
|
|
|
|
|
|
|
|
|
|
Trade
names
|
|
$ |
24,418 |
|
|
$ |
- |
* |
|
$ |
24,418 |
|
|
Trade
names
|
|
|
1,598 |
|
|
|
(458 |
) |
|
|
1,140 |
|
|
Customer
relationships
|
|
|
35,568 |
|
|
|
(8,232 |
) |
|
|
27,336 |
|
|
Copyrights/patents/other
|
|
|
7,777 |
|
|
|
(5,670 |
) |
|
|
2,107 |
|
|
|
|
$ |
69,361 |
|
|
$ |
(14,360 |
) |
|
$ |
55,001 |
|
|
|
|
|
|
|
|
|
|
|
|
|
|
|
|
September
30, 2008:
|
|
|
|
|
|
|
|
|
|
|
|
|
|
Trade
names
|
|
$ |
25,109 |
|
|
$ |
- |
* |
|
$ |
25,109 |
|
|
Trade
names
|
|
|
2,822 |
|
|
|
(145 |
) |
|
|
2,677 |
|
|
Customer
relationships
|
|
|
34,477 |
|
|
|
(5,720 |
) |
|
|
28,757 |
|
|
Copyrights/patents/other
|
|
|
7,885 |
|
|
|
(4,518 |
) |
|
|
3,367 |
|
|
|
|
$ |
70,293 |
|
|
$ |
(10,383 |
) |
|
$ |
59,910 |
|
|
*
Not subject to
amortization
|
|
|
|
|
|
|
|
|
|
|
|
|
The
increase in intangible assets during fiscal 2009 was due to the addition of
intellectual property in the Bronze and Marking Products segments, and the
impact of fluctuations in foreign currency exchange rates on intangible assets
denominated in foreign currencies, offset by additional amortization. The
increase in intangible assets during fiscal 2008 was due to the acquisition of
Saueressig.
Amortization
expense on intangible assets was $4,310, $3,536, and $2,129 in fiscal 2009, 2008
and 2007, respectively. Fiscal year amortization expense is
estimated to be $3,227 in 2010, $2,888 in 2011, $2,473 in 2012, $2,203 in 2013,
and $2,035 in 2014.
|
20.
|
ACCOUNTING
PRONOUNCEMENTS:
|
On
September 30, 2009, the Company adopted changes issued by the FASB to the
authoritative hierarchy of generally accepted accounting principles
(“GAAP”). These changes establish the FASB Accounting Standards
CodificationTM
(“Codification”) as the source of authoritative accounting principles recognized
by the FASB to be used in the preparation of financial statements of
nongovernmental entities that are presented in conformity with GAAP in the U.S.
The Codification is effective for financial statements issued for interim and
annual periods ending after September 15, 2009. The adoption had no
material impact on the Company’s consolidated results of operations or financial
condition.
The
Company adopted changes issued by the FASB regarding accounting for income tax
benefits of dividends on share-based payment awards on October 1,
2008. The changes require that tax benefits generated by dividends on
equity classified non-vested equity shares, non-vested equity share units, and
outstanding equity share options be classified as additional paid-in capital and
included in a pool of excess tax benefits available to absorb tax deficiencies
from share-based payment awards. The adoption had no material impact
on the Company’s consolidated results of operations or financial
condition.
NOTES
TO CONSOLIDATED FINANCIAL STATEMENTS, continued
(Dollar
amounts in thousands, except per share data)
__________
20. ACCOUNTING
PRONOUNCEMENTS, continued:
In
December 2007, the FASB issued new guidance regarding business
combinations. This guidance requires recognition and measurement of
the identifiable assets acquired, the liabilities assumed, and any
noncontrolling interest in a business combination, goodwill acquired or a gain
from a bargain purchase. It is effective for fiscal years beginning
on or after December 15, 2008 and is to be applied
prospectively. Earlier adoption is not permitted. The
Company is currently evaluating the impact of the adoption of this
guidance.
In
December 2007, the FASB issued new guidance regarding noncontrolling interests
in consolidated financial statements. This guidance establishes
accounting and reporting standards for the noncontrolling interest in a
subsidiary. It requires that consolidated net income reflect the amounts
attributable to both the parent and the noncontrolling interest, and also
includes additional disclosure requirements. It is effective for fiscal years
beginning on or after December 15, 2008 and is to be applied prospectively as of
the beginning of the fiscal year in which the guidance is initially applied,
except for the presentation and disclosure requirements which shall be applied
retrospectively for all periods presented. Earlier adoption is not
permitted. The Company is currently evaluating the impact of the
adoption of this guidance.
In
December 2008, the FASB issued changes to employers’ disclosures about
postretirement benefit plan assets. These changes require enhanced disclosures
regarding assets in defined benefit pension or other postretirement
plans. It is effective for fiscal years ending after December 31,
2009. Earlier application is permitted. The Company is currently
evaluating the impact of the adoption of these changes.
In April
2009, the FASB issued changes to require disclosures about fair value of
financial instruments for interim reporting periods of publicly traded companies
as well as in annual financial statements. It also requires those disclosures in
summarized financial information at interim reporting periods. These changes are
effective for interim reporting periods ending after June 15, 2009 and were
adopted by the Company as of June 30, 2009. See Notes 3 and
7.
Effective
September 30, 2007, the Company adopted the recognition and related disclosure
provisions of guidance on employers’ accounting for defined benefit pension and
other postretirement plans which amended earlier guidance. In the
first quarter of fiscal 2009, the Company adopted the provision requiring the
Company to measure the plan assets and benefit obligations of defined benefit
postretirement plans as of the date of its year-end balance
sheet. Adoption of this provision did not have a material effect on
the Company’s consolidated results of operations or financial condition. See
Note 11.
In May
2009, the FASB issued new guidance regarding subsequent events. The
guidance establishes general standards of accounting for and disclosure of
events that occur after the balance sheet date but before financial statements
are issued or are available to be issued. The Statement is effective
for interim or annual financial periods ending after June 15,
2009. Accordingly, the Company adopted these changes as of June 30,
2009. The adoption had no material impact on the Company’s
consolidated results of operations or financial condition. See Note
21.
In June
2008, the FASB issued guidance regarding instruments granted in share-based
payments. The guidance requires unvested share-based payment awards
that contain non-forfeitable rights to dividends or dividend equivalents
(whether paid or unpaid) to be considered participating securities and therefore
included in the computation of earnings per share pursuant to the two-class
method. This guidance is effective for years beginning after December
31, 2008. The Company is currently evaluating the impact of the
adoption of these changes.
21. SUBSEQUENT
EVENTS:
The
Company evaluated subsequent events for recognition and disclosure through
November 23, 2009. The evaluation resulted in no impact to the
consolidated financial statements.
SUPPLEMENTARY
FINANCIAL INFORMATION
Selected
Quarterly Financial Data (Unaudited):
The
following table sets forth certain items included in the Company's unaudited
consolidated financial statements for each quarter of fiscal 2009 and fiscal
2008.
|
|
|
|
|
|
|
|
|
|
|
Quarter
Ended
|
|
|
|
|
|
|
|
December
31
|
|
|
March
31
|
|
|
June
30
|
|
|
September
30
|
|
|
Year
Ended
September
30
|
|
|
|
|
(Dollar
amounts in thousands, except per share data)
|
|
|
|
|
|
FISCAL
YEAR 2009:
|
|
|
|
|
|
|
|
|
|
|
|
|
|
|
|
|
|
|
|
|
|
|
|
|
|
|
|
|
|
|
|
|
|
Sales
|
|
$ |
191,286 |
|
|
$ |
197,362 |
|
|
$ |
192,047 |
|
|
$ |
200,213 |
|
|
$ |
780,908 |
|
|
|
|
|
|
|
|
|
|
|
|
|
|
|
|
|
|
|
|
|
|
|
|
Gross
profit
|
|
|
67,852 |
|
|
|
73,117 |
|
|
|
75,466 |
|
|
|
78,342 |
|
|
|
294,777 |
|
|
|
|
|
|
|
|
|
|
|
|
|
|
|
|
|
|
|
|
|
|
|
|
Operating
profit
|
|
|
20,079 |
|
|
|
23,439 |
|
|
|
29,810 |
|
|
|
27,683 |
|
|
|
101,011 |
|
|
|
|
|
|
|
|
|
|
|
|
|
|
|
|
|
|
|
|
|
|
|
|
Net
income
|
|
|
11,289 |
|
|
|
12,742 |
|
|
|
18,068 |
|
|
|
15,633 |
|
|
|
57,732 |
|
|
|
|
|
|
|
|
|
|
|
|
|
|
|
|
|
|
|
|
|
|
|
|
Earnings
per share
|
|
|
$.37 |
|
|
|
$.42 |
|
|
|
$.60 |
|
|
|
$.52 |
|
|
|
$1.90 |
|
|
|
|
|
|
|
|
|
|
|
|
|
|
|
|
|
|
|
|
|
|
|
|
|
|
|
|
|
|
|
|
|
|
|
|
|
|
|
|
|
|
|
|
|
|
FISCAL
YEAR 2008:
|
|
|
|
|
|
|
|
|
|
|
|
|
|
|
|
|
|
|
|
|
|
|
|
|
|
|
|
|
|
|
|
|
|
|
|
|
|
|
|
|
|
|
|
Sales
|
|
$ |
182,348 |
|
|
$ |
197,827 |
|
|
$ |
219,270 |
|
|
$ |
219,178 |
|
|
$ |
818,623 |
|
|
|
|
|
|
|
|
|
|
|
|
|
|
|
|
|
|
|
|
|
|
|
|
Gross
profit
|
|
|
71,988 |
|
|
|
80,234 |
|
|
|
86,919 |
|
|
|
83,823 |
|
|
|
322,964 |
|
|
|
|
|
|
|
|
|
|
|
|
|
|
|
|
|
|
|
|
|
|
|
|
Operating
profit
|
|
|
26,778 |
|
|
|
34,392 |
|
|
|
36,734 |
|
|
|
35,048 |
|
|
|
132,952 |
|
|
|
|
|
|
|
|
|
|
|
|
|
|
|
|
|
|
|
|
|
|
|
|
Net
income
|
|
|
17,431 |
|
|
|
20,283 |
|
|
|
21,378 |
|
|
|
20,392 |
|
|
|
79,484 |
|
|
|
|
|
|
|
|
|
|
|
|
|
|
|
|
|
|
|
|
|
|
|
|
Earnings
per share
|
|
|
$.56 |
|
|
|
$.65 |
|
|
|
$.69 |
|
|
|
$.66 |
|
|
|
$2.55 |
|
|
|
|
|
|
|
|
|
|
|
|
|
|
|
|
|
|
|
|
|
|
|
|
|
|
|
|
|
|
|
|
|
|
|
|
|
|
|
|
|
|
|
|
|
FINANCIAL
STATEMENT SCHEDULE
SCHEDULE
II - VALUATION AND QUALIFYING ACCOUNTS
|
|
|
|
|
|
Additions
|
|
|
|
|
|
|
|
|
|
|
Balance
at
|
|
|
|
|
|
Charged
to
|
|
|
|
|
|
|
|
|
|
|
beginning
of
|
|
|
Charged
to
|
|
|
other
|
|
|
|
|
|
Balance
at
|
|
|
Description
|
|
period
|
|
|
expense
|
|
|
Accounts(1)
|
|
|
Deductions(2)
|
|
|
end
of period
|
|
|
|
|
(Dollar
amounts in thousands)
|
|
|
|
|
|
Allowance
for Doubtful Accounts:
|
|
|
|
|
|
|
|
|
|
|
|
|
|
|
|
|
Fiscal
Year Ended:
|
|
|
|
|
|
|
|
|
|
|
|
|
|
|
|
|
September
30, 2009
|
|
$ |
11,538 |
|
|
$ |
4,320 |
|
|
$ |
- |
|
|
$ |
(3,228 |
) |
|
$ |
12,630 |
|
|
September
30, 2008
|
|
|
11,160 |
|
|
|
1,712 |
|
|
|
885 |
|
|
|
(2,219 |
) |
|
|
11,538 |
|
|
September
30, 2007
|
|
|
10,829 |
|
|
|
335 |
|
|
|
209 |
|
|
|
(213 |
) |
|
|
11,160 |
|
|
(1)
|
Amount
comprised principally of acquisitions and purchase accounting adjustments
in connection with acquisitions.
|
|
(2)
|
Amounts
determined not to be collectible (including direct write-offs), net of
recoveries.
|
ITEM 9. CHANGES IN AND DISAGREEMENTS WITH ACCOUNTANTS
ON ACCOUNTING AND FINANCIAL DISCLOSURE.
There
have been no changes in accountants or disagreements on accounting or financial
disclosure between the Company and PricewaterhouseCoopers LLP, Independent
Registered Public Accounting Firm, for the fiscal years ended September 30,
2009, 2008 and 2007.
ITEM
9A. CONTROLS AND PROCEDURES.
|
|
(a)
Evaluation of Disclosure Controls and
Procedures.
|
The
Company’s disclosure controls and procedures (as defined in Rules 13a-15(e) and
15d-15(e) under the Securities Exchange Act of 1934, as amended) are designed to
provide reasonable assurance that information required to be disclosed in the
Company’s reports filed under that Act (the “Exchange Act”), such as
this Annual Report on Form 10-K, is recorded, processed, summarized and reported
within the time periods specified in the rules of the Securities and Exchange
Commission. These disclosure controls and procedures also are designed to
provide reasonable assurance that such information is accumulated and
communicated to management, including the Chief Executive Officer and Chief
Financial Officer, to allow timely decisions regarding required
disclosures.
Management,
under the supervision and with the participation of our Chief Executive Officer
and the Chief Financial Officer, evaluated the effectiveness of the Company’s
disclosure controls and procedures in effect as of September 30, 2009. Based on
that evaluation, the Chief Executive Officer and Chief Financial Officer
concluded that, as of September 30, 2009, the Company’s disclosure controls and
procedures were effective to provide reasonable assurance that material
information is accumulated and communicated to management, including the Chief
Executive Officer and Chief Financial Officer, and that such information is
recorded, processed, summarized and properly reported within the appropriate
time period, relating to the Company and its consolidated subsidiaries, required
to be included in the Exchange Act reports, including this Annual Report on Form
10-K.
(b)
Management’s Report on Internal Control over Financial Reporting.
Management’s
Report on Internal Control over Financial Reporting is included in Management’s
Report to Shareholders in Item 8 of this Annual Report on Form
10-K.
(c)
Attestation Report of the Registered Public Accounting Firm.
The
Company’s internal control over financial reporting as of September 30, 2009 has
been audited by PricewaterhouseCoopers LLP, an independent registered public
accounting firm, as stated in their report which is included in Item 8 of this
Annual Report on
Form
10-K.
(d)
Changes in Internal Control over Financial Reporting.
There
have been no changes in the Company’s internal controls over financial reporting
that occurred during the fourth fiscal quarter ended September 30, 2009 that
have materially affected, or are reasonably likely to materially affect, the
Company’s internal controls over financial reporting.
PART
III
ITEM 10. DIRECTORS, OFFICERS and EXECUTIVE MANAGEMENT
OF THE REGISTRANT.
In
addition to the information reported in Part I of this Form 10-K, under the
caption “Officers and Executive Management of the Registrant”, the information
required by this item as to the directors of the Company is hereby incorporated
by reference from the information appearing under the captions “General
Information Regarding Corporate Governance – Audit Committee”, “Proposal No. 1 –
Elections of Directors” and “Compliance with Section 16(a) of the Exchange Act”
in the Company’s definitive proxy statement, which involves the election of the
directors and is to be filed with the Securities and Exchange Commission
pursuant to the Exchange Act of 1934, as amended, within 120 days of the end of
the Company’s fiscal year ended September 30, 2009.
The
Company’s Code of Ethics Applicable to Executive Management is set forth in
Exhibit 14.1 hereto.
ITEM
11. EXECUTIVE COMPENSATION.
The
information required by this item as to the compensation of directors and
executive management of the Company is hereby incorporated by reference from the
information appearing under the captions “Compensation of Directors” and
“Executive Compensation and Retirement Benefits” in the Company’s definitive
proxy statement which involves the election of directors and is to be filed with
the Commission pursuant to the Exchange Act, within 120 days of the end of the
Company’s fiscal year ended September 30, 2009. The information
contained in the “Compensation Committee Report” is specifically not
incorporated herein by reference.
ITEM 12. SECURITY OWNERSHIP OF CERTAIN BENEFICIAL
OWNERS AND MANAGEMENT.
The
information required by this item as to the ownership by management and others
of securities of the Company is hereby incorporated by reference from the
information appearing under the caption “Stock Ownership” in the Company’s
definitive proxy statement which involves the election of directors and is to be
filed with the Commission pursuant to the Exchange Act, within 120 days of the
end of the Company’s fiscal year ended September 30, 2009.
Equity
Compensation Plans:
The
Company maintains a stock incentive plan (the “1992 Incentive Stock Plan”) that
provided for grants of stock options, restricted shares and certain other types
of stock-based awards. In February 2008, the Company’s shareholders
approved the adoption of a new plan, the 2007 Equity Incentive Plan (the “2007
Plan”), that provides for the grants of stock options, restricted shares,
stock-based performance units and certain other types of stock-based awards.
Under the 2007 Plan, which has a ten-year term, the maximum number of shares
available for grants or awards is an aggregate of 2,200,000. There
will be no further grants under the 1992 Incentive Stock Plan. At
September 30, 2009, there were 1,878,010 shares reserved for future issuance
under the 2007 Plan. Both plans are administered by the Compensation Committee
of the Board of Directors.
The
option price for each stock option granted under either plan may not be less
than the fair market value of the Company's common stock on the date of
grant. Outstanding stock options are generally exercisable in
one-third increments upon the attainment of 10%, 33% and 60% appreciation in the
market value of the Company’s Class A Common Stock. In addition,
options generally vest in one-third increments after three, four and five years,
respectively, from the grant date (but, in any event, not until the attainment
of the market value thresholds). The options expire on the earlier of
ten years from the date of grant, upon employment termination, or within
specified time limits following voluntary employment termination (with the
consent of the Company), retirement or death. The Company generally
settles employee stock option exercises with treasury shares. With
respect
ITEM
12. SECURITY OWNERSHIP OF
CERTAIN BENEFICIAL OWNERS AND MANAGEMENT, continued
to
outstanding restricted share grants, generally one-half of the shares vest on
the third anniversary of the grant. The remaining one-half of the
shares vest in one-third increments upon attainment of 10%, 25% and 40%
appreciation in the market value of the Company’s Class A Common
Stock. Unvested restricted shares generally expire on the earlier of
five years from the date of grant, upon employment termination, or within
specified time limits following voluntary employment termination (with the
consent of the Company), retirement or death. The Company issues
restricted shares from treasury shares.
Under the
Company’s Director Fee Plan, directors (except for the Chairman of the Board)
who are not also officers of the Company each receive, as an annual retainer
fee, either cash or shares of the Company's Class A Common Stock equivalent to
$60,000. The equivalent amount paid to a non-employee Chairman of the Board is
$130,000. Where the annual retainer fee is provided in shares, each director may
elect to be paid these shares on a current basis or have such shares credited to
a deferred stock account as phantom stock, with such shares to be paid to the
director subsequent to leaving the Board. The value of deferred shares is
recorded in other liabilities. A total of 25,013 shares had been
deferred under the Director Fee Plan at September 30,
2009. Additionally, directors who are not also officers of the
Company each receive an annual stock-based grant (non-statutory stock options,
stock appreciation rights and/or restricted shares) with a value of
$70,000. A total of 22,300 stock options have been granted under the
plan. At September 30, 2009, 17,800 options were outstanding and
vested. Additionally, 37,210 shares of restricted stock have been granted under
the plan, 22,810 of which were unvested at September 30, 2009. A
total of 300,000 shares have been authorized to be issued under the Director Fee
Plan.
The
following table provides information about grants under the Company's equity
compensation plans as of September 30, 2009:
|
|
|
Equity
Compensation Plan Information
|
|
|
|
|
|
|
|
|
|
|
|
|
|
Number
of securities
|
|
|
|
|
|
|
|
|
|
|
remaining
available
|
|
|
|
|
|
|
|
|
|
|
for
future issuance
|
|
|
|
|
Number
of securities
|
|
|
Weighted-average
|
|
|
under
equity
compensation
|
|
|
|
|
to
be issued upon
|
|
|
exercise
price
|
|
|
plans
|
|
|
|
|
exercise
of
|
|
|
of
outstanding
|
|
|
(excluding
|
|
|
|
|
outstanding
options,
|
|
|
options,
warrants
|
|
|
securities
reflected
|
|
|
Plan
category
|
|
warrants
and rights
|
|
|
and
rights
|
|
|
in
column (a))
|
|
|
|
|
(a)
|
|
|
(b)
|
|
|
(c)
|
|
|
Equity
compensation plans
|
|
|
|
|
|
|
|
|
|
|
approved
by security holders:
|
|
|
|
|
|
|
|
|
|
|
1992
Stock Incentive Plan
|
|
|
1,224,909 |
|
|
$ |
35.94 |
|
|
|
- |
(1) |
|
2007
Equity Incentive Plan
|
|
|
- |
|
|
|
- |
|
|
|
1,878,010 |
(2) |
|
Employee
Stock Purchase Plan
|
|
|
- |
|
|
|
- |
|
|
|
1,694,672 |
(3) |
|
Director
Fee Plan
|
|
|
42,813 |
|
|
|
35.13 |
|
|
|
155,077 |
(4) |
|
Equity
compensation plans not approved by security holders
|
|
None
|
|
|
None
|
|
|
None
|
|
|
Total
|
|
|
1,267,722 |
|
|
$ |
35.93 |
|
|
|
3,727,759 |
|
|
|
(1)
|
As
a result of the approval of the 2007 Equity Incentive Plan, no further
grants or awards will be made under the 1992 Incentive Stock
Plan.
|
|
|
(2)
|
The
2007 Equity Incentive Plan was approved in February 2008. The
Plan provides for the grant or award of stock options, restricted shares,
stock-based performance units and certain other types of stock based
awards, with a maximum of 2,200,000 shares available for grants or
awards.
|
|
|
(3)
|
Shares
under the Employee Stock Purchase Plan (the “Plan”) are purchased in the
open market by employees at the fair market value of the Company’s
stock. The Company provides a matching contribution of 10% of
such purchases subject to certain limitations under the
Plan. As the Plan is an open market purchase plan, it does not
have a dilutive effect.
|
|
|
(4)
|
Shares
of restricted stock may be issued under the Director Fee
Plan. The maximum number of shares authorized to be issued
under the Director Fee Plan is 300,000
shares.
|
ITEM
13. CERTAIN RELATIONSHIPS AND RELATED TRANSACTIONS.
The
information required by this item as to certain relationships and transactions
with management and other related parties of the Company is hereby incorporated
by reference from the information appearing under the captions “Proposal No. 1 –
Election of Directors” and “Certain Transactions” in the Company’s definitive
proxy statement, which involves the election of directors and is to be filed
with the Commission pursuant to the Exchange Act, within 120 days of the end of
the Company’s fiscal year ended September 30, 2009.
ITEM
14. PRINCIPAL ACCOUNTING FEES AND SERVICES.
The
information required by this item as to the fees billed and the services
provided by the principal accounting firm of the Company is hereby incorporated
by reference from the information appearing under the caption “Relationship with
Independent Registered Public Accounting Firm” in the Company’s definitive proxy
statement, which involves the election of directors and is to be filed with the
Commission pursuant to the Exchange Act within 120 days of the end of
the Company’s fiscal year ended September 30, 2009.
PART
IV
ITEM
15. EXHIBITS, FINANCIAL STATEMENT SCHEDULES, AND REPORTS ON FORM
8-K.
(a)
1. Financial Statements:
The
following items are included in Part II, Item 8:
|
|
Pages
|
|
Management’s
Report to Shareholders
|
34
|
|
|
|
|
Report
of Independent Registered Public Accounting Firm
|
35
|
|
|
|
|
Consolidated
Balance Sheets as of September 30, 2009 and 2008
|
36-37
|
|
|
|
|
Consolidated
Statements of Income for the years ended September 30, 2009, 2008 and
2007
|
38
|
|
|
|
|
Consolidated
Statements of Shareholders' Equity for the years ended September 30, 2009,
2008 and 2007
|
39
|
|
|
|
|
Consolidated
Statements of Cash Flows for the years ended September 30, 2009, 2008 and
2007
|
40
|
|
|
|
|
Notes
to Consolidated Financial Statements
|
41-65
|
|
|
|
|
Supplementary
Financial Information (unaudited)
|
66
|
|
2.
|
Financial
Statement Schedules:
|
Schedule
II - Valuation and Qualifying Accounts is included on page 67 in Part II, Item 8
of this Annual Report on Form 10-K.
The index
to exhibits is on pages 74-76.
|
|
On
July 24, 2009, Matthews filed a current report on Form 8-K under Item 2 in
connection with a press release announcing
its
|
|
|
earnings
for the third fiscal quarter of
2009.
|
SIGNATURES
Pursuant
to the requirements of Section 13 or 15(d) of the Securities Exchange Act of
1934, the Registrant has duly caused this report to be signed on its behalf by
the undersigned, thereunto duly authorized, on November 24, 2009.
|
|
|
MATTHEWS
INTERNATIONAL CORPORATION
|
|
|
|
(Registrant)
|
|
|
|
|
|
|
|
|
|
|
By
|
/s/Joseph
C. Bartolacci
|
|
|
|
Joseph
C. Bartolacci
|
|
|
|
President
and Chief Executive Officer
|
|
|
|
|
Pursuant
to the requirements of the Securities Exchange Act of 1934, this report has been
signed below by the following persons on behalf of the Registrant and in the
capacities indicated on November 24, 2009:
|
/s/Joseph
C. Bartolacci
|
|
/s/Steven
F. Nicola
|
|
Joseph
C. Bartolacci
|
|
Steven
F. Nicola
|
|
President
and Chief Executive Officer
|
|
Chief
Financial Officer, Secretary
|
|
(Principal
Executive Officer)
|
|
and
Treasurer (Principal Financial
|
|
|
|
and
Accounting Officer)
|
|
|
|
|
|
|
|
|
|
|
|
|
|
/s/William
J. Stallkamp
|
|
/s/Robert
G. Neubert
|
|
William
J. Stallkamp, Chairman of the Board
|
|
Robert
G. Neubert, Director
|
|
|
|
|
|
|
|
|
|
|
|
|
|
/s/
Katherine E. Dietze
|
|
/s/John
P. O'Leary, Jr.
|
|
Katherine
E. Dietze, Director
|
|
John
P. O'Leary, Jr., Director
|
|
|
|
|
|
|
|
|
|
|
|
|
|
/s/
Alvaro Garcia-Tunon
|
|
/s/Martin
Schlatter
|
|
Alvaro
Garcia-Tunon, Director
|
|
Martin
Schlatter, Director
|
|
|
|
|
|
|
|
|
|
|
|
|
|
/s/Glenn
R. Mahone
|
|
/s/John
D. Turner
|
|
Glenn
R. Mahone, Director
|
|
John
D. Turner, Director
|
MATTHEWS
INTERNATIONAL CORPORATION AND SUBSIDIARIES
EXHIBITS
INDEX
__________
The
following Exhibits to this report are filed herewith or, if marked with an
asterisk (*), are incorporated by reference. Exhibits marked with an
"a" represent a management contract or compensatory plan, contract or
arrangement required to be filed by Item 601(b)(10)(iii) of Regulation
S-K.
|
Exhibit
No.
|
|
Description
|
|
Prior
Filing or Sequential Page Numbers Herein
|
|
|
|
|
|
|
|
3.1
|
|
Restated
Articles of Incorporation *
|
|
Exhibit
Number 3.1 to Form 10-K
for
the year ended September 30, 1994
|
|
|
|
|
|
|
|
3.2
|
|
Restated
By-laws *
|
|
Exhibit
Number 99.1 to Form 8-K
dated
October 18, 2007
|
|
|
|
|
|
|
|
4.1
a
|
|
Form
of Revised Option Agreement of Repurchase (effective October 1, 1993)
*
|
|
Exhibit
Number 4.5 to Form 10-K
for
the year ended September 30, 1993
|
|
|
|
|
|
|
|
4.2
|
|
Form
of Share Certificate for Class A Common Stock *
|
|
Exhibit
Number 4.9 to Form 10-K
for
the year ended September 30, 1994
|
|
|
|
|
|
|
|
10.1
|
|
Revolving
Credit Facility *
|
|
Exhibit
Number 10.1 to Form 10-K
for
the year ended September 30, 2001
|
|
|
|
|
|
|
|
10.2
|
|
First
Amendment to Revolving Credit Facility*
|
|
Exhibit
Number 10.1 to Form 10-Q
for
the quarter ended March 31, 2004
|
|
|
|
|
|
|
|
10.3
|
|
Second
Amendment to Revolving Credit Facility *
|
|
Exhibit
Number 10.1 to Form 10-Q
for
the quarter ended December 31, 2004
|
|
|
|
|
|
|
|
10.4
|
|
Third
Amendment to Revolving Credit Facility*
|
|
Exhibit
Number 10.4 to Form 10-K
for
the year ended September 30, 2007
|
|
|
|
|
|
|
|
10.5
a
|
|
Supplemental
Retirement Plan*
|
|
Exhibit
Number 10.4 to Form 10-K
for
the year ended September 30, 2006
|
|
|
|
|
|
|
|
10.6
a
|
|
Officers
Retirement Restoration Plan (effective April 23, 2009)
|
|
Filed
Herewith
|
|
|
|
|
|
|
|
10.7
a
|
|
1992
Stock Incentive Plan (as amended through April 25, 2006) *
|
|
Exhibit
Number 10.1 to Form 10-Q
for
the quarter ended March 31, 2006
|
|
|
|
|
|
|
|
Exhibit
No.
|
|
Description
|
|
Prior
Filing or Sequential Page Numbers Herein
|
|
|
|
|
|
|
|
10.8
a
|
|
Form
of Stock Option Agreement*
|
|
Exhibit
Number 10.7 to Form 10-K
for
the year ended September 30, 2008
|
|
|
|
|
|
|
|
10.9
a
|
|
Form
of Restricted Stock Agreement*
|
|
Exhibit
Number 10.8 to Form 10-K
for
the year ended September 30, 2008
|
|
|
|
|
|
|
|
10.10
a
|
|
1994
Director Fee Plan (as amended through
November
13, 2008)*
|
|
Exhibit
Number 10.9 to Form 10-K
for
the year ended September 30, 2008
|
|
|
|
|
|
|
|
10.11
a
|
|
1994
Employee Stock Purchase Plan *
|
|
Exhibit
Number 10.2 to Form 10-Q
for
the quarter ended March 31, 1995
|
|
|
|
|
|
|
|
10.12
a
|
|
2007
Equity Incentive Plan (as amended through September 26,
2008)*
|
|
Exhibit
Number 10.11 to Form 10-K
for
the year ended September 30, 2008
|
|
|
|
|
|
|
|
10.13
|
|
Asset
Purchase Agreement by and among The York Group, Inc., Midnight Acquisition
Corporation, Milso Industries, Inc., Milso Industries, LLC, SBC Holding
Corporation, the Shareholders identified therein and Matthews
International Corporation*
|
|
Exhibit
Number 10.1 to Form 8-K
dated
on July 14, 2005
|
|
|
|
|
|
|
|
10.14
|
|
Sale
and Purchase Agreement by and among Mr. Jorg Christian Saueressig, Mr.
Karl Wilhelm Saueressig, Mr. Jakob Heinrich Saueressig, Mr. Reinhart Zech
Von Hymen and Matthews International Corporation*
|
|
Exhibit
Number 10.1 to Form 8-K
dated
May 12, 2008
|
|
|
|
|
|
|
|
10.15
|
|
Option
Agreement between Mr. Kilian Saueressig and Matthews International
Corporation (English translation)*
|
|
Exhibit
Number 10.1 to Form 10-Q
for
the quarter ended June 30, 2008
|
|
|
|
|
|
|
|
14.1
|
|
Form
of Code of Ethics Applicable to Executive Management *
|
|
Exhibit
Number 14.1 to Form 10-K
for
the year ended September 30, 2004
|
|
|
|
|
|
|
|
21
|
|
Subsidiaries
of the Registrant
|
|
Filed
Herewith
|
|
|
|
|
|
|
|
23
|
|
Consent
of Independent Registered Public Accounting Firm
|
|
Filed
Herewith
|
|
|
|
|
|
|
|
31.1
|
|
Certification
of Principal Executive Officer for Joseph C. Bartolacci
|
|
Filed
Herewith
|
|
|
|
|
|
|
|
INDEX,
Continued
|
|
_______
|
|
Exhibit
No.
|
|
Description
|
|
Prior
Filing or Sequential Page Numbers
Herein
|
|
|
|
|
|
|
|
31.2
|
|
Certification
of Principal Financial Officer for Steven F. Nicola
|
|
Filed
Herewith
|
|
|
|
|
|
|
|
32.1
|
|
Certification
Pursuant to 18 U.S.C. Section 1350, as Adopted Pursuant to Section 906 of
the Sarbanes-Oxley Act of 2002, of Joseph C. Bartolacci
|
|
Filed
Herewith
|
|
|
|
|
|
|
|
32.2
|
|
Certification
Pursuant to 18 U.S.C. Section 1350, as Adopted Pursuant to Section 906 of
the Sarbanes-Oxley Act of 2002, of Steven F. Nicola
|
|
Filed
Herewith
|
Copies of
any Exhibits will be furnished to shareholders upon written
request. Requests should be directed to Mr. Steven F. Nicola, Chief
Financial Officer, Secretary and Treasurer of the Registrant.