UNITED STATES
SECURITIES AND EXCHANGE COMMISSION
Washington, D. C. 20549
__________________________________________________________________________________________________________________________
FORM 10‑K |
| |
☒ | Annual Report Pursuant to Section 13 of 15(d) of the Securities Exchange Act of 1934 |
For the Fiscal Year Ended September 30, 2017
or
|
| |
☐ | Transition Report Pursuant To Section 13 or 15(d) of the Securities Exchange Act of 1934 |
For the Transition Period from _____ to _____
Commission File No. 0‑09115
__________________________________________________________________________________________________________________________
MATTHEWS INTERNATIONAL CORPORATION
(Exact name of registrant as specified in its charter)
|
| | |
PENNSYLVANIA | | 25‑0644320 |
(State or other jurisdiction of incorporation or organization) | | (I.R.S. Employer Identification No.) |
| | |
TWO NORTHSHORE CENTER, PITTSBURGH, PA | | 15212‑5851 |
(Address of principal executive offices) | | (Zip Code) |
(412) 442-8200 |
(Registrant's telephone number, including area code) |
Securities registered pursuant to Section 12(b) of the Act: |
Title of each class | | Name of each exchange on which registered |
Class A Common Stock, $1.00 par value | | Nasdaq Global Select Market |
| | |
Securities registered pursuant to Section 12(g) of the Act: None |
Indicate by check mark if the registrant is a well-known seasoned issuer, as defined in Rule 405 of the Securities Act.
Yes ☒ No ☐
Indicate by check mark if the registrant is not required to file reports pursuant to Section 13 or Section 15(d) of the Act.
Yes ☐ No ☒
Indicate by check mark whether the registrant (1) has filed all reports required to be filed by Section 13 or 15(d) of the Securities Exchange Act of 1934 during the preceding 12 months (or for such shorter period that the registrant was required to file such reports), and (2) has been subject to such filing requirements for the past 90 days.
Yes ☒ No ☐
Indicate by check mark whether the registrant has submitted electronically and posted on its corporate Web site, if any, every Interactive Data File required to be submitted and posted pursuant to Rule 405 of Regulation S-T during the preceding 12 months (or for such shorter period that the registrant was required to submit and post such files).
Yes ☒ No ☐
Indicate by check mark if disclosure of delinquent filers pursuant to Item 405 of Regulation S-K is not contained herein, and will not be contained, to the best of registrant’s knowledge, in definitive proxy or information statements incorporated by reference in Part III of this Form 10-K or any amendment to this Form 10-K.
☐
Indicate by check mark whether the registrant is a large accelerated filer, an accelerated filer, a non-accelerated filer, a smaller reporting company, or an emerging growth company. See the definitions of "large accelerated filer," "accelerated filer," "smaller reporting company," and "emerging growth company" in Rule 12b-2 of the Exchange Act.
|
| | | | |
Large accelerated filer | ☒ | | Smaller reporting company | ☐ |
Accelerated filer | ☐ | | Emerging growth company | ☐ |
Non-accelerated filer | ☐ | (Do not check if a smaller reporting company) | |
If an emerging growth company, indicate by check mark if the registrant has elected not to use the extended transition period for complying with any new or revised financial accounting standards provided pursuant to Section 13(a) of the Exchange Act. ☐
Indicate by check mark whether the registrant is a shell company (as defined in Rule 12b-2 of the Exchange Act).
Yes ☐ No ☒
The aggregate market value of the Class A Common Stock held by non-affiliates of the registrant, based upon the closing sale price of the Class A Common Stock on the Nasdaq Global Select Market on March 31, 2017, the last business day of the registrant's most recently completed second fiscal quarter, was approximately $2.1 billion.
As of October 31, 2017, shares of common stock outstanding were: Class A Common Stock 32,148,579 shares.
Documents incorporated by reference: Specified portions of the Proxy Statement for the 2018 Annual Meeting of Shareholders are incorporated by reference into Part III of this Report.
CAUTIONARY STATEMENT REGARDING FORWARD-LOOKING INFORMATION:
Any forward-looking statements contained in this Annual Report on Form 10-K (specifically those contained in Item 1, "Business," Item 1A, "Risk Factors" and Item 7, "Management's Discussion and Analysis of Financial Condition and Results of Operations") are included in this report pursuant to the "safe harbor" provisions of the Private Securities Litigation Reform Act of 1995. Such forward-looking statements involve known and unknown risks and uncertainties that may cause the actual results of Matthews International Corporation ("Matthews" or the "Company") in future periods to be materially different from management's expectations. Although the Company believes that the expectations reflected in such forward-looking statements are reasonable, no assurance can be given that such expectations will prove correct. In addition to the risk factors previously disclosed and those discussed elsewhere in this Annual Report on Form 10-K, factors that could cause the Company's results to differ materially from the results discussed in such forward-looking statements principally include changes in domestic or international economic conditions, changes in foreign currency exchange rates, changes in the cost of materials used in the manufacture of the Company's products, changes in mortality and cremation rates, changes in product demand or pricing as a result of consolidation in the industries in which the Company operates, changes in product demand or pricing as a result of domestic or international competitive pressures, unknown risks in connection with the Company's acquisitions, cybersecurity concerns, effectiveness of the Company's internal controls, compliance with domestic and foreign laws and regulations, technological factors beyond the Company's control, and other factors described in Item 1A, "Risk Factors" in this Form 10-K. In addition, although the Company does not have any customers that would be considered individually significant to consolidated sales, changes in the distribution of the Company's products or the potential loss of one or more of the Company's larger customers are also considered risk factors.
ITEM 1. BUSINESS.
Matthews, founded in 1850 and incorporated in Pennsylvania in 1902, is a provider principally of brand solutions, memorialization products and industrial technologies. Brand solutions include brand development, deployment and delivery (consisting of brand management, pre-media services, printing plates and cylinders, and imaging services for consumer packaged goods and retail customers, merchandising display systems, and marketing and design services). Memorialization products consist primarily of bronze and granite memorials and other memorialization products, caskets and cremation equipment primarily for the cemetery and funeral home industries. Industrial technologies include marking and coding equipment and consumables, industrial automation solutions and order fulfillment systems for identifying, tracking, picking and conveying consumer and industrial products.
At October 31, 2017, the Company and its majority-owned subsidiaries had approximately 11,000 employees. The Company's principal executive offices are located at Two NorthShore Center, Pittsburgh, Pennsylvania 15212, its telephone number is (412) 442-8200 and its website is www.matw.com. The Company files or furnishes all required reports with the Securities and Exchange Commission ("SEC") in accordance with the Exchange Act. The Company's Annual Report on Form 10-K, Quarterly Reports on Form 10-Q, Current Reports on Form 8-K and amendments to those reports are available free of charge on the Company's website as soon as reasonably practicable after being filed or furnished to the SEC. The Company's reports filed or furnished with the SEC, including exhibits attached to such reports, are also available to read and copy at the SEC's Public Reference Room at 100 F Street, N.E., Washington, D.C. 20549 or by contacting the SEC at 1-800-732-0330. All Company reports filed with or furnished to the SEC can be found on its website at www.sec.gov.
The Company has three reporting segments, SGK Brand Solutions, Memorialization, and Industrial Technologies. The following table sets forth reported sales and operating profit for the Company's business segments for the past three fiscal years. Detailed financial information relating to business segments and to domestic and international operations is presented in Note 18, "Segment Information" in Item 8 - "Financial Statements and Supplemental Data."
ITEM 1. BUSINESS, (continued)
|
| | | | | | | | | | | |
| Years Ended September 30, |
| 2017 | | 2016 | | 2015 |
| (Amounts in thousands) |
Sales to unaffiliated customers: | | | | | |
SGK Brand Solutions | $ | 770,181 |
| | $ | 755,975 |
| | $ | 798,339 |
|
Memorialization | 615,882 |
| | 610,142 |
| | 508,058 |
|
Industrial Technologies | 129,545 |
| | 114,347 |
| | 119,671 |
|
Consolidated | $ | 1,515,608 |
| | $ | 1,480,464 |
| | $ | 1,426,068 |
|
Operating profit: | | | | | |
SGK Brand Solutions | $ | 24,919 |
| | $ | 42,909 |
| | $ | 21,864 |
|
Memorialization | 80,652 |
| | 68,252 |
| | 70,064 |
|
Industrial Technologies | 7,032 |
| | 7,654 |
| | 13,095 |
|
Consolidated | $ | 112,603 |
| | $ | 118,815 |
| | $ | 105,023 |
|
In fiscal 2017, approximately 67% of the Company's sales were made from the United States, 26% were made from Europe, 3% were made from Asia, and 4% were made from other regions. For further information on segments, see Note 18, "Segment Information" in Item 8 - "Financial Statements and Supplementary Data" on page 69 of this Report. Products and services of the SGK Brand Solutions segment are sold throughout the world, with principal locations in the United States, Europe and Asia. Memorialization segment products are sold throughout the world, with the segment's principal operations located in the United States, Europe, Canada, and Australia. The Industrial Technologies segment sells equipment and consumables directly to industrial consumers and distributors in the United States and internationally through the Company's subsidiaries in Canada, Sweden, Germany and China, and through other foreign distributors. Matthews owns a minority interest in Industrial Technologies product distributors in Asia, Australia and Europe.
SGK Brand Solutions:
The SGK Brand Solutions segment provides brand development, deployment and delivery (consisting of brand management, pre-media services, printing plates and cylinders, and imaging services for consumer packaged goods and retail customers, merchandising display systems, and marketing and design services). The Company has extensive product offerings and capabilities related to brand development and brand management, serving the consumer packaged goods and retail industries. The primary packaging industry consists of manufacturers of printed packaging materials such as boxes, flexible packaging, folding cartons and bags commonly displayed at retailers of consumer goods. The corrugated packaging industry consists of manufacturers of printed corrugated containers. Other major industries served include the wallpaper, flooring, automotive, and textile industries.
The principal products and services of this segment include brand development, deployment, delivery, brand management, pre-media graphics services, 3-D graphics renderings, printing plates, gravure cylinders, steel bases, embossing tools, special purpose machinery, engineering assistance, print process assistance, print production management, digital asset management, content management, and package design. These products and services are used by brand owners and packaging manufacturers to develop and print packaging graphics that help identify and sell the product in the marketplace. Other packaging graphics can include nutritional information, directions for product use, consumer warning statements and UPC codes. The primary packaging manufacturer produces printed packaging from paper, film, foil and other composite materials used to display, protect and market the product. The corrugated packaging manufacturer produces printed containers from corrugated sheets. Using the Company's products, these sheets are printed and die cut to make finished containers.
ITEM 1. BUSINESS, (continued)
The segment offers a wide array of value-added services and products. These include print process and print production management services; print engineering consultation; pre-media preparation, which includes computer-generated art, film and proofs; plate mounting accessories and various press aids; and press-side print production assurance. The segment also provides creative digital graphics services to brand owners and packaging markets.
The segment's sales are also derived from the design, engineering, manufacturing and execution of merchandising and display systems. These systems include permanent and temporary displays, custom store fixtures, brand concept shops, interactive media, custom packaging, and screen and digitally printed promotional signage. Design and engineering services include concept and model development, graphics design and prototyping. Merchandising and display systems are manufactured to specifications developed by the segment in collaboration with the customer.
The Company works closely with manufacturers to provide the proper printing forms and tooling required to print the packaging to the user's specifications. The segment's printing plate products are made principally from photopolymer resin and sheet materials. Upon customer request, plates can be pre-mounted press-ready in a variety of configurations that maximize print quality and minimize press set‑up time. Gravure cylinders, manufactured from steel, copper and chrome, can be custom engineered for multiple print processes and specific customer print applications.
The SGK Brand Solutions segment customer base consists primarily of brand owners and packaging industry converters. Brand owners are generally large, well-known consumer products companies and retailers with a national or global presence. These types of companies tend to purchase their graphics needs directly, and supply the printing forms, or the electronic files to make the printing plates and gravure cylinders, to the packaging printer for their products. The SGK Brand Solutions segment serves customers throughout the world, with principal locations in the United States, Europe, Australia and Asia.
Major raw materials for this segment's products include photopolymers, steel, copper, film, wood, particleboard, corrugated materials, structural steel, plastic, laminates, inks and graphic art supplies. All such materials are presently available in adequate supply from various industry sources.
The SGK Brand Solutions segment is one of several providers of brand management, brand development and pre-media services and manufacturers of printing plates and cylinders with an international presence. The combination of the Company's businesses in North America, Europe and Asia is an important part of Matthews' strategy to be a worldwide leader in the graphics industry by providing consistent service to multinational customers on a global basis. Competition is on the basis of product quality, timeliness of delivery and price. The merchandising and display business operates in a fragmented industry consisting primarily of a number of small, locally operated companies. The segment competes on the basis of reliability, creativity and ability to provide a broad array of merchandising products and services. The segment is unique in its ability to provide in-depth marketing and merchandising services as well as design, engineering and manufacturing capabilities. These capabilities allow the segment to deliver complete turnkey merchandising solutions quickly and cost effectively. The Company differentiates itself from the competition by consistently meeting these customer demands, providing service to customers both nationally and globally, and providing a variety of value-added support services.
Memorialization:
The Memorialization segment manufactures and markets a full line of memorialization products used primarily in cemeteries, funeral homes and crematories. The segment's products, which are sold principally in the United States, Europe, Canada and Australia, include cast bronze memorials, granite memorials, caskets, cremation equipment and other memorialization products. The segment also manufactures and markets architectural products that are used to identify or commemorate people, places, events and accomplishments.
ITEM 1. BUSINESS, (continued)
Memorial products include flush bronze and granite memorials, upright granite memorials and monuments, cremation memorialization products, granite benches, flower vases, crypt plates and letters, cremation urns, niche units, cemetery features and statues, along with other related products and services. Flush memorials are bronze plaques or granite memorials which contain personal information about a deceased individual (such as name, birth date, and death date), photos and emblems. Flush bronze and granite memorials are even or "flush" with the ground and therefore are preferred by many cemeteries for easier lawn mowing and general maintenance. The segment's memorial products also include community and family mausoleums within North America. In addition, the segment's other memorial products include bronze plaques, letters, emblems, vases, lights and photo ceramics that can be affixed to granite monuments, mausoleums, crypts and flush memorials. Principal customers for memorial products are cemeteries and memorial parks, which in turn sell the Company's products to the consumer.
Customers of the Memorialization segment can also purchase memorials and vases on a "pre-need" basis. The "pre-need" concept permits families to arrange for these purchases in advance of their actual need. Upon request, the Company will manufacture the memorial to the customer's specifications (e.g., name and birth date) and place it in storage for future delivery. Memorials in storage have been paid in full with title conveyed to each pre-need purchaser.
The segment is also a leading manufacturer and distributor of caskets and other funeral home products in North America. The segment produces and markets metal, wood and cremation caskets. Caskets are offered in a variety of colors, interior designs, handles and trim in order to accommodate specific religious, ethnic or other personal preferences. The segment also markets other funeral home products such as urns, jewelry and stationery. The segment offers individually personalized caskets through its distribution network.
Metal caskets are made from various gauges of cold-rolled steel, stainless steel, copper and bronze. Metal caskets are generally categorized by whether the casket is non-gasketed or gasketed, and by material (i.e., bronze, copper, or steel) and in the case of steel, by the gauge (thickness) of the metal. Wood caskets are primarily manufactured from nine different species of wood. The species of wood used are poplar, pine, ash, oak, pecan, maple, cherry, walnut and mahogany. The Memorialization segment is a leading manufacturer of all-wood constructed caskets, which are manufactured using pegged and dowelled construction, and include no metal parts. Cremation caskets are made primarily from wood or cardboard covered with cloth or veneer. These caskets appeal primarily to cremation consumers, environmentally concerned consumers, and value buyers.
The Memorialization segment also produces casket components. Casket components include stamped metal parts, metal locking mechanisms for gasketed metal caskets, adjustable beds and interior panels. Metal casket parts are produced by stamping cold-rolled steel, stainless steel, copper and bronze sheets into casket body parts. Locking mechanisms and adjustable beds are produced by stamping and assembling a variety of steel parts. The segment purchases from sawmills and lumber distributors various species of uncured wood, which it dries and cures. The cured wood is processed into casket components.
In addition, the segment provides product and service assortment planning, as well as merchandising and display products to funeral service businesses. These products assist funeral service professionals in providing information, value and satisfaction to their client families.
The segment also provides cremation systems, crematory management, cremation service and supplies, waste management and incineration systems, and environmental and energy solutions to the human, pet and specialized incineration markets. The primary market areas for these products and services are North America and Europe, although the segment also sells into Latin America and the Caribbean, Australia, the Middle East and Asia.
ITEM 1. BUSINESS, (continued)
Cremation systems include flame-based systems for cremation of humans and pets, as well as equipment for processing the cremated remains and other related equipment (ventilated work stations, tables, cooler racks, vacuums). The principal markets for these products are funeral homes, cemeteries, crematories, pet crematories, animal disposers and veterinarians. These products primarily are marketed directly by segment personnel. Human crematory management/operations represent the actual operation and management of client-owned crematories. Currently the segment provides these services primarily to municipalities in Europe and private operators in the United States. Cremation service and supplies consist of operator training, preventative maintenance and "at need" service work performed on various makes and models of equipment. This work can be as simple as replacing defective bulbs or as complex as complete reconstruction and upgrading or retro-fitting on site. Supplies are consumable items associated with normal operations.
Waste management/incineration systems encompass both batch load and continuous feed, static and rotary systems for incineration of all waste types, as well as equipment for in-loading waste, out-loading ash and energy recovery. The principal markets for these products are medical waste disposal, oil and gas "work camp" wastes, industrial wastes and bio-mass generators. Environmental and energy systems include emissions filtration units, waste heat recovery equipment, waste gas treatment products, as well as energy recovery. The principal markets are municipalities or public/state agencies, the cremation industry and other industries which utilize incinerators for waste reduction and energy production.
The Memorialization segment also manufactures a full line of other products, including urns in a variety of sizes, styles and shapes as well as standard and custom designed granite cremation pedestals and benches. The segment manufactures bronze and granite niche units, which are comprised of numerous compartments used to display cremation urns in mausoleums and churches. The Company also markets turnkey cremation gardens, which include the design and all related products for a cremation memorial garden.
Architectural products include cast bronze and aluminum plaques, etchings and letters that are used to recognize, commemorate and identify people, places, events and accomplishments. The Company's plaques are frequently used to identify the name of a building or the names of companies or individuals located within a building. Such products are also used to commemorate events or accomplishments, such as military service or financial donations. The principal markets for the segment's architectural products are corporations, fraternal organizations, contractors, churches, hospitals, schools and government agencies. These products are sold to and distributed through a network of independent dealers including sign suppliers, awards and recognition companies, and trophy dealers.
Raw materials used by the Memorialization segment to manufacture memorials consist principally of bronze and aluminum ingot, granite, sheet metal, coating materials, photopolymers and construction materials and are generally available in adequate supply. Ingot is obtained from various North American, European and Australian smelters. The primary materials required for casket manufacturing are cold-rolled steel and lumber. The segment also purchases copper, bronze, stainless steel, particleboard, corrugated materials, paper veneer, cloth, ornamental hardware and coating materials. Purchase orders or supply agreements are typically negotiated with large, integrated steel producers that have demonstrated timely delivery, high quality material and competitive prices. Lumber is purchased from a number of sawmills and lumber distributors. Raw materials used to manufacture cremation and incineration products consist principally of structural steel, sheet metal, electrical components, combustion devices and refractory materials. These are generally available in adequate supply from numerous suppliers.
Competition from other manufacturers of memorial products is on the basis of reputation, product quality, delivery, price, and design availability. The Company believes that its superior quality, broad product lines, innovative designs, delivery capability, customer responsiveness, experienced personnel and consumer-oriented merchandising systems are competitive advantages in its markets. Competition in the mausoleum construction industry includes various construction companies throughout North America and is on the basis of design, quality and price. Competitors in the architectural market are numerous and include companies that manufacture cast and painted signs, plastic materials, sand-blasted wood and other fabricated products.
ITEM 1. BUSINESS, (continued)
The Memorialization segment markets its casket products in the United States through a combination of Company-owned and independent casket distribution facilities. The Company operates approximately 100 distribution centers in the United States. Approximately 85% of the segment's casket products are currently sold through Company-owned distribution centers. The casket business is highly competitive and the Company competes with other manufacturers on the basis of product quality, price, service, design availability and breadth of product line. The Memorialization segment provides a line of casket products that it believes is as comprehensive as any of its major competitors. There are a large number of casket industry participants operating in North America and also a few foreign casket manufacturers, primarily from China, participating in the North American market.
The Company competes with several manufacturers in the cremation and accessory equipment market principally on the basis of product design, quality and price. The Memorialization segment and its three largest global competitors account for a substantial portion of the U.S. and European cremation equipment market.
The Memorialization segment works to provide a total solution to customers that own and operate businesses in both the cemetery and funeral home markets. The Company's memorial and casket products serve the relatively stable casketed and in-ground burial death market, while its memorial products and cremation equipment also serve the growing cremation market.
Industrial Technologies:
The Industrial Technologies segment designs, manufactures and distributes a wide range of marking and coding equipment and consumables, industrial automation solutions, and order fulfillment systems. Manufacturers, suppliers and distributors worldwide rely on Matthews' integrated systems to identify, track, convey and pick their products.
Marking systems range from mechanical marking solutions to microprocessor-based ink-jet printing systems that integrate into a customer's manufacturing, inventory tracking and material handling control systems. The Company manufactures and markets products and systems that employ different marking technologies, including contact printing, indenting, etching, laser and ink-jet printing. Customers frequently use a combination of these methods to achieve an appropriate mark. These technologies apply product information required for identification and traceability, as well as to facilitate inventory and quality control, regulatory compliance and brand name communication.
Fulfillment systems complement the tracking and distribution of a customer's products with automated order fulfillment technologies, motor-driven rollers for product conveyance, and controls for material handling systems. Material handling customers include some of the largest automated assembly and distribution companies in the United States. The Company also
engineers innovative, custom solutions to address specific customer requirements in a variety of industries, including oil exploration and security scanning.
A significant portion of the revenue of the Industrial Technologies segment is attributable to the sale of consumables and replacement parts required by the marking, coding and tracking products sold by Matthews. The Company develops inks, rubber and steel consumables in conjunction with the marking equipment in which they are used, which is critical to ensure ongoing equipment reliability and mark quality.
The principal customers for the Company's marking and fulfillment systems products are manufacturers, suppliers and distributors of durable goods, building products, consumer goods manufacturers (including food and beverage processors) and producers of pharmaceuticals. The Company also serves a wide variety of industrial markets, including metal fabricators, manufacturers of woven and non-woven fabrics, plastic, rubber and automotive products.
A portion of this segment's sales are outside the United States, with distribution sourced through the Company's subsidiaries in Canada, Sweden, Germany and China in addition to other international distributors. The Company owns a minority interest in distributors in Asia, Australia and Europe.
ITEM 1. BUSINESS, (continued)
Major raw materials for this segment's products include precision components, electronics, printing components, tool steels, rubber and chemicals, all of which are presently available in adequate supply from various sources.
Competitors in the marking and fulfillment systems industries are diverse, with some companies offering limited product lines for well-defined specialty markets, while others operate similarly to the Company, offering a broad product line and competing in multiple product markets and countries. Competition for marking and fulfillment systems products is based on product performance, ease of integration into the manufacturing and/or distribution process, service and price. The Company typically competes with specialty companies in specific brand marking solutions and traceability applications. The Company believes that, in general, its Industrial Technologies segment offers one of the broadest lines of products to address a wide variety of marking, coding and industrial automation applications.
PATENTS, TRADEMARKS AND LICENSES:
The Company holds a number of trademarks and in excess of 100 domestic and foreign patents for its products and related technologies. However, the Company believes the loss of any individual or a significant number of patents or trademarks would not have a material impact on consolidated operations or revenues.
BACKLOG:
Because the nature of the Company's SGK Brand Solutions, Memorialization and Industrial Technologies businesses are primarily custom products made to order and services with short lead times, backlogs are not generally material except for roto-gravure engineering projects in the SGK Brand Solutions segment, mausoleums and cremation equipment in the Memorialization segment and industrial automation and order fulfillment systems in the Industrial Technologies segment. Backlogs vary in a range of approximately six to twelve months of sales for roto-gravure engineering projects and mausoleums. Cremation equipment sales backlogs vary in a range of eight to ten months of sales. Backlogs for Industrial Technologies segment sales generally vary in a range of up to six weeks for standard products and twelve weeks for custom systems. The Company's current backlog is expected to be substantially filled in fiscal 2018.
REGULATORY MATTERS:
The Company's operations are subject to various federal, state and local laws and regulations relating to the protection of the environment. The Company is party to various environmental matters which include obligations to investigate and mitigate the effects on the environment of the disposal of certain materials at various operating and non-operating sites. The Company is currently performing environmental assessments and remediation at these sites, as appropriate. Refer to Note 16, "Environmental Matters" in Item 8 - "Financial Statements and Supplementary Data," for further details.
ITEM 1A. RISK FACTORS, (continued)
ITEM 1A. RISK FACTORS.
There are inherent risks and uncertainties associated with the Company's businesses that could adversely affect its operating performance and financial condition. Set forth below are descriptions of those risks and uncertainties that the Company currently believes to be material. Additional risks not currently known or deemed immaterial may also result in adverse effects on the Company.
Changes in Economic Conditions. Generally, changes in domestic and international economic conditions affect the industries in which the Company and its customers and suppliers operate. These changes include changes in the rate of consumption or use of the Company's products due to economic downturns, volatility in currency exchange rates, and changes in raw material prices resulting from supply and/or demand conditions.
Uncertainty about current global economic conditions poses a risk, as consumers and businesses may continue to postpone or cancel spending. Other factors that could influence customer spending include energy costs, conditions in the credit markets, consumer confidence and other factors affecting consumer spending behavior. These and other economic factors could have an effect on demand for the Company's products and services and negatively impact the Company's financial condition and results of operations.
Foreign Operations. The Company conducts business in more than 25 countries around the world, and in fiscal 2017 approximately 33% of the Company's sales to external customers were to customers outside the United States. In addition, the Company's manufacturing operations, suppliers and employees are located in many places around the world. As such, the Company's future success depends in part on its ability to grow sales in non-U.S. markets. Sales and operations outside of the United States are subject to certain inherent risks, including fluctuations in the value of the U.S. dollar relative to foreign currencies, global economic uncertainties, tariffs, quotas, taxes and other market barriers, political and economic instability, restrictions on the export or import of technology, potentially limited intellectual property protection, difficulties in staffing and managing international operations, potentially adverse tax consequences, and required compliance with non-U.S. laws and regulations.
Changes in Foreign Currency Exchange Rates. Manufacturing and sales of a significant portion of the Company's products are outside the United States, and accordingly, the Company holds assets, incurs liabilities, earns revenue and pays expenses in a variety of currencies. The Company's consolidated financial statements are presented in U.S. dollars, and therefore, the Company must translate the reported values of its foreign assets, liabilities, revenue and expenses into U.S. dollars. Increases or decreases in the value of the U.S. dollar compared to foreign currencies may negatively affect the value of these items in the Company's consolidated financial statements, even though their value has not changed in local currency.
Increased Prices for Raw Materials. The Company's profitability is affected by the prices of the raw materials used in the manufacture of its products. These prices may fluctuate based on a number of factors, including changes in supply and demand, domestic and global economic conditions, volatility in commodity markets, currency exchange rates, labor costs and fuel-related costs. If suppliers increase the price of critical raw materials, alternative sources of supply, or alternative materials, may not exist or be readily available.
The Company has standard selling price structures (i.e., list prices) in certain of its segments, which are reviewed for adjustment generally on an annual basis. In addition, the Company has established pricing terms with several of its customers through contracts or similar arrangements. Based on competitive market conditions and to the extent that the Company has established pricing terms with customers, the Company's ability to immediately increase the price of its products to offset the increased costs may be limited. Significant raw material price increases that cannot be mitigated by selling price increases or productivity improvements will negatively affect the Company's results of operations.
ITEM 1A. RISK FACTORS, (continued)
Changes in Mortality and Cremation Rates. Generally, life expectancy in the United States and other countries in which the Company's Memorialization segment operates has increased steadily for several decades and is expected to continue to do so in the future. The increase in life expectancy is also expected to impact the number of deaths in the future. Additionally, cremations have steadily grown as a percentage of total deaths in the United States since the 1960's, and are expected to continue to increase in the future. The Company expects that these trends will continue in the future and sales of the Company's Memorialization segment may benefit from the continued growth in the number of cremations; however, such trends may adversely affect the volume of bronze and granite memorialization products and burial caskets sold in the United States.
Changes in Product Demand or Pricing. The Company's businesses have and will continue to operate in competitive markets. Changes in product demand or pricing are affected by domestic and foreign competition and an increase in consolidated purchasing by large customers operating in both domestic and global markets. The Memorialization businesses generally operate in markets with ample supply capacity and demand which is correlated to death rates. The Brand Solutions businesses serve global customers
that are requiring their suppliers to be global in scope and price-competitive. Additionally, in recent years the Company has witnessed an increase in products manufactured offshore, primarily in China, and imported into the Company's U.S. markets. It is expected that these trends will continue and may affect the Company's future results of operations.
Changes in the Distribution of the Company's Products or the Loss of a Large Customer. Although the Company does not have any customer that is individually significant to consolidated sales, it does have contracts with several large customers in both the Memorialization and SGK Brand Solutions segments. While these contracts provide important access to large purchasers of the Company's products, they can obligate the Company to sell products at contracted prices for extended periods of time. Additionally, any significant divestiture of business properties or operations by current customers could result in a loss of business if the Company is not able to maintain the business with the subsequent owners of the businesses.
Risks in Connection with Acquisitions. The Company has grown in part through acquisitions, and continues to evaluate acquisition opportunities that have the potential to support and strengthen its businesses. There is no assurance however that future acquisition opportunities will arise, or that if they do, that they will be consummated. In addition, acquisitions involve inherent risks that the businesses acquired will not perform in accordance with expectations, or that synergies expected from the integration of the acquisitions will not be achieved as rapidly as expected, if at all. Failure to effectively integrate acquired businesses could prevent the realization of expected rates of return on the acquisition investment and could have a negative effect on the Company's results of operations and financial condition.
Protection of Intellectual Property. Certain of the Company's businesses rely on various intellectual property rights, including patents, copyrights, trademarks and trade secrets, as well as confidentiality provisions and licensing arrangements, to establish proprietary rights. If the Company does not enforce its intellectual property rights successfully, its competitive position may suffer which could harm the Company's operating results. In addition, the Company's patents, copyrights, trademarks and other intellectual property rights may not provide a significant competitive advantage. The Company may need to spend significant resources monitoring its intellectual property rights and may or may not be able to detect infringement by third parties. The Company's competitive position may be harmed if it cannot detect infringement and enforce its intellectual property rights quickly or at all. In some circumstances, the Company may choose to not pursue enforcement because an infringer has a dominant intellectual property position or for other business reasons. In addition, competitors might avoid infringement by designing around the Company's intellectual property rights or by developing non-infringing competing technologies. Intellectual property rights and the Company's ability to enforce them may be unavailable or limited in some countries which could make it easier for competitors to capture market share and could result in lost revenues.
ITEM 1A. RISK FACTORS, (continued)
Environmental Remediation and Compliance. The Company is subject to the risk of environmental liability and limitations on its operations due to environmental laws and regulations. The Company is subject to extensive federal, state, local and foreign environmental, health and safety laws and regulations concerning matters such as air emissions, wastewater discharges, solid and hazardous waste handling and disposal and the investigation and remediation of contamination. The risks of potentially substantial costs and liabilities related to compliance with these laws and regulations are an inherent part of the Company's business, and future conditions may develop, arise or be discovered that create substantial environmental compliance or remediation liabilities and costs. Compliance with environmental, health and safety legislation and regulatory requirements may prove to be more limiting and costly than the Company anticipates, and there is no assurance that significant expenditures related to such compliance may not be required in the future.
From time to time, the Company may be subject to legal proceedings brought by private parties or governmental authorities with respect to environmental matters, including matters involving alleged noncompliance with or liability under environmental, health and safety laws, property damage or personal injury. New laws and regulations, including those which may relate to emissions of greenhouse gases, stricter enforcement of existing laws and regulations, the discovery of previously unknown contamination or the imposition of new clean-up requirements could require the Company to incur costs or become the basis for new or increased liabilities that could have a material adverse effect on the Company's business, financial condition or results of operations.
Technological Factors Beyond the Company's Control. The Company operates in certain markets in which technological product development contributes to its ability to compete effectively. There can be no assurance that the Company will be able to develop new products, that new products can be manufactured and marketed profitably, or that new products will successfully meet the expectations of customers.
Cybersecurity and Data Breaches. In the course of business, the Company collects and stores sensitive data and proprietary business information. The Company could be subject to service outages or breaches of security systems which may result in disruption, unauthorized access, misappropriation, or corruption of this information. Security breaches of the Company's network or data including physical or electronic break-ins, vendor service outages, computer viruses, attacks by hackers or similar breaches can create system disruptions, shutdowns, or unauthorized disclosure of confidential information. Although the Company is not aware of any significant incidents to date, if it is unable to prevent such security or privacy breaches, its operations could be disrupted or the Company may suffer legal claims, loss of reputation, financial loss, property damage, or regulatory penalties because of lost or misappropriated information.
Compliance with Foreign Laws and Regulations. Due to the international scope of the Company's operations, Matthews is subject to a complex system of commercial and trade regulations around the world, and the Company's foreign operations are governed by laws, rules and business practices that often differ from those of the United States. The Company cannot predict the nature, scope or effect of future regulatory requirements to which the Company's operations might be subject or the manner in which existing laws might be administered or interpreted, which could have a material and negative impact on the Company's business and results of operation. For example, recent years have seen an increase in the development and enforcement of laws regarding trade compliance and anti-corruption, such as the U.S. Foreign Corrupt Practices Act and similar laws in other countries. While Matthews maintains a variety of internal policies and controls and takes steps, including periodic training and internal audits, that the Company believes are reasonably calculated to discourage, prevent and detect violations of such laws, the Company cannot guarantee that such actions will be effective or that individual employees will not engage in inappropriate behavior in contravention of the Company's policies and instructions. Such conduct, or even the allegation thereof, could result in costly investigations and the imposition of severe criminal or civil sanctions, could disrupt the Company's business, and could materially and adversely affect the Company's reputation, business and results of operations or financial condition.
ITEM 1A. RISK FACTORS, (continued)
Further, the Company is subject to laws and regulations worldwide affecting its operations outside the United States in areas including, but not limited to, intellectual property ownership and infringement, tax, customs, import and export requirements, anti-corruption and anti-bribery, foreign exchange controls and cash repatriation restrictions, foreign investment, data privacy requirements, anti-competition, pensions and social insurance, employment, and environment, health, and safety. Compliance with these laws and regulations may be onerous and expensive and requirements may differ among jurisdictions. Further, the promulgation of new laws, changes in existing laws and abrogation of local regulations by national laws may have a negative impact on the Company's business and prospects. In addition, certain laws and regulations are relatively new and their interpretation and enforcement involve significant uncertainties. There can be no assurance that any of these factors will not have a material adverse effect on the Company's business, results of operations or financial condition.
Effectiveness of Internal Controls. Section 404 of the Sarbanes-Oxley Act of 2002 requires a comprehensive evaluation of the Company's internal control over financial reporting. To comply with this statute, the Company is required to document and test its internal control over financial reporting, management is required to assess and issue a report concerning internal control over financial reporting, and the Company's independent registered public accounting firm is required to attest to and report on the Company's assessment of the effectiveness of internal control over financial reporting. Any failure to maintain or implement required new or improved controls could cause the Company to fail to meet its periodic reporting obligations or result in material misstatements in the consolidated financial statements, and substantial costs and resources may be required to rectify these or other internal control deficiencies. If the Company cannot produce reliable financial reports, investors could lose confidence in the Company's reported financial information, the market price of the Company's common stock could decline significantly, and its business, financial condition, and reputation could be harmed.
Compliance with Securities Laws and Regulations; Conflict Minerals Reporting. The Company is required to comply with various securities laws and regulations, including but not limited to the Sarbanes-Oxley Act of 2002 and the Dodd-Frank Wall Street Reform and Consumer Protection Act ("Dodd-Frank"). Dodd-Frank contains provisions, among others, designed to improve transparency and accountability concerning the supply chains of certain minerals originating from the Democratic Republic of Congo and adjoining countries that are believed to be benefiting armed groups ("Conflict Minerals"). While Dodd-Frank does not prohibit companies from using Conflict Minerals, the SEC mandates due diligence, disclosure and reporting requirements for companies for which Conflict Minerals are necessary to the functionality or production of a product. The Company's efforts to comply with Dodd-Frank and other evolving laws, regulations and standards could result in increased costs and expenses related to compliance and potential violations.
ITEM 1B. UNRESOLVED STAFF COMMENTS.
Not Applicable.
ITEM 2. PROPERTIES, (continued)
ITEM 2. PROPERTIES.
Principal properties of the Company and its majority-owned subsidiaries as of October 31, 2017 were as follows (properties are owned by the Company except as noted):
|
| | | |
Location | | Description of Property | |
| | | |
SGK Brand Solutions: | | | |
Antwerp, Belgium | | Manufacturing | |
Chennai, India | | Operating facility | (1) |
Chicago, IL | | Operating facilities | (1) |
Cincinnati, OH | | Operating facility | (1) |
Cleckheaton, England | | Operating facility | (1) |
Des Plaines, IL | | Operating facility | (1) |
Dachnow, Poland | | Manufacturing | |
Gateshead, England | | Operating facility | (1) |
East Butler, PA | | Manufacturing | |
Goslar, Germany | | Manufacturing | (1) |
Grenzach-Wyhlen, Germany | | Manufacturing | |
Istanbul, Turkey | | Manufacturing | (1) |
Izmir, Turkey | | Manufacturing | |
Julich, Germany | | Manufacturing | |
Kalamazoo, MI | | Operating facility | |
Kempen, Germany | | Manufacturing | (1) |
Kowloon, Hong Kong | | Operating facility | (1) |
London, England | | Operating facility | (1) |
Manchester, England | | Manufacturing | (1) |
Marietta, GA | | Manufacturing | |
Minneapolis, MN | | Operating facility | |
Mississauga, Canada | | Operating facility | (1) |
Monchengladbach, Germany | | Manufacturing | |
Monchengladbach, Germany | | Manufacturing | (1) |
Munich, Germany | | Manufacturing | (1) |
New Berlin, WI | | Manufacturing | (1) |
Novgorod, Russia | | Manufacturing | |
Nuremberg, Germany | | Manufacturing | (1) |
Penang, Malaysia | | Operating facility | |
Portland, OR | | Operating facility | (1) |
Queretaro, Mexico | | Operating facility | |
Redmond, WA | | Operating facility | (1) |
St. Louis, MO | | Manufacturing | |
San Francisco, CA | | Operating facility | (1) |
Shanghai, China | | Operating facilities | (1) |
Shenzhen, China | | Operating facility | (1) |
| | | |
| | | |
| | | |
| | | |
| | | |
| | | |
| | | |
ITEM 2. PROPERTIES, (continued)
|
| | | |
Location | | Description of Property | |
| | | |
SGK Brand Solutions, (continued): | | | |
Tarnowo Podgorne, Poland | | Manufacturing | (1) |
Vreden, Germany | | Manufacturing | |
Vreden, Germany | | Operating facility | |
Wilsonville, OR | | Operating facility | (1) |
| | | |
Memorialization (2): | | | |
Pittsburgh, PA | | Manufacturing / Division Offices | |
Pittsburgh, PA | | Division Offices | (1) |
Apopka, FL | | Manufacturing / Division Offices | |
Apopka, FL | | Operating facility | |
Aurora, IN | | Manufacturing | |
Bristol, TN | | Distribution | |
Colorno, Italy | | Manufacturing | (1) |
Dallas, TX | | Distribution Hub | (1) |
Dandenong, Australia | | Manufacturing | (1) |
Edmunston, Canada | | Manufacturing | |
Elberton, GA | | Manufacturing | (1) |
Fontana, CA | | Distribution Hub | (1) |
Harrisburg, PA | | Distribution Hub | (1) |
Hyde, England | | Manufacturing | (1) |
Indianapolis, IN | | Distribution Hub | (1) |
Kingwood, WV | | Manufacturing | |
Kingwood, WV | | Manufacturing | (1) |
Monterrey, Mexico | | Manufacturing | (1) |
Richmond, IN | | Manufacturing | (1) |
Richmond, IN | | Manufacturing | |
Searcy, AR | | Manufacturing | |
Stone Mountain, GA | | Distribution Hub | (1) |
Udine, Italy | | Manufacturing | (1) |
Vestone, Italy | | Manufacturing | (1) |
West Point, MS | | Distribution | |
Whittier, CA | | Manufacturing | (1) |
York, PA | | Manufacturing | |
| | | |
Industrial Technologies: | | | |
Pittsburgh, PA | | Manufacturing / Division Offices | |
Beijing, China | | Manufacturing | (1) |
Cincinnati, OH | | Manufacturing | (1) |
Cincinnati, OH | | Manufacturing | |
Germantown, WI | | Manufacturing | (1) |
Gothenburg, Sweden | | Manufacturing / Distribution | (1) |
Lima, Costa Rica | | Manufacturing | (1) |
Portland, OR | | Manufacturing | |
Tianjin City, China | | Manufacturing | (1) |
| | | |
| | | |
| | | |
ITEM 2. PROPERTIES, (continued)
|
| | | |
Location | | Description of Property | |
| | | |
Corporate Office: | | | |
Pittsburgh, PA | | General Offices | |
| |
(1) | These properties are leased by the Company under operating lease arrangements. |
| |
(2) | In addition to the properties listed, the Memorialization segment leases warehouse facilities totaling approximately 1.1 million square feet in 38 states under operating leases. |
Rent expense incurred by the Company for all leased facilities was approximately $36.4 million in fiscal 2017.
All of the owned properties are unencumbered. The Company believes its facilities are generally well suited for their respective uses and are of adequate size and design to provide the operating efficiencies necessary for the Company to be competitive. The Company's facilities provide adequate space for meeting its near-term production requirements and have availability for additional capacity. The Company intends to continue to expand and modernize its facilities as necessary to meet the demand for its products.
ITEM 3. LEGAL PROCEEDINGS.
Matthews is subject to various legal proceedings and claims arising in the ordinary course of business. Management does not expect that the results of any of these legal proceedings will have a material adverse effect on Matthews' financial condition, results of operations or cash flows.
ITEM 4. MINE SAFETY DISCLOSURES.
Not applicable.
OFFICERS AND EXECUTIVE MANAGEMENT OF THE REGISTRANT
The following information is furnished with respect to officers and executive management as of October 31, 2017:
|
| | | | |
Name | | Age | | Positions with Registrant |
Joseph C. Bartolacci | | 57 | | President and Chief Executive Officer |
Gregory S. Babe | | 59 | | Chief Technology Officer |
David F. Beck | | 65 | | Vice President and Controller |
Marcy L. Campbell | | 54 | | Vice President, Human Resources |
Brian J. Dunn | | 60 | | Executive Vice President, Strategy and Corporate Development |
Steven D. Gackenbach | | 54 | | Group President, Memorialization |
Robert M. Marsh | | 49 | | Vice President and Treasurer |
Steven F. Nicola | | 57 | | Chief Financial Officer and Secretary |
Paul F. Rahill | | 60 | | President, Environmental Solutions Division |
David A. Schawk | | 61 | | Group President, SGK Brand Solutions |
Brian D. Walters | | 48 | | Vice President and General Counsel |
Joseph C. Bartolacci was appointed President and Chief Executive Officer effective October 2006.
Gregory S. Babe was appointed Chief Technology Officer effective November 2015. Prior thereto he had been the interim Executive Vice President, Global Information Technology and Integration since November 2014 when he joined the Company. Prior to joining the Company, Mr. Babe was the President and Chief Executive Officer of Liquid X Printed Metals, Inc., from June 2013 to November 2014 and Chief Executive Officer of Orbital Engineering, Inc., from July 2012 to June 2013.
David F. Beck was appointed Vice President and Controller effective February 2010.
Marcy L. Campbell was appointed Vice President, Human Resources effective November 2014. Ms. Campbell served as Director, Regional Human Resources from January 2013, and as Manager, Regional Human Resources from November 2005 to December 2012.
Brian J. Dunn was appointed Executive Vice President, Strategy and Corporate Development effective July 2014. Prior thereto, he served as Group President, Brand Solutions since February 2010.
Steven D. Gackenbach was appointed Group President, Memorialization effective October 31, 2011.
Robert M. Marsh was appointed Vice President and Treasurer in February 2016. He served as Treasurer since December 2014 when he joined the Company. Prior to joining the Company, Mr. Marsh was a partner of PNC Mezzanine Capital, the principal mezzanine investment business of The PNC Financial Services Group, LLC ("PNC"). Mr. Marsh joined PNC in 1997.
Steven F. Nicola was appointed Chief Financial Officer and Secretary effective December 2003.
Paul F. Rahill was appointed President, Environmental Solutions Division in October 2002.
David A. Schawk joined the Company in July 2014 as President, SGK Brand Solutions upon Matthews' acquisition of Schawk. Mr. Schawk served as Schawk's Chief Executive Officer from July 2012 and was a member of the Schawk Board of Directors since 1992.
Brian D. Walters was appointed Vice President and General Counsel effective February 2009.
ITEM 5. MARKET FOR REGISTRANT'S COMMON EQUITY AND RELATED STOCKHOLDER MATTERS.
Market Information:
The authorized common stock of the Company consists of 70,000,000 shares of Class A Common Stock, $1.00 par value. At September 30, 2017, 32,148,579 shares were outstanding. The Company's Class A Common Stock is traded on the NASDAQ Global Select Market under the symbol "MATW". The following table sets forth the high, low and closing prices as reported by Nasdaq for the periods indicated:
|
| | | | | | | | | | | |
| High | | Low | | Close |
Fiscal 2017: | | | | | |
Quarter ended: September 30, 2017 | $ | 66.65 |
| | $ | 57.40 |
| | $ | 62.25 |
|
June 30, 2017 | 72.60 |
| | 60.40 |
| | 61.25 |
|
March 31, 2017 | 77.85 |
| | 64.45 |
| | 67.65 |
|
December 31, 2016 | 77.10 |
| | 57.65 |
| | 76.85 |
|
Fiscal 2016: | | | | | |
Quarter ended: September 30, 2016 | $ | 62.85 |
| | $ | 54.76 |
| | $ | 60.76 |
|
June 30, 2016 | 56.05 |
| | 49.37 |
| | 55.64 |
|
March 31, 2016 | 54.80 |
| | 45.00 |
| | 51.47 |
|
December 31, 2015 | 61.10 |
| | 46.05 |
| | 53.45 |
|
The Company has a stock repurchase program. The buy-back program is designed to increase shareholder value, enlarge the Company's holdings of its common stock, and add to earnings per share. Repurchased shares may be retained in treasury, utilized for acquisitions, or reissued to employees or other purchasers, subject to the restrictions of the Company's Restated Articles of Incorporation. Under the current authorization, the Company's Board of Directors has authorized the repurchase of a total of 5,000,000 shares of Matthews' common stock under the program, of which 1,816,146 shares remain available for repurchase as of September 30, 2017. All purchases of the Company's common stock during fiscal 2017 were part of this repurchase program.
In May 2016, the Company purchased 970,000 common shares under the buy-back program from members of the Schawk family, including David A. Schawk (who is a member of the Board of Directors of the Company and the Company's President, SGK Brand Solutions) and certain family members of Mr. Schawk and/or trusts established for the benefit of Mr. Schawk or his family members. The purchase price for the shares purchase was $50.6921625 per share, which was equal to 96.76% of the average of the high and low trading prices for the common stock as reported on the Nasdaq Global Select Market on May 12, 2016.
ITEM 5. MARKET FOR REGISTRANT'S COMMON EQUITY AND RELATED STOCKHOLDER MATTERS, (continued)
The following table shows the monthly fiscal 2017 stock repurchase activity:
|
| | | | | | | | | | | | | |
Period | | Total number of shares purchased | | Weighted-average price paid per share | | Total number of shares purchased as part of a publicly announced plan | | Maximum number of shares that may yet be purchased under the plan |
October 2016 | | — |
| | $ | — |
| | — |
| | 2,028,570 |
|
November 2016 | | 83,293 |
| | 67.49 |
| | 83,293 |
| | 1,945,277 |
|
December 2016 | | 11,936 |
| | 73.63 |
| | 11,936 |
| | 1,933,341 |
|
January 2017 | | — |
| | — |
| | — |
| | 1,933,341 |
|
February 2017 | | 39,918 |
| | 66.98 |
| | 39,918 |
| | 1,893,423 |
|
March 2017 | | — |
| | — |
| | — |
| | 1,893,423 |
|
April 2017 | | 126 |
| | 67.66 |
| | 126 |
| | 1,893,297 |
|
May 2017 | | 38,499 |
| | 63.70 |
| | 38,499 |
| | 1,854,798 |
|
June 2017 | | 260 |
| | 62.55 |
| | 260 |
| | 1,854,538 |
|
July 2017 | | 5,500 |
| | 65.60 |
| | 5,500 |
| | 1,849,038 |
|
August 2017 | | 13,666 |
| | 65.45 |
| | 13,666 |
| | 1,835,372 |
|
September 2017 | | 19,226 |
| | 58.22 |
| | 19,226 |
| | 1,816,146 |
|
Total | | 212,424 |
| | $ | 66.03 |
| | 212,424 |
| | |
|
Holders:
Based on records available to the Company, the number of record holders of the Company's common stock was 611 at October 31, 2017.
Dividends:
A quarterly dividend of $0.19 per share was declared to shareholders of record on November 16, 2017. The Company paid quarterly dividends of $0.17, $0.15, and $0.13 per share for each of the quarters during fiscal 2017, 2016, and 2015, respectively.
Cash dividends have been paid on common shares in every year for at least the past forty-eight years. It is the present intention of the Company to continue to pay quarterly cash dividends on its common stock. However, there is no assurance that dividends will be declared and paid as the declaration and payment of dividends is at the discretion of the Board of Directors of the Company and is dependent upon many factors, including but not limited to the Company's financial condition, results of operations, cash requirements, future prospects and other factors deemed relevant by the Board.
Securities Authorized for Issuance Under Equity Compensation Plans:
See Equity Compensation Plans in Item 12 "Security Ownership of Certain Beneficial Owners and Management" on page 77 of this report.
ITEM 5. MARKET FOR REGISTRANT'S COMMON EQUITY AND RELATED STOCKHOLDER MATTERS, (continued)
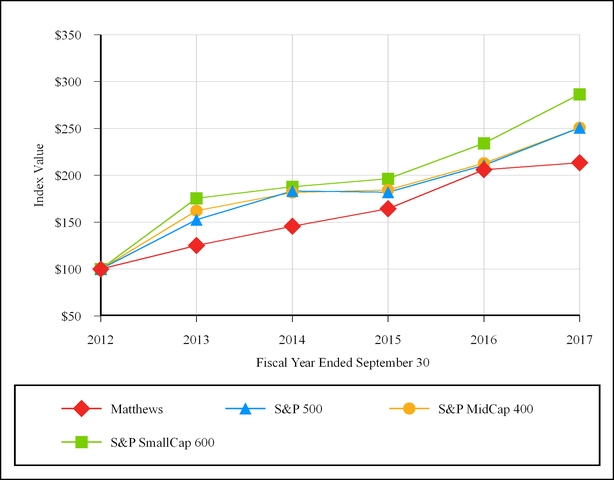
PERFORMANCE GRAPH
COMPARISON OF FIVE-YEAR CUMULATIVE RETURN *
AMONG MATTHEWS INTERNATIONAL CORPORATION,
S&P 500 INDEX, S&P MIDCAP 400 INDEX AND S&P SMALLCAP 600 INDEX
* Total return assumes dividend reinvestment
Note: Performance graph assumes $100 invested on October 1, 2012 in Matthews International Corporation Common Stock, Standard & Poor's (S&P) 500 Index, S&P MidCap 400 Index and S&P SmallCap 600 Index. The results are not necessarily indicative of future performance.
ITEM 6. SELECTED FINANCIAL DATA.
|
| | | | | | | | | | | | | | | | | | | |
| Years Ended September 30, |
| 2017(1) | | 2016(2) | | 2015(3) | | 2014(4) | | 2013(5) |
| (Amounts in thousands, except per share data) (Unaudited) |
Net sales | $ | 1,515,608 |
| | $ | 1,480,464 |
| | $ | 1,426,068 |
| | $ | 1,106,597 |
| | $ | 985,357 |
|
| | | | | | | | | |
Operating profit | 112,603 |
| | 118,815 |
| | 105,023 |
| | 81,522 |
| | 94,615 |
|
| | | | | | | | | |
Interest expense | 26,371 |
| | 24,344 |
| | 20,610 |
| | 12,628 |
| | 12,925 |
|
| | | | | | | | | |
Net income attributable to Matthews shareholders | $ | 74,368 |
| | $ | 66,749 |
| | $ | 63,449 |
| | $ | 42,625 |
| | $ | 54,121 |
|
| | | | | | | | | |
Earnings per common share: | | | | | | | | | |
Basic | $ | 2.31 |
| | $ | 2.04 |
| | $ | 1.93 |
| | $ | 1.51 |
| | $ | 1.96 |
|
Diluted | 2.28 |
| | 2.03 |
| | 1.91 |
| | 1.49 |
| | 1.95 |
|
| | | | | | | | | |
Weighted-average common | | | | | | | | | |
shares outstanding: | | | | | | | | | |
Basic | 32,240 |
| | 32,642 |
| | 32,939 |
| | 28,209 |
| | 27,255 |
|
Diluted | 32,570 |
| | 32,904 |
| | 33,196 |
| | 28,483 |
| | 27,423 |
|
| | | | | | | | | |
Cash dividends per share | $ | 0.68 |
| | $ | 0.60 |
| | $ | 0.54 |
| | $ | 0.46 |
| | $ | 0.41 |
|
| | | | | | | | | |
Total assets | $ | 2,244,649 |
| | $ | 2,091,041 |
| | $ | 2,143,611 |
| | $ | 2,008,026 |
| | $ | 1,209,245 |
|
Long-term debt, non-current | 881,602 |
| | 844,807 |
| | 891,217 |
| | 714,027 |
| | 351,068 |
|
| |
(1) | Fiscal 2017 included net pre-tax charges of $38,458 and income of $10,483, which impacted operating profit and other deductions, respectively. These pre-tax charges primarily consisted of acquisition-related costs, and strategic cost-reduction initiatives. The pre-tax income primarily consisted of loss recoveries, net of related costs, related to the previously disclosed theft of funds by a former employee. |
| |
(2) | Fiscal 2016 included net pre-tax charges of $36,057 and income of $78, which impacted operating profit and other deductions, respectively. These amounts primarily consisted of acquisition-related costs and strategic cost-reduction initiatives. |
| |
(3) | Fiscal 2015 included pre-tax charges of $36,883 and income of $8,726, which impacted operating profit and other deductions, respectively, and also included the unfavorable effect of related adjustments of $1,334 to income tax expense. These amounts primarily consisted of acquisition-related costs, trade name write-offs, strategic cost-reduction initiatives, and losses related to a theft of funds, partially offset by a gain on the settlement of a multi-employer pension plan obligation, and the impact of the favorable settlement of litigation, net of related expenses. |
| |
(4) | Fiscal 2014 included net pre-tax charges of approximately $41,289, primarily related to acquisition-related costs, strategic cost-reduction initiatives, and litigation expenses related to a legal dispute in the Memorialization segment. Charges of $38,598 and $2,691 impacted operating profit and other deductions, respectively. In addition, fiscal 2014 included the unfavorable effect of adjustments of $1,347 to income tax expense related to non-deductible expenses related to acquisition activities. |
| |
(5) | Fiscal 2013 included net pre-tax charges of approximately $15,352, which primarily related to strategic cost-reduction initiatives, incremental costs related to an ERP implementation in the Memorialization segment, acquisition-related costs and an impairment charge related to the carrying value of a trade name. The charges were partially offset by a gain on the final settlement of the purchase price of the remaining ownership interest in one of the Company's subsidiaries and the benefit of adjustments to contingent consideration. |
ITEM 7. MANAGEMENT'S DISCUSSION AND ANALYSIS OF FINANCIAL CONDITION AND RESULTS OF OPERATIONS.
The following discussion should be read in conjunction with the consolidated financial statements of Matthews and related notes thereto. In addition, see "Cautionary Statement Regarding Forward-Looking Information" included in Part I of this Annual Report on Form 10-K.
RESULTS OF OPERATIONS:
The following table sets forth sales and operating profit for the Company's SGK Brand Solutions, Memorialization and Industrial Technologies segments for each of the last three fiscal years.
|
| | | | | | | | | | | |
| Years Ended September 30, |
| 2017 | | 2016 | | 2015 |
| (Dollars in thousands) |
Sales to unaffiliated customers: | | | | | |
SGK Brand Solutions | $ | 770,181 |
| | $ | 755,975 |
| | $ | 798,339 |
|
Memorialization | 615,882 |
| | 610,142 |
| | 508,058 |
|
Industrial Technologies | 129,545 |
| | 114,347 |
| | 119,671 |
|
Consolidated | $ | 1,515,608 |
| | $ | 1,480,464 |
| | $ | 1,426,068 |
|
| | | | | |
Operating Profit: | | | | | |
SGK Brand Solutions | $ | 24,919 |
| | $ | 42,909 |
| | $ | 21,864 |
|
Memorialization | 80,652 |
| | 68,252 |
| | 70,064 |
|
Industrial Technologies | 7,032 |
| | 7,654 |
| | 13,095 |
|
Consolidated | $ | 112,603 |
| | $ | 118,815 |
| | $ | 105,023 |
|
Comparison of Fiscal 2017 and Fiscal 2016:
Sales for the year ended September 30, 2017 were $1.52 billion, compared to $1.48 billion for the year ended September 30, 2016. The increase in fiscal 2017 sales of $35.1 million principally reflected higher sales of cemetery memorial products and cremation equipment, increased sales in the U.K. and Asia Pacific brand markets, higher sales of marking products, and the benefits from recently completed acquisitions (see "Acquisitions" below). These increases were partially offset by slower market conditions in North America and Europe for the SGK Brand Solutions segment, lower unit sales of caskets, and the unfavorable impact of changes in foreign currencies against the U.S. dollar of $12.8 million compared to a year ago.
In the SGK Brand Solutions segment, sales for fiscal 2017 were $770.2 million, compared to $756.0 million in fiscal 2016. The increase in sales reflected sales growth in the U.K. and Asia Pacific markets, and the completion of three acquisitions during the second quarter of fiscal 2017. These sales increases were partially offset by slower brand market conditions in the U.S. and Europe, and the unfavorable impact of changes in foreign currency values against the U.S. dollar of approximately $12.1 million. Memorialization segment sales for fiscal 2017 were $615.9 million compared to $610.1 million for fiscal 2016. The sales increase reflected higher sales of cemetery memorial products and cremation equipment, partially offset by lower unit sales of caskets (reflecting an estimated decline in U.S. casketed deaths). Industrial Technologies segment sales for fiscal 2017 were $129.5 million, compared to $114.3 million for fiscal 2016. The increase reflected higher sales of marking products and OEM solutions, and the favorable impact of recently completed acquisitions, partially offset by lower sales of fulfillment systems and the unfavorable impact of changes in foreign currency values against the U.S. dollar of approximately $690,000.
ITEM 7. MANAGEMENT'S DISCUSSION AND ANALYSIS, (continued)
Gross profit for the year ended September 30, 2017 was $563.4 million, compared to $556.5 million for fiscal 2016. The increase in gross profit primarily reflected the impact of higher sales from recent acquisitions, the benefits of productivity initiatives, and realization of acquisition synergies, partially offset by unfavorable changes in foreign currency values against the U.S. dollar, and slower market conditions in North America and Europe for the SGK Brand Solutions segment. Fiscal 2017 gross profit also included an expense of $2.0 million for the write-off of inventory step-up value related to the current year acquisitions. Fiscal 2016 gross profit included an expense of approximately $4.0 million for the partial write-off of inventory step-up value related to the acquisition of Aurora Products Group, LLC ("Aurora") in August 2015.
Selling and administrative expenses for the year ended September 30, 2017 were $450.8 million, compared to $437.6 million for fiscal 2016. Consolidated selling and administrative expenses as a percent of sales were 29.7% for fiscal 2017, compared to 29.6% in fiscal 2016. The increase in selling and administrative expenses reflected the impact of recently completed acquisitions, partially offset by the benefits from cost-reduction initiatives, including acquisition integration synergies. Selling and administrative expenses in fiscal 2017 also included an increase of $3.7 million in intangible asset amortization related to recently completed acquisitions, and $3.3 million of incremental stock-based compensation expense that was recognized in the first fiscal quarter of fiscal 2017 as a result of required accounting treatment for retirement-eligible employees. Selling and administrative expenses also included acquisition integration and related systems-integration costs, and other charges in connection with cost structure initiatives totaling $35.2 million in fiscal 2017, compared to $32.1 million in fiscal 2016.
Operating profit for fiscal 2017 was $112.6 million, compared to $118.8 million for fiscal 2016. The SGK Brand Solutions segment operating profit for fiscal 2017 was $24.9 million, compared to $42.9 million for fiscal 2016. Fiscal 2017 operating profit for the SGK Brand Solutions segment included acquisition integration costs and other charges totaling $29.7 million, compared to $25.0 million in fiscal 2016. Segment operating profit in fiscal 2017 also included an increase of $3.1 million in intangible asset amortization related to recently completed acquisitions. Additionally, fiscal 2017 operating profit for SGK Brand Solutions reflected slower market conditions in North America and Europe, and the unfavorable impact of changes in foreign currencies against the U.S. dollar of approximately $1.3 million, partially offset by the favorable impact of recent acquisitions. Memorialization segment operating profit for fiscal 2017 was $80.7 million, compared to $68.3 million for fiscal 2016. The increase in segment operating profit reflected higher cemetery memorial and cremation equipment sales, and the benefits of acquisition synergies and other productivity initiatives, partially offset by the impact of lower casket sales. Fiscal 2017 operating profit for the Memorialization segment also included acquisition integration costs and other charges totaling $7.8 million, compared to $10.4 million in fiscal 2016. Operating profit for the Industrial Technologies segment for fiscal 2017 was $7.0 million, compared to $7.7 million in fiscal 2016. The benefits of higher sales were offset by higher investments in the segment's product development, and an increase in acquisition related charge.
Investment income for the year ended September 30, 2017 was $2.5 million, compared to $2.1 million for the year ended September 30, 2016. The increase reflected higher rates of return on investments held in trust for certain of the Company's benefit plans. Interest expense for fiscal 2017 was $26.4 million, compared to $24.3 million in fiscal 2016. The increase in interest expense reflected higher average interest rates in the current fiscal year and an increase in average borrowing levels, primarily related to acquisitions. Other income (deductions), net, for the year ended September 30, 2017 represented an increase in pre-tax income of $7.6 million, compared to a decrease in pre-tax income of $1.3 million in fiscal 2016. Other income and deductions generally include banking-related fees and the impact of currency gains and losses on certain intercompany debt and foreign denominated cash balances. Fiscal 2017 other income and deductions also included loss recoveries of $11.3 million related to the previously disclosed theft of funds by a former employee initially identified in fiscal 2015.
ITEM 7. MANAGEMENT'S DISCUSSION AND ANALYSIS, (continued)
The Company's effective tax rate for fiscal 2017 was 23.2%, compared to 30.5% for fiscal 2016. Fiscal 2017 reflects the benefits from lower foreign taxes, organizational structure changes, primarily initiated in connection with acquisition integration, increased benefits from credits and incentives, and the impact of other tax benefits specific to the current year. The difference between the Company's effective tax rate and the Federal statutory rate of 35.0% primarily reflected lower foreign income taxes and the benefit of credits and incentives, offset by the impact of state taxes.
Net losses attributable to noncontrolling interests was $435,000 in fiscal 2017, compared to $588,000 in fiscal 2016. The net losses attributable to noncontrolling interests primarily reflected losses in less than wholly-owned Memorialization and Industrial Technologies businesses.
Comparison of Fiscal 2016 and Fiscal 2015:
Sales for the year ended September 30, 2016 were $1.48 billion, compared to $1.43 billion for the year ended September 30, 2015. The increase in fiscal 2016 sales of $54.4 million principally reflected the acquisition of Aurora and higher sales volume of memorial products. The unfavorable impact of changes in foreign currencies against the U.S. dollar of approximately $25.2 million partially offset this increase.
In the SGK Brand Solutions segment, sales for fiscal 2016 were $756.0 million, compared to $798.3 million in fiscal 2015. The decrease in sales reflected the unfavorable impact of changes in foreign currency values against the U.S. dollar of approximately $21.4 million and the fiscal 2015 divestiture of a small software business. In addition, the segment experienced slower market conditions in the U.S. and Europe during fiscal 2016. Memorialization segment sales for fiscal 2016 were $610.1 million compared to $508.1 million for fiscal 2015. The increase in sales resulted principally from the acquisition of Aurora ($113.3 million) and higher sales of bronze and granite memorials, partially offset by lower unit sales of caskets and the unfavorable impact of changes in foreign currency values against the U.S. dollar of approximately $2.8 million. Based on published CDC data, the Company estimated that the number of casketed deaths in the U.S. declined compared to fiscal 2015. Industrial Technologies segment sales for fiscal 2016 were $114.3 million, compared to $119.7 million for fiscal 2015. Industrial Technologies segment sales reflected lower fulfillment systems sales primarily due to slower market conditions in the current year. Changes in foreign currency values against the U.S. dollar also had an unfavorable impact of approximately $1.0 million on the segment's sales. These declines in segment sales were partially offset by the favorable impact of the Digital Designs, Inc. ("DDI") acquisition.
Gross profit for the year ended September 30, 2016 was $556.5 million, compared to $529.4 million for fiscal 2015. Consolidated gross profit as a percent of sales was 37.6% and 37.1% for fiscal 2016 and fiscal 2015, respectively. The increase in gross profit primarily reflected the impact of higher sales. Gross profit included expenses for the write-off of inventory step-up value related to the Aurora acquisition totaling $4.0 million and $1.8 million in fiscal 2016 and 2015, respectively. The improvement in gross profit as a percent of sales reflected the favorable impact of cost-reduction initiatives (including acquisition synergy realization), and lower commodity costs, partially offset by the write-off of Aurora inventory step-up value.
Selling and administrative expenses for the year ended September 30, 2016 were $437.6 million, compared to $424.4 million for fiscal 2015. Consolidated selling and administrative expenses as a percent of sales were 29.6% for fiscal 2016, compared to 29.8% in fiscal 2015. The increase in selling and administrative expenses was primarily attributable to the acquisition of Aurora, partially offset by benefits from cost-reduction initiatives in the SGK Brand Solutions segment, resulting primarily from acquisition integration activities. In addition, fiscal 2016 selling and administrative expenses included acquisition integration costs and other charges totaling $32.1 million, and an increase of $3.1 million in intangible asset amortization related to the Aurora acquisition. Fiscal 2015 selling and administrative expenses included acquisition-related expenses of $37.1 million primarily related to the Schawk, Inc. ("Schawk") acquisition integration activities and Aurora transaction expenses, trade name write-offs of $4.8 million and expenses related to strategic cost-reduction initiatives of $2.2 million, partially offset by the impact of the favorable settlement of litigation, net of related expenses, in the Memorialization segment of $9.0 million.
ITEM 7. MANAGEMENT'S DISCUSSION AND ANALYSIS, (continued)
Operating profit for fiscal 2016 was $118.8 million, compared to $105.0 million for fiscal 2015. The SGK Brand Solutions segment operating profit for fiscal 2016 was $42.9 million, compared to $21.9 million for fiscal 2015. The increase in segment operating profit principally resulted from cost reductions primarily as a result of acquisition integration activities, partially offset by a decline in sales, and the unfavorable impact of changes in foreign currency values against the U.S. dollar of approximately $1.2 million. Additionally, operating profit for the SGK Brand Solutions segment included expenses of $25.0 million for cost reduction initiatives (primarily related to acquisition integration) in fiscal 2016. SGK Brand Solutions operating profit in fiscal 2015 included charges totaling $39.5 million representing acquisition integration expenses, trade name write-offs, and expenses related to strategic cost-reduction initiatives. Memorialization segment operating profit for fiscal 2016 was $68.3 million, compared to $70.1 million for fiscal 2015. Segment operating profit was favorably impacted by the Aurora acquisition, which was more than offset by charges totaling $10.4 million primarily representing acquisition integration costs, a $3.1 million increase in intangible asset amortization as a result of the Aurora acquisition, and lower casket sales. Memorialization segment operating profit in fiscal 2015 was unfavorably impacted by charges totaling $6.4 million, primarily consisting of acquisition-related costs, and expenses related to productivity improvements and strategic cost-reduction initiatives. Memorialization segment operating profit in fiscal 2015 also reflected the favorable impact of the settlement of litigation, net of related expenses, of $9.0 million. Operating profit for the Industrial Technologies segment for fiscal 2016 was $7.7 million, compared to $13.1 million in fiscal 2015, primarily reflecting lower sales and an unfavorable change in product mix in fiscal 2016.
Investment income for the year ended September 30, 2016 was $2.1 million, compared to $175,000 for the year ended September 30, 2015. The increase reflected higher rates of return on investments held in trust for certain of the Company's benefit plans. Interest expense for fiscal 2016 was $24.3 million, compared to $20.6 million in fiscal 2015. The increase in interest expense primarily reflected higher average debt levels resulting from the acquisition of Aurora in August 2015. Other income (deductions), net, for the year ended September 30, 2016 represented a decrease in pre-tax income of $1.3 million, compared to an increase in pre-tax income of $5.1 million in fiscal 2015. Other income and deductions generally include banking-related fees and the impact of currency gains and losses on certain intercompany debt and foreign denominated receivables and payables. Fiscal 2015 other income and deductions included an $11.5 million gain on the settlement of a multi-employer pension plan installment payment obligation, and $2.3 million of losses related to a theft of funds by an employee that had occurred over a multi-year period.
The Company's effective tax rate for fiscal 2016 was 30.5%, compared to 29.4% for fiscal 2015. The effective tax rates for both years primarily reflected the favorable impact of the utilization of certain tax attributes with the Company’s U.S. and foreign legal entity structure. The difference between the Company's effective tax rate and the Federal statutory rate of 35.0% primarily reflected lower foreign income taxes offset by the impact of state taxes.
Net losses attributable to noncontrolling interests was $588,000 in fiscal 2016, compared to $161,000 in fiscal 2015. The net losses attributable to noncontrolling interests primarily reflected losses in less than wholly-owned Memorialization and Industrial Technologies businesses.
LIQUIDITY AND CAPITAL RESOURCES:
Net cash provided by operating activities was $149.3 million for the year ended September 30, 2017, compared to $140.3 million and $141.1 million for fiscal years 2016 and 2015, respectively. Operating cash flow for fiscal 2017 principally included net income adjusted for depreciation and amortization, stock-based compensation expense, and non-cash pension expense, and a decrease in working capital items, partially offset by cash contributions of $8.7 million to the Company's pension and other postretirement plans. Operating cash flow for fiscal 2016 principally included net income adjusted for depreciation and amortization, stock-based compensation expense, and non-cash pension expense, and a decrease in working capital items, partially offset by cash contributions of $18.9 million to the Company's pension and other postretirement plans. Operating cash flow for fiscal 2015 principally included net income adjusted for depreciation and amortization, stock-based compensation expense, trade name write-offs, and an increase in deferred taxes, partially offset by an increase in working capital items and cash contributions of $3.3 million to the Company's pension and other postretirement plans.
ITEM 7. MANAGEMENT'S DISCUSSION AND ANALYSIS, (continued)
Cash used in investing activities was $141.6 million for the year ended September 30, 2017, compared to $47.1 million and $263.2 million for fiscal years 2016 and 2015, respectively. Investing activities for fiscal 2017 primarily reflected capital expenditures of $44.9 million and acquisition payments (net of cash acquired or received from sellers) of $98.2 million (see "Acquisitions" below). Investing activities for fiscal 2016 primarily reflected capital expenditures of $41.7 million and acquisition payments (net of cash acquired or received from sellers) of $6.9 million, primarily for the DDI acquisition. Investing activities for fiscal 2015 primarily reflected capital expenditures of $48.3 million, acquisition payments (net of cash acquired) of $213.5 million, primarily for the Aurora acquisition, net proceeds of $10.4 million from the sale of a subsidiary, and payment of $12.9 million related to a letter of credit issued for a customer (see discussion below).
Capital expenditures were $44.9 million for the year ended September 30, 2017, compared to $41.7 million and $48.3 million for fiscal 2016 and 2015, respectively. Capital expenditures in each of the last three fiscal years reflected reinvestments in the Company's business segments and were made primarily for the purchase of new production machinery, equipment, software and systems, and facilities designed to improve product quality, increase manufacturing efficiency, lower production costs and meet regulatory requirements. Capital spending for property, plant and equipment has averaged $45.0 million for the last three fiscal years. Capital expenditures for the last three fiscal years were primarily financed through operating cash. Capital spending for fiscal 2018 is currently expected to be in the range of $45 million to $50 million. The Company expects to generate sufficient cash from operations to fund all anticipated capital spending projects.
Cash used in financing activities for the year ended September 30, 2017 was $7.2 million, and reflected proceeds, net of repayments, on long-term debt of $28.6 million, purchases of treasury stock of $14.0 million, and payment of dividends to the Company's shareholders of $21.8 million ($0.68 per share). Cash used in financing activities for the year ended September 30, 2016 was $108.8 million, and reflected repayments, net of proceeds, on long-term debt of $30.0 million, purchases of treasury stock of $58.0 million, proceeds from stock option exercises of $6.4 million, payment of dividends to the Company's shareholders of $19.4 million ($0.60 per share), acquisition of noncontrolling interest of $5.6 million, and payment of deferred financing fees of $2.3 million. Cash provided by financing activities for the year ended September 30, 2015 was $131.2 million, and reflected proceeds, net of repayments, on long-term debt of $179.2 million, purchases of treasury stock of $14.6 million, payment of contingent consideration of $484,000, proceeds from stock option exercises of $4.0 million, payment of dividends to the Company's shareholders of $17.8 million ($0.54 per share), and payment of $18.2 million to settle a multi-employer pension plan installment payment obligation.
The Company has a domestic credit facility with a syndicate of financial institutions that includes a $900.0 million senior secured revolving credit facility and a $250.0 million senior secured amortizing term loan. The term loan requires scheduled principal payments of 5.0% of the outstanding principal in year one, 7.5% in year two, and 10.0% in years three through five, payable in quarterly installments. The balance of the revolving credit facility and the term loan are due on the maturity date of April 26, 2021. Borrowings under both the revolving credit facility and the term loan bear interest at LIBOR plus a factor ranging from 0.75% to 2.00% (1.75% at September 30, 2017) based on the Company's leverage ratio. The leverage ratio is defined as net indebtedness divided by adjusted EBITDA (earnings before interest, taxes, depreciation and amortization). The Company is required to pay an annual commitment fee ranging from 0.15% to 0.25% (based on the Company's leverage ratio) of the unused portion of the revolving credit facility.
The domestic credit facility requires the Company to maintain certain leverage and interest coverage ratios. A portion of the facility (not to exceed $35.0 million) is available for the issuance of trade and standby letters of credit. Outstanding borrowings on the revolving credit facility at September 30, 2017 and 2016 were $525.0 million and $608.0 million, respectively. Outstanding borrowings on the term loan at September 30, 2017 and 2016 were $232.5 million and $246.4 million, respectively. The weighted-average interest rate on outstanding borrowings for the domestic credit facility (including the effects of interest rate swaps) at September 30, 2017 and 2016 was 3.01% and 2.59%, respectively.
ITEM 7. MANAGEMENT'S DISCUSSION AND ANALYSIS, (continued)
During fiscal 2017, the Company entered into a two-year $115.0 million accounts receivable securitization facility (the "Securitization Facility") with certain financial institutions. Under the Securitization Facility, the Company and certain of its domestic subsidiaries sell, on a continuous basis without recourse, their trade receivables to Matthews Receivables Funding Corporation, LLC (“Matthews RFC”), a wholly-owned bankruptcy-remote subsidiary of the Company. Matthews RFC in turn assigns a collateral interest in these receivables to certain financial institutions, and then may borrow funds under the Securitization Facility. The Securitization Facility does not qualify for sale treatment. Accordingly, the trade receivables and related debt obligations remain on the Company's Consolidated Balance Sheet. Borrowings under the Securitization Facility bear interest at LIBOR plus 0.75%. The Company is required to pay an annual commitment fee ranging from 0.25% to 0.35% of the unused portion of the Securitization Facility. The Company had $95.8 million in outstanding borrowings under the Securitization Facility as of September 30, 2017. At September 30, 2017, the interest rate on borrowings under this facility was 1.98%.
The following table presents information related to interest rate contracts entered into by the Company and designated as cash flow hedges:
|
| | | | | | | | |
| | September 30, 2017 | | September 30, 2016 |
| | (Dollars in thousands) |
Pay fixed swaps - notional amount | | $ | 414,063 |
| | $ | 403,125 |
|
Net unrealized gain (loss) | | $ | 3,959 |
| | $ | (5,834 | ) |
Weighted-average maturity period (years) | | 3.3 |
| | 3.9 |
|
Weighted-average received rate | | 1.23 | % | | 0.53 | % |
Weighted-average pay rate | | 1.34 | % | | 1.26 | % |
The Company enters into interest rate swaps in order to achieve a mix of fixed and variable rate debt that it deems appropriate. The interest rate swaps have been designated as cash flow hedges of future variable interest payments which are considered probable of occurring. Based on the Company's assessment, all of the critical terms of each of the hedges matched the underlying terms of the hedged debt and related forecasted interest payments, and as such, these hedges were considered highly effective.
The fair value of the interest rate swaps reflected an unrealized gain, net of unrealized losses, of $4.0 million ($2.4 million after tax) and an unrealized loss, net of unrealized gains, of $5.8 million ($3.6 million after tax) at September 30, 2017 and 2016, respectively, that is included in shareholders' equity as part of accumulated other comprehensive income ("AOCI"). Assuming market rates remain constant with the rates at September 30, 2017, a gain (net of tax) of approximately $666,000 included in AOCI is expected to be recognized in earnings over the next twelve months.
The Company, through certain of its European subsidiaries, has a credit facility with a European bank, which is guaranteed by Matthews International Corporation. The maximum amount of borrowings available under this facility is €35.0 million ($41.3 million). The credit facility matures in December 2018 and the Company intends to extend this facility. Outstanding borrowings under this facility were €22.1 million ($26.1 million) at September 30, 2017. There were no outstanding borrowings under this facility at September 30, 2016. The weighted-average interest rate on this facility at September 30, 2017 was 1.75%.
In November 2016, the Company’s German subsidiary, Matthews Europe GmbH & Co. KG, issued €15.0 million ($17.7 million at September 30, 2017) of senior unsecured notes with European banks. The notes are guaranteed by Matthews International Corporation and mature in November 2019. A portion of the notes (€5.0 million) have a fixed interest rate of 1.40%, and the remainder bear interest at Euro LIBOR plus 1.40%. The weighted-average interest rate on the notes at September 30, 2017 was 1.40%.
ITEM 7. MANAGEMENT'S DISCUSSION AND ANALYSIS, (continued)
The Company, through its Italian subsidiary, Matthews International S.p.A., has several loans with various Italian banks. Outstanding borrowings on these loans totaled €2.6 million ($3.1 million) and €3.2 million ($3.5 million) at September 30, 2017 and 2016, respectively. The maturity dates for these loans range from October 2017 through November 2019. Matthews International S.p.A. also has multiple on-demand lines of credit totaling €11.3 million ($13.4 million) with the same Italian banks. Outstanding borrowings on these lines were €4.0 million ($4.7 million) and €5.2 million ($5.8 million) at September 30, 2017 and 2016, respectively. The weighted-average interest rate on outstanding Matthews International S.p.A. borrowings at September 30, 2017 and 2016 was 2.2% and 1.8%, respectively.
Other debt totaled $1.0 million and $4.6 million at September 30, 2017 and 2016, respectively. The weighted-average interest rate on these outstanding borrowings was 5.04% and 3.31% at September 30, 2017 and 2016, respectively.
In September 2014, a claim was filed seeking to draw upon a letter of credit issued by the Company of £8.6 million ($11.5 million at September 30, 2017) with respect to a performance guarantee on a project in Saudi Arabia. Management assessed the customer's demand to be without merit and initiated an action with the court in the United Kingdom (the "Court"). Pursuant to this action, an order was issued by the Court in January 2015 requiring that, upon receipt by the customer, the funds were to be remitted by the customer to the Court pending resolution of the dispute between the parties. As a result, the Company made payment on the draw to the financial institution for the letter of credit and the funds were ultimately received by the customer. The customer did not remit the funds to the Court as ordered. On June 14, 2016, the Court ruled completely in favor of Matthews following a trial on the merits. However, as the customer has neither yet remitted the funds nor complied with the final, un-appealed orders of the Court, it is possible the resolution of this matter could have an unfavorable financial impact on Matthews’ results of operations. As of September 30, 2017, the Company has determined that resolution of this matter may take an extended period of time and therefore has reclassified the funded letter of credit from other current assets to other assets on the Consolidated Balance Sheet. The Company will continue to assess collectability related to this matter as facts and circumstances evolve. As of September 30, 2016, the Company presented the funded letter of credit within other current assets on the Consolidated Balance Sheet.
The Company has a stock repurchase program. The buy-back program is designed to increase shareholder value, enlarge the Company's holdings of its common stock, and add to earnings per share. Repurchased shares may be retained in treasury, utilized for acquisitions, or reissued to employees or other purchasers, subject to the restrictions of the Company's Restated Articles of Incorporation. Under the current authorization, the Company's Board of Directors has authorized the repurchase of a total of 5,000,000 shares of Matthews' common stock under the program, of which 1,816,146 shares remain available for repurchase as of September 30, 2017.
In May 2016, the Company purchased 970,000 common shares under the buy-back program from members of the Schawk family, including David A. Schawk (who is a member of the Board of Directors of the Company and the Company's President, SGK Brand Solutions) and certain family members of Mr. Schawk and/or trusts established for the benefit of Mr. Schawk or his family members. The purchase price for the shares purchase was $50.6921625 per share, which was equal to 96.76% of the average of the high and low trading prices for the common stock as reported on the Nasdaq Global Select Market on May 12, 2016.
At September 30, 2017, approximately $56.2 million of cash and cash equivalents were held by international subsidiaries whose undistributed earnings are considered permanently reinvested. The Company's intent is to reinvest these funds in our international operations and current plans do not demonstrate a need to repatriate them to fund U.S. operations. If the Company decides at a later date to repatriate these funds to the U.S., it may be required to provide taxes on these amounts based on the applicable U.S. tax rates net of credits for foreign taxes already paid.
Consolidated working capital was $309.9 million at September 30, 2017, compared to $314.8 million at September 30, 2016. Cash and cash equivalents were $57.5 million at September 30, 2017, compared to $55.7 million at September 30, 2016. The Company's current ratio was 2.1 and 2.2 at September 30, 2017 and 2016, respectively.
ITEM 7. MANAGEMENT'S DISCUSSION AND ANALYSIS, (continued)
ENVIRONMENTAL MATTERS:
The Company's operations are subject to various federal, state and local laws and regulations relating to the protection of the environment. The Company is party to various environmental matters which include obligations to investigate and mitigate the effects on the environment of the disposal of certain materials at various operating and non-operating sites. The Company is currently performing environmental assessments and remediation at these sites, as appropriate. Refer to Note 16, "Environmental Matters" in Item 8 - "Financial Statements and Supplementary Data," for further details.
ACQUISITIONS:
Refer to Note 19, "Acquisitions" in Item 8 - "Financial Statements and Supplementary Data," for further details on the Company's acquisitions.
FORWARD-LOOKING INFORMATION:
The Company's current strategy to attain annual growth in earnings per share primarily consists of the following: internal growth (which includes organic growth, cost structure and productivity improvements, new product development and the expansion into new markets with existing products), acquisitions and integration activities to achieve synergy benefits.
With respect to fiscal 2018, the Company expects to continue to devote a significant level of effort to the integration of recent acquisitions, including systems integration. Due to the size of these acquisitions and the projected synergy benefits from integration, these efforts are anticipated to continue for an extended period of time. The costs associated with these integrations will impact the Company's operating results for fiscal 2018. Consistent with its practice, the Company plans to identify these costs on a quarterly basis as incurred.
CRITICAL ACCOUNTING POLICIES:
The preparation of financial statements in conformity with generally accepted accounting principles requires management to make estimates and assumptions that affect the reported amounts of assets and liabilities and disclosure of contingent assets and liabilities at the date of the financial statements and the reported amounts of revenues and expenses during the reporting period. Therefore, the determination of estimates requires the exercise of judgment based on various assumptions and other factors such as historical experience, economic conditions, and in some cases, actuarial techniques. Actual results may differ from those estimates. A discussion of market risks affecting the Company can be found in Item 7A, "Quantitative and Qualitative Disclosures about Market Risk," of this Annual Report on Form 10-K.
The Company's significant accounting policies are included in the Notes to Consolidated Financial Statements included in this Annual Report on Form 10-K. Management believes that the application of these policies on a consistent basis enables the Company to provide useful and reliable financial information about the Company's operating results and financial condition. The following accounting policies involve significant estimates, which were considered critical to the preparation of the Company's consolidated financial statements for the year ended September 30, 2017.
ITEM 7. MANAGEMENT'S DISCUSSION AND ANALYSIS, (continued)
Long-Lived Assets, including Property, Plant and Equipment:
Long-lived assets are recorded at their respective cost basis on the date of acquisition. Depreciation on property, plant and equipment is computed primarily on the straight-line method over the estimated useful lives of the assets. Intangible assets with finite useful lives are amortized over their estimated useful lives. The Company reviews long-lived assets, including property, plant and equipment, and intangibles with finite useful lives, whenever events or changes in circumstances indicate that the carrying amount of such assets may not be recoverable. Recoverability of assets is determined by evaluating the estimated undiscounted net cash flows of the operations to which the assets relate. An impairment loss would be recognized when the carrying amount of the assets exceeds the fair value, which is based on a discounted cash flow analysis.
Goodwill and Indefinite-Lived Intangibles:
Goodwill and intangible assets with indefinite useful lives are not amortized, but are tested annually for impairment, or when circumstances indicate that a possible impairment may exist. In general, when the carrying value of these assets exceeds the implied fair value, an impairment loss must be recognized. A significant decline in cash flows generated from these assets may result in a write-down of the carrying values of the related assets. For purposes of testing goodwill for impairment, the Company uses a combination of valuation techniques, including discounted cash flows. A number of assumptions and estimates are involved in the application of the discounted cash flow model to forecast operating cash flows, including sales volumes and pricing, costs to produce, tax rates, capital spending, working capital changes, and discount rates. The Company estimates future cash flows using volume and pricing assumptions based largely on existing customer relationships and contracts, and operating cost assumptions management believes are reasonable based on historical performance and projected future performance as reflected in its most recent operating plans and projections. The discount rates used in the discounted cash flow analyses are developed with the assistance of valuation experts and management believes the discount rates appropriately reflect the risks associated with the Company's operating cash flows. In order to further validate the reasonableness of the estimated fair values of the reporting units as of the valuation date, a reconciliation of the aggregate fair values of all reporting units to market capitalization is performed using a reasonable control premium.
The Company performed its annual impairment review of goodwill and indefinite-lived intangible assets in the second quarter of fiscal 2017. The Company determined that the estimated fair value for all goodwill reporting units exceeded carrying value, therefore no adjustments to the carrying value of goodwill were necessary at March 31, 2017. There were no impairments identified during the Company's annual assessment of indefinite-lived intangible assets.
Pension and Postretirement Benefits:
Pension assets and liabilities are determined on an actuarial basis and are affected by the market value of plan assets, estimates of the expected return on plan assets and the discount rate used to determine the present value of benefit obligations. Actual changes in the fair market value of plan assets and differences between the actual return on plan assets, the expected return on plan assets and changes in the selected discount rate will affect the amount of pension cost.
The Company's principal pension plan maintains a substantial portion of its assets in equity securities in accordance with the investment policy established by the Company's pension board. Based on an analysis of the historical performance of the plan's assets and information provided by its independent investment advisor, the Company set the long-term rate of return assumption for these assets at 6.75% at September 30, 2016 for purposes of determining fiscal 2017 pension cost. The Company's discount rate assumption used in determining the present value of the projected benefit obligation is based upon published indices as of September 30, 2017 and September 30, 2016 for the fiscal year end valuation. The discount rate was 3.76%, 3.51% and 4.25% in fiscal 2017, 2016 and 2015, respectively. Refer to Item 7A, "Quantitative and Qualitative Disclosures about Market Risk," of this Annual Report on Form 10-K, for disclosure about the hypothetical impact of changes in actuarial assumptions.
ITEM 7. MANAGEMENT'S DISCUSSION AND ANALYSIS, (continued)
Income Taxes:
Deferred tax assets and liabilities are provided for the differences between the financial statement and tax bases of assets and liabilities using enacted tax rates in effect for the years in which the differences are expected to reverse. Valuation allowances are recorded to reduce deferred tax assets when it is more likely than not that a tax benefit will not be realized. Deferred income taxes for U.S. tax purposes have not been provided on certain undistributed earnings of foreign subsidiaries, as such earnings are considered to be reinvested indefinitely. To the extent earnings are expected to be returned in the foreseeable future, the associated deferred tax liabilities are provided. The Company has not determined the deferred tax liability associated with these undistributed earnings, as such determination is not practicable, due to the complexities of the hypothetical calculation.
LONG-TERM CONTRACTUAL OBLIGATIONS AND COMMITMENTS:
The following table summarizes the Company's contractual obligations at September 30, 2017, and the effect such obligations are expected to have on its liquidity and cash flows in future periods.
|
| | | | | | | | | | | | | | | | | | | |
| | | Payments due in fiscal year: |
| Total | | 2018 | | 2019 to 2020 | | 2021 to 2022 | | After 2022 |
Contractual Cash Obligations: | (Dollar amounts in thousands) |
Revolving credit facilities | $ | 551,126 |
| | $ | — |
| | $ | 26,126 |
| | $ | 525,000 |
| | $ | — |
|
Securitization facility | 95,825 |
| | — |
| | 95,825 |
| | — |
| | — |
|
Senior secured term loan | 232,479 |
| | 20,313 |
| | 50,000 |
| | 162,166 |
| | — |
|
Notes payable to banks | 21,831 |
| | 3,375 |
| | 18,456 |
| | — |
| | — |
|
Short-term borrowings | 4,735 |
| | 4,735 |
| | — |
| | — |
| | — |
|
Capital lease obligations | 6,519 |
| | 1,281 |
| | 1,371 |
| | 1,074 |
| | 2,793 |
|
Non-cancelable operating leases | 75,708 |
| | 21,939 |
| | 27,554 |
| | 13,835 |
| | 12,380 |
|
Total contractual cash obligations | $ | 988,223 |
| | $ | 51,643 |
|
| $ | 219,332 |
| | $ | 702,075 |
| | $ | 15,173 |
|
A significant portion of the loans included in the table above bear interest at variable rates. At September 30, 2017, the weighted-average interest rate was 3.01% on the Company's domestic credit facility, 1.98% on the Company's Securitization Facility, 1.75% on the credit facility through the Company's European subsidiaries, 1.40% on notes issued by the Company's wholly-owned subsidiary, Matthews Europe GmbH & Co. KG, 2.20% on bank loans to the Company's wholly-owned subsidiary, Matthews International S.p.A., and 5.04% on other outstanding debt.
Benefit payments under the Company's principal retirement plan are made from plan assets, while benefit payments under the supplemental retirement plan and postretirement benefit plan are funded from the Company's operating cash. Under I.R.S. regulations, the Company was required to make a $5.1 million contribution to its principal retirement plan in fiscal 2017.
The Company is not required to make any significant cash contributions to its principal retirement plan in fiscal 2018. The Company estimates that benefit payments to participants under its retirement plans (including its supplemental retirement plan) and postretirement benefit payments will be approximately $10.1 million and $1.0 million, respectively, in fiscal 2018. The amounts are expected to increase incrementally each year thereafter, to $12.8 million and $1.1 million, respectively, in 2022. The Company believes that its current liquidity sources, combined with its operating cash flow and borrowing capacity, will be sufficient to meet its capital needs for the foreseeable future.
ITEM 7. MANAGEMENT'S DISCUSSION AND ANALYSIS, (continued)
Unrecognized tax benefits are positions taken, or expected to be taken, on an income tax return that may result in additional payments to tax authorities. If a tax authority agrees with the tax position taken, or expected to be taken, or the applicable statute of limitations expires, then additional payments will not be necessary. As of September 30, 2017, the Company had unrecognized tax benefits, excluding penalties and interest, of approximately $8.0 million. The timing of potential future payments related to the unrecognized tax benefits is not presently determinable. The Company believes that its current liquidity sources, combined with its operating cash flow and borrowing capacity, will be sufficient to meet its capital needs for the foreseeable future.
INFLATION:
Except for the volatility in the cost of bronze ingot, steel, wood and fuel (see "Results of Operations"), inflation has not had a material impact on the Company over the past three years nor is it anticipated to have a material impact for the foreseeable future.
RECENTLY ISSUED ACCOUNTING PRONOUNCEMENTS:
Refer to Note 3, "Accounting Pronouncements" in Item 8 - "Financial Statements and Supplementary Data," for further details on recently issued accounting pronouncements.
ITEM 7A. QUANTITATIVE AND QUALITATIVE DISCLOSURES ABOUT MARKET RISK:
The following discussion about the Company's market risk involves forward-looking statements. Actual results could differ materially from those projected in the forward-looking statements. The Company has market risk related to changes in interest rates, commodity prices and foreign currency exchange rates. The Company does not generally use derivative financial instruments in connection with these market risks, except as noted below.
Interest Rates - The Company's most significant long-term debt instrument is the domestic credit facility, which bears interest at variable rates based on LIBOR.
The following table presents information related to interest rate contracts entered into by the Company and designated as cash flow hedges:
|
| | | | | | | | |
| | September 30, 2017 | | September 30, 2016 |
| | (Dollars in thousands) |
Pay fixed swaps - notional amount | | $ | 414,063 |
| | $ | 403,125 |
|
Net unrealized gain (loss) | | $ | 3,959 |
| | $ | (5,834 | ) |
Weighted-average maturity period (years) | | 3.3 |
| | 3.9 |
|
Weighted-average received rate | | 1.23 | % | | 0.53 | % |
Weighted-average pay rate | | 1.34 | % | | 1.26 | % |
The interest rate swaps have been designated as cash flow hedges of the future variable interest payments which are considered probable of occurring. Based on the Company's assessment, all the critical terms of each of the hedges matched the underlying terms of the hedged debt and related forecasted interest payments, and as such, these hedges were considered highly effective.
The fair value of the interest rate swaps reflected an unrealized gain, net of unrealized losses, of $4.0 million ($2.4 million after-tax) at September 30, 2017 that is included in equity as part of AOCI. A decrease of 10% in market interest rates (e.g., a decrease from 5.0% to 4.5%) would result in a decrease of approximately $223,800 in the fair value of the interest rate swaps.
ITEM 7A. QUANTITATIVE AND QUALITATIVE DISCLOSURES ABOUT MARKET RISK, (continued)
Commodity Price Risks - In the normal course of business, the Company is exposed to commodity price fluctuations related to the purchases of certain materials and supplies (such as bronze ingot, steel, fuel and wood) used in its manufacturing operations. The Company obtains competitive prices for materials and supplies when available. In addition, based on competitive market conditions and to the extent that the Company has established pricing terms with customers through contracts or similar arrangements, the Company's ability to immediately increase the price of its products to offset the increased costs may be limited.
Foreign Currency Exchange Rates - The Company is subject to changes in various foreign currency exchange rates, primarily including the Euro, British Pound, Canadian Dollar, and Australian Dollar in the conversion from local currencies to the U.S. dollar of the reported financial position and operating results of its non-U.S. based subsidiaries. An adverse change (strengthening U.S. dollar) of 10% in exchange rates would have resulted in a decrease in reported sales of $50.1 million and a decrease in reported operating income of $4.2 million for the year ended September 30, 2017.
Actuarial Assumptions - The most significant actuarial assumptions affecting pension expense and pension obligations include the valuation of retirement plan assets, the discount rates and the estimated return on plan assets. The estimated return on plan assets is currently based upon projections provided by the Company's independent investment advisor, considering the investment policy of the plan and the plan's asset allocation. The fair value of plan assets and discount rates are "point-in-time" measures, and the recent volatility of the debt and equity markets makes estimating future changes in fair value of plan assets and discount rates more challenging. The Company elected to value its principal retirement and other postretirement benefit plan liabilities using a modified assumption of future mortality that reflects a significant improvement in life expectancy over the previous mortality assumptions. Refer to Note 12, "Pension and Other Postretirement Plans" in Item 8 – "Financial Statements and Supplementary Data" for additional information.
The following table summarizes the impact on the September 30, 2017 actuarial valuations of changes in the primary assumptions affecting the Company's retirement plans and supplemental retirement plan.
|
| | | | | | | | | | | | | | | | | | | | | | | |
| Impact of Changes in Actuarial Assumptions |
| Change in Discount Rates | | Change in Expected Return | | Change in Market Value of Assets |
| +1% | | -1% | | +1% | | -1% | | +5% | | -5% |
| (Dollar amounts in thousands) |
(Decrease) increase in net benefit cost | $ | (3,931 | ) | | $ | 4,830 |
| | $ | (1,502 | ) | | $ | 1,502 |
| | $ | (1,473 | ) | | $ | 1,473 |
|
| | | | | | | | | | | |
(Decrease) increase in projected benefit obligation | (31,982 | ) | | 39,902 |
| | — |
| | — |
| | — |
| | — |
|
| | | | | | | | | | | |
Increase (decrease) in funded status | 31,982 |
| | (39,902 | ) | | — |
| | — |
| | 7,782 |
| | (7,782 | ) |
ITEM 8. FINANCIAL STATEMENTS AND SUPPLEMENTARY DATA.
|
| | |
Description | | Pages |
| | |
Management's Report to Shareholders | | |
| | |
Report of Independent Registered Public Accounting Firm | | |
| | |
Report of Independent Registered Public Accounting Firm | | |
| | |
Report of Independent Registered Public Accounting Firm | | |
| | |
Financial Statements: | | |
| | |
Consolidated Balance Sheets as of September 30, 2017 and 2016 | | |
| | |
Consolidated Statements of Income for the years ended September 30, 2017, 2016 and 2015 | | |
| | |
Consolidated Statements of Comprehensive Income for the years ended September 30, 2017, 2016 and 2015 | | |
| | |
Consolidated Statements of Shareholders' Equity for the years ended September 30, 2017, 2016 and 2015 | | |
| | |
Consolidated Statements of Cash Flows for the years ended September 30, 2017, 2016 and 2015 | | |
| | |
Notes to Consolidated Financial Statements | | |
| | |
Supplementary Financial Information (unaudited) | | |
| | |
Financial Statement Schedule – Schedule II-Valuation and Qualifying | | |
Accounts for the years ended September 30, 2017, 2016 and 2015 | | |
MANAGEMENT'S REPORT TO SHAREHOLDERS
To the Shareholders and Board of Directors of
Matthews International Corporation:
Management's Report on Financial Statements
The accompanying consolidated financial statements of Matthews International Corporation and its subsidiaries (collectively, the "Company") were prepared by management, which is responsible for their integrity and objectivity. The statements were prepared in accordance with generally accepted accounting principles and include amounts that are based on management's best judgments and estimates. The other financial information included in this Annual Report on Form 10-K is consistent with that in the financial statements.
Management's Report on Internal Control over Financial Reporting
Management is responsible for establishing and maintaining adequate internal control over financial reporting for the Company, as such term is defined in Exchange Act Rule 13a-15f. In order to evaluate the effectiveness of internal control over financial reporting management has conducted an assessment using the criteria in Internal Control – Integrated Framework (2013), issued by the Committee of Sponsoring Organizations of the Treadway Commission ("COSO"). Internal controls over financial reporting is a process under the supervision of, our Chief Executive Officer and Chief Financial Officer, and effected by the Company's board of directors, management and other personnel to provide reasonable assurance regarding the reliability of financial reporting and the preparation of financial statements for external purposes in accordance with generally accepted accounting principles and includes those policies and procedures that (i) pertain to the maintenance of records that, in reasonable detail, accurately and fairly reflect the transactions and dispositions of the assets of the Company; (ii) provide reasonable assurance that transactions are recorded as necessary to permit preparation of financial statements in accordance with generally accepted accounting principles, and that receipts and expenditures of the Company are being made only in accordance with authorizations of management and directors of the Company; and (iii) provide reasonable assurance regarding prevention or timely detection of unauthorized acquisition, use, or disposition of the Company's assets that could have a material effect on the financial statements. Because of its inherent limitations, internal control over financial reporting may not prevent or detect misstatements. Also, projections of any evaluation of effectiveness to future periods are subject to the risk that controls may become inadequate because of changes in conditions, or that the degree of compliance with the policies or procedures may deteriorate.
Management, under the supervision and with the participation of our Chief Executive Officer and Chief Financial Officer, evaluated the effectiveness of the Company's internal control over financial reporting based on criteria in Internal Control – Integrated Framework (2013) issued by the COSO, and has concluded that the Company maintained effective internal control over financial reporting as of September 30, 2017. The effectiveness of the Company's internal control over financial reporting as of September 30, 2017 has been audited by Ernst & Young, LLP, an independent registered public accounting firm, as stated in their report which is included herein.
Management's Certifications
The certifications of the Company's Chief Executive Officer and Chief Financial Officer required by the Sarbanes-Oxley Act have been included as Exhibits 31 and 32 in this Annual Report on Form 10-K.
REPORT OF INDEPENDENT REGISTERED PUBLIC ACCOUNTING FIRM
The Board of Directors and Shareholders of
Matthews International Corporation and Subsidiaries:
We have audited Matthews International Corporation and Subsidiaries’ internal control over financial reporting as of September 30, 2017, based on criteria established in Internal Control-Integrated Framework issued by the Committee of Sponsoring Organizations of the Treadway Commission (2013 framework), (the COSO criteria). Matthews International Corporation and Subsidiaries’ management is responsible for maintaining effective internal control over financial reporting, and for its assessment of the effectiveness of internal control over financial reporting included in the accompanying Management’s Report on Internal Control over Financial Reporting. Our responsibility is to express an opinion on the company’s internal control over financial reporting based on our audit.
We conducted our audit in accordance with the standards of the Public Company Accounting Oversight Board (United States). Those standards require that we plan and perform the audit to obtain reasonable assurance about whether effective internal control over financial reporting was maintained in all material respects. Our audit included obtaining an understanding of internal control over financial reporting, assessing the risk that a material weakness exists, testing and evaluating the design and operating effectiveness of internal control based on the assessed risk, and performing such other procedures as we considered necessary in the circumstances. We believe that our audit provides a reasonable basis for our opinion.
A company’s internal control over financial reporting is a process designed to provide reasonable assurance regarding the reliability of financial reporting and the preparation of financial statements for external purposes in accordance with generally accepted accounting principles. A company’s internal control over financial reporting includes those policies and procedures that (1) pertain to the maintenance of records that, in reasonable detail, accurately and fairly reflect the transactions and dispositions of the assets of the company; (2) provide reasonable assurance that transactions are recorded as necessary to permit preparation of financial statements in accordance with generally accepted accounting principles, and that receipts and expenditures of the company are being made only in accordance with authorizations of management and directors of the company; and (3) provide reasonable assurance regarding prevention or timely detection of unauthorized acquisition, use, or disposition of the company’s assets that could have a material effect on the financial statements.
Because of its inherent limitations, internal control over financial reporting may not prevent or detect misstatements. Also, projections of any evaluation of effectiveness to future periods are subject to the risk that controls may become inadequate because of changes in conditions, or that the degree of compliance with the policies or procedures may deteriorate.
In our opinion, Matthews International Corporation and Subsidiaries maintained, in all material respects, effective internal control over financial reporting as of September 30, 2017, based on the COSO criteria.
We also have audited, in accordance with the standards of the Public Company Accounting Oversight Board (United States), the consolidated balance sheets of Matthews International Corporation and Subsidiaries as of September 30, 2017 and 2016, and the related consolidated statements of income, comprehensive income, shareholders' equity and cash flows for the years then ended of Matthews International Corporation and Subsidiaries and our report dated November 21, 2017 expressed an unqualified opinion thereon.
/s/ Ernst & Young LLP
Pittsburgh, Pennsylvania
November 21, 2017
REPORT OF INDEPENDENT REGISTERED PUBLIC ACCOUNTING FIRM
The Board of Directors and Shareholders of
Matthews International Corporation and Subsidiaries:
We have audited the accompanying consolidated balance sheets of Matthews International Corporation and Subsidiaries as of September 30, 2017 and 2016, and the related consolidated statements of income, comprehensive income, shareholders' equity and cash flows for the years then ended. Our audits also included the financial statement schedule listed in the Index at Item 15(a). These financial statements and schedule are the responsibility of the Company's management. Our responsibility is to express an opinion on these financial statements and schedule based on our audits.
We conducted our audits in accordance with the standards of the Public Company Accounting Oversight Board (United States). Those standards require that we plan and perform the audit to obtain reasonable assurance about whether the financial statements are free of material misstatement. An audit includes examining, on a test basis, evidence supporting the amounts and disclosures in the financial statements. An audit also includes assessing the accounting principles used and significant estimates made by management, as well as evaluating the overall financial statement presentation. We believe that our audits provide a reasonable basis for our opinion.
In our opinion, the financial statements referred to above present fairly, in all material respects, the consolidated financial position of Matthews International Corporation and Subsidiaries at September 30, 2017 and 2016, and the consolidated results of their operations and their cash flows for the years then ended, in conformity with U.S. generally accepted accounting principles. Also, in our opinion, the related financial statement schedule, when considered in relation to the basic financial statements taken as a whole, presents fairly in all material respects the information set forth therein.
We also have audited, in accordance with the standards of the Public Company Accounting Oversight Board (United States), Matthews International Corporation and Subsidiaries’ internal control over financial reporting as of September 30, 2017, based on criteria established in Internal Control-Integrated Framework issued by the Committee of Sponsoring Organizations of the Treadway Commission (2013 framework), and our report dated November 21, 2017 expressed an unqualified opinion thereon.
/s/ Ernst & Young LLP
Pittsburgh, Pennsylvania
November 21, 2017
REPORT OF INDEPENDENT REGISTERED PUBLIC ACCOUNTING FIRM
To the Shareholders and Board of Directors of
Matthews International Corporation:
In our opinion, the consolidated statements of income, comprehensive income (loss), shareholders’ equity and cash flows for the year ended September 30, 2015 present fairly, in all material respects, the results of operations and cash flows of Matthews International Corporation and its subsidiaries for the year ended September 30, 2015, in conformity with accounting principles generally accepted in the United States of America. In addition, in our opinion, the financial statement schedule for the year ended September 30, 2015 presents fairly, in all material respects, the information set forth therein when read in conjunction with the related consolidated financial statements. These financial statements and financial statement schedule are the responsibility of the Company's management. Our responsibility is to express an opinion on these financial statements and financial statement schedule based on our audit. We conducted our audit of these financial statements in accordance with the standards of the Public Company Accounting Oversight Board (United States). Those standards require that we plan and perform the audit to obtain reasonable assurance about whether the financial statements are free of material misstatement. An audit includes examining, on a test basis, evidence supporting the amounts and disclosures in the financial statements, assessing the accounting principles used and significant estimates made by management, and evaluating the overall financial statement presentation. We believe that our audit provides a reasonable basis for our opinion.
/s/ PricewaterhouseCoopers LLP
Pittsburgh, Pennsylvania
November 24, 2015
MATTHEWS INTERNATIONAL CORPORATION AND SUBSIDIARIES
CONSOLIDATED BALANCE SHEETS
September 30, 2017 and 2016
(Dollar amounts in thousands, except per share data)
|
| | | | | | | |
ASSETS | 2017 | | 2016 |
Current assets: | | | |
Cash and cash equivalents | $ | 57,515 |
| | $ | 55,711 |
|
Accounts receivable, net of allowance for doubtful accounts of $11,622 and $11,516, respectively | 319,566 |
| | 294,915 |
|
Inventories | 171,445 |
| | 162,472 |
|
Other current assets | 46,533 |
| | 61,086 |
|
| | | |
Total current assets | 595,059 |
| | 574,184 |
|
| | | |
Investments | 37,667 |
| | 31,365 |
|
| | | |
Property, plant and equipment, net | 235,533 |
| | 219,492 |
|
| | | |
Deferred income taxes | 2,456 |
| | 775 |
|
| | | |
Other assets | 51,758 |
| | 19,895 |
|
| | | |
Goodwill | 897,794 |
| | 851,489 |
|
| | | |
Other intangible assets, net | 424,382 |
| | 393,841 |
|
| | | |
Total assets | $ | 2,244,649 |
| | $ | 2,091,041 |
|
The accompanying notes are an integral part of these consolidated financial statements.
MATTHEWS INTERNATIONAL CORPORATION AND SUBSIDIARIES
CONSOLIDATED BALANCE SHEETS, continued
September 30, 2017 and 2016
(Dollar amounts in thousands, except per share data)
|
| | | | | | | |
LIABILITIES AND SHAREHOLDERS' EQUITY | 2017 | | 2016 |
Current liabilities: | | | |
Long-term debt, current maturities | $ | 29,528 |
| | $ | 27,747 |
|
Trade accounts payable | 66,607 |
| | 58,118 |
|
Accrued compensation | 62,210 |
| | 63,737 |
|
Accrued income taxes | 21,386 |
| | 15,527 |
|
Other current liabilities | 105,401 |
| | 94,219 |
|
Total current liabilities | 285,132 |
| | 259,348 |
|
| | | |
Long-term debt | 881,602 |
| | 844,807 |
|
| | | |
Accrued pension | 103,273 |
| | 110,941 |
|
| | | |
Postretirement benefits | 19,273 |
| | 22,143 |
|
| | | |
Deferred income taxes | 139,430 |
| | 107,038 |
|
| | | |
Other liabilities | 25,680 |
| | 37,430 |
|
Total liabilities | 1,454,390 |
| | 1,381,707 |
|
| | | |
Shareholders' equity-Matthews: | |
| | |
|
Class A common stock, $1.00 par value; authorized 70,000,000 shares; 36,333,992 shares issued | 36,334 |
| | 36,334 |
|
Preferred stock, $100 par value, authorized 10,000 shares, none issued | — |
| | — |
|
Additional paid-in capital | 123,432 |
| | 117,088 |
|
Retained earnings | 948,830 |
| | 896,224 |
|
Accumulated other comprehensive loss | (154,115 | ) | | (181,868 | ) |
Treasury stock, 4,185,413 and 4,192,307 shares, respectively, at cost | (164,774 | ) | | (159,113 | ) |
Total shareholders' equity-Matthews | 789,707 |
| | 708,665 |
|
Noncontrolling interests | 552 |
| | 669 |
|
Total shareholders' equity | 790,259 |
| | 709,334 |
|
| | | |
Total liabilities and shareholders' equity | $ | 2,244,649 |
| | $ | 2,091,041 |
|
The accompanying notes are an integral part of these consolidated financial statements.
MATTHEWS INTERNATIONAL CORPORATION AND SUBSIDIARIES
CONSOLIDATED STATEMENTS OF INCOME
for the years ended September 30, 2017, 2016 and 2015
(Dollar amounts in thousands, except per share data)
|
| | | | | | | | | | | |
| 2017 | | 2016 | | 2015 |
Sales | $ | 1,515,608 |
| | $ | 1,480,464 |
| | $ | 1,426,068 |
|
Cost of sales | (952,221 | ) | | (924,010 | ) | | (896,693 | ) |
| | | | | |
Gross profit | 563,387 |
| | 556,454 |
| | 529,375 |
|
| | | | | |
Selling expense | (144,174 | ) | | (140,924 | ) | | (143,299 | ) |
Administrative expense | (306,610 | ) | | (296,715 | ) | | (281,053 | ) |
| | | | | |
Operating profit | 112,603 |
| | 118,815 |
| | 105,023 |
|
| | | | | |
Investment income | 2,468 |
| | 2,061 |
| | 175 |
|
Interest expense | (26,371 | ) | | (24,344 | ) | | (20,610 | ) |
Other income (deductions), net | 7,587 |
| | (1,298 | ) | | 5,064 |
|
| | | | | |
Income before income taxes | 96,287 |
| | 95,234 |
| | 89,652 |
|
| | | | | |
Income taxes | (22,354 | ) | | (29,073 | ) | | (26,364 | ) |
| | | | | |
Net income | 73,933 |
| | 66,161 |
| | 63,288 |
|
| | | | | |
Net loss (income) attributable to noncontrolling interests | 435 |
| | 588 |
| | 161 |
|
| | | | | |
Net income attributable to Matthews shareholders | $ | 74,368 |
| | $ | 66,749 |
| | $ | 63,449 |
|
| | | | | |
Earnings per share attributable to Matthews shareholders: | |
| | |
| | |
|
| | | | | |
Basic | $ | 2.31 |
| | $ | 2.04 |
| | $ | 1.93 |
|
| | | | | |
Diluted | $ | 2.28 |
| | $ | 2.03 |
| | $ | 1.91 |
|
The accompanying notes are an integral part of these consolidated financial statements.
MATTHEWS INTERNATIONAL CORPORATION AND SUBSIDIARIES
CONSOLIDATED STATEMENTS OF COMPREHENSIVE INCOME (LOSS)
for the years ended September 30, 2017, 2016 and 2015
(Dollar amounts in thousands) |
| | | | | | | | | | | |
| Year Ended September 30, 2017 |
| Matthews | | Noncontrolling Interest | | Total |
Net income (loss) | $ | 74,368 |
| | $ | (435 | ) | | $ | 73,933 |
|
Other comprehensive income, net of tax: | |
| | |
| | |
|
Foreign currency translation adjustment | 9,352 |
| | 119 |
| | 9,471 |
|
Pension plans and other postretirement benefits | 12,427 |
| | — |
| | 12,427 |
|
Unrecognized gain (loss) on derivatives: | |
| | |
| | |
|
Net change from periodic revaluation | 7,043 |
| | — |
| | 7,043 |
|
Net amount reclassified to earnings | (1,069 | ) | | — |
| | (1,069 | ) |
Net change in unrecognized gain (loss) on derivatives | 5,974 |
| | — |
| | 5,974 |
|
Other comprehensive income, net of tax | 27,753 |
| | 119 |
| | 27,872 |
|
Comprehensive income (loss) | $ | 102,121 |
| | $ | (316 | ) | | $ | 101,805 |
|
| | | | | |
| Year Ended September 30, 2016 |
| Matthews | | Noncontrolling Interest | | Total |
| | | | | |
Net income (loss) | $ | 66,749 |
| | $ | (588 | ) | | $ | 66,161 |
|
Other comprehensive income (loss), net of tax: | |
| | |
| | |
|
Foreign currency translation adjustment | (17,655 | ) | | (89 | ) | | (17,744 | ) |
Pension plans and other postretirement benefits | (12,576 | ) | | — |
| | (12,576 | ) |
Unrecognized gain (loss) on derivatives: | |
| | |
| | |
|
Net change from periodic revaluation | (3,230 | ) | | — |
| | (3,230 | ) |
Net amount reclassified to earnings | 1,919 |
| | — |
| | 1,919 |
|
Net change in unrecognized gain (loss) on derivatives | (1,311 | ) | | — |
| | (1,311 | ) |
Other comprehensive income (loss), net of tax | (31,542 | ) | | (89 | ) | | (31,631 | ) |
Comprehensive income (loss) | $ | 35,207 |
| | $ | (677 | ) | | $ | 34,530 |
|
| | | | | |
| Year Ended September 30, 2015 |
| Matthews | | Noncontrolling Interest | | Total |
| | | | | |
Net income (loss) | $ | 63,449 |
| | $ | (161 | ) | | $ | 63,288 |
|
Other comprehensive income (loss), net of tax: | |
| | |
| | |
|
Foreign currency translation adjustment | (77,237 | ) | | (150 | ) | | (77,387 | ) |
Pension plans and other postretirement benefits | (3,823 | ) | | — |
| | (3,823 | ) |
Unrecognized gain (loss) on derivatives: | |
| | |
| | |
|
Net change from periodic revaluation | (4,841 | ) | | — |
| | (4,841 | ) |
Net amount reclassified to earnings | 2,392 |
| | — |
| | 2,392 |
|
Net change in unrecognized gain (loss) on derivatives | (2,449 | ) | | — |
| | (2,449 | ) |
Other comprehensive income (loss), net of tax | (83,509 | ) | | (150 | ) | | (83,659 | ) |
Comprehensive loss | $ | (20,060 | ) | | $ | (311 | ) | | $ | (20,371 | ) |
| | | | | |
The accompanying notes are an integral part of these consolidated financial statements.
MATTHEWS INTERNATIONAL CORPORATION AND SUBSIDIARIES
CONSOLIDATED STATEMENTS OF SHAREHOLDERS' EQUITY
for the years ended September 30, 2017, 2016 and 2015
(Dollar amounts in thousands, except per share data) |
| | | | | | | | | | | | | | | | | | | | | | | | | | | |
| Common Stock | | Additional Paid-in Capital | | Retained Earnings | | Accumulated Other Comprehensive (Loss) Income (net of tax) | | Treasury Stock | | Non- controlling Interests | | Total |
Balance, September 30, 2014 | $ | 36,334 |
| | $ | 113,225 |
| | $ | 798,353 |
| | $ | (66,817 | ) | | $ | (109,950 | ) | | $ | 4,061 |
| | $ | 775,206 |
|
Net income | — |
| | — |
| | 63,449 |
| | — |
| | — |
| | (161 | ) | | 63,288 |
|
Minimum pension liability | — |
| | — |
| | — |
| | (3,823 | ) | | — |
| | — |
| | (3,823 | ) |
Translation adjustment | — |
| | — |
| | — |
| | (77,237 | ) | | — |
| | (150 | ) | | (77,387 | ) |
Fair value of derivatives | — |
| | — |
| | — |
| | (2,449 | ) | | — |
| | — |
| | (2,449 | ) |
Total comprehensive income | |
| | |
| | |
| | |
| | |
| | |
| | (20,371 | ) |
Stock-based compensation | — |
| | 9,097 |
| | — |
| | — |
| | — |
| | — |
| | 9,097 |
|
Purchase of 304,859 shares
of treasury stock | — |
| | — |
| | — |
| | — |
| | (14,567 | ) | | — |
| | (14,567 | ) |
Issuance of 334,850 shares
of treasury stock | — |
| | (7,336 | ) | | — |
| | — |
| | 10,768 |
| | — |
| | 3,432 |
|
Cancellation of 34,789 shares of
treasury stock | — |
| | 1,284 |
| | — |
| | — |
| | (1,284 | ) | | — |
| | — |
|
Dividends, $.54 per share | — |
| | — |
| | (17,847 | ) | | — |
| | — |
| | — |
| | (17,847 | ) |
Distribution to noncontrolling interests | — |
| | — |
| | — |
| | — |
| | — |
| | (95 | ) | | (95 | ) |
Acquisition of noncontrolling
interests | — |
| | (380 | ) | | — |
| | — |
| | — |
| | (429 | ) | | (809 | ) |
Balance, September 30, 2015 | 36,334 |
| | 115,890 |
| | 843,955 |
| | (150,326 | ) | | (115,033 | ) | | 3,226 |
| | 734,046 |
|
Net income | — |
| | — |
| | 66,749 |
| | — |
| | — |
| | (588 | ) | | 66,161 |
|
Minimum pension liability | — |
| | — |
| | — |
| | (12,576 | ) | | — |
| | — |
| | (12,576 | ) |
Translation adjustment | — |
| | — |
| | — |
| | (17,655 | ) | | — |
| | (89 | ) | | (17,744 | ) |
Fair value of derivatives | — |
| | — |
| | — |
| | (1,311 | ) | | — |
| | — |
| | (1,311 | ) |
Total comprehensive income | |
| | |
| | |
| | |
| | |
| | |
| | 34,530 |
|
Stock-based compensation | — |
| | 10,612 |
| | — |
| | — |
| | — |
| | — |
| | 10,612 |
|
Purchase of 1,132,452 shares
of treasury stock | — |
| | — |
| | — |
| | — |
| | (57,998 | ) | | — |
| | (57,998 | ) |
Issuance of 404,307 shares
of treasury stock | — |
| | (5,972 | ) | | — |
| | — |
| | 14,162 |
| | — |
| | 8,190 |
|
Cancellation of 5,237 shares of
treasury stock | — |
| | 244 |
| | — |
| | — |
| | (244 | ) | | — |
| | — |
|
Dividends | — |
| | — |
| | (14,480 | ) | | — |
| | — |
| | — |
| | (14,480 | ) |
Transactions with noncontrolling interests | — |
| | (3,686 | ) | | — |
| | — |
| | — |
| | (1,880 | ) | | (5,566 | ) |
Balance, September 30, 2016 | 36,334 |
| | 117,088 |
| | 896,224 |
| | (181,868 | ) | | (159,113 | ) | | 669 |
| | 709,334 |
|
Net income | — |
| | — |
| | 74,368 |
| | — |
| | — |
| | (435 | ) | | 73,933 |
|
Minimum pension liability | — |
| | — |
| | — |
| | 12,427 |
| | — |
| | — |
| | 12,427 |
|
Translation adjustment | — |
| | — |
| | — |
| | 9,352 |
| | — |
| | 119 |
| | 9,471 |
|
Fair value of derivatives | — |
| | — |
| | — |
| | 5,974 |
| | — |
| | — |
| | 5,974 |
|
Total comprehensive income | |
| | |
| | |
| | |
| | |
| | |
| | 101,805 |
|
Stock-based compensation | — |
| | 14,562 |
| | — |
| | — |
| | — |
| | — |
| | 14,562 |
|
Purchase of 212,424 shares
of treasury stock | — |
| | — |
| | — |
| | — |
| | (14,025 | ) | | — |
| | (14,025 | ) |
Issuance of 221,958 shares
of treasury stock | — |
| | (8,397 | ) | | — |
| | — |
| | 8,543 |
| | — |
| | 146 |
|
Cancellation of 2,640 shares of
treasury stock | — |
| | 179 |
| | — |
| | — |
| | (179 | ) | | — |
| | — |
|
Dividends | — |
| | — |
| | (21,762 | ) | | — |
| | — |
| | — |
| | (21,762 | ) |
Transactions with noncontrolling interests | — |
| | — |
| | — |
| | — |
| | — |
| | 199 |
| | 199 |
|
Balance, September 30, 2017 | $ | 36,334 |
| | $ | 123,432 |
| | $ | 948,830 |
| | $ | (154,115 | ) | | $ | (164,774 | ) | | $ | 552 |
| | $ | 790,259 |
|
The accompanying notes are an integral part of these consolidated financial statements.
MATTHEWS INTERNATIONAL CORPORATION AND SUBSIDIARIES
CONSOLIDATED STATEMENTS OF CASH FLOWS
for the years ended September 30, 2017, 2016 and 2015
(Dollar amounts in thousands)
|
| | | | | | | | | | | |
| 2017 | | 2016 | | 2015 |
Cash flows from operating activities: | | | | | |
Net income | $ | 73,933 |
| | $ | 66,161 |
| | $ | 63,288 |
|
Adjustments to reconcile net income to net cash provided by operating activities: | |
| | |
| | |
|
Depreciation and amortization | 67,981 |
| | 65,480 |
| | 62,620 |
|
Stock-based compensation expense | 14,562 |
| | 10,612 |
| | 9,097 |
|
Change in deferred taxes | 9,725 |
| | (3,971 | ) | | 9,188 |
|
Gain on sale of assets | (776 | ) | | (73 | ) | | (276 | ) |
Unrealized (gain) loss on investments | (2,660 | ) | | (1,426 | ) | | 377 |
|
Trade name write-offs | — |
| | — |
| | 4,842 |
|
Changes in working capital items | 5,784 |
| | 13,715 |
| | (2,751 | ) |
(Increase) decrease in other assets | (17,256 | ) | | (5,591 | ) | | 4,064 |
|
(Decrease) increase in other liabilities | (7,150 | ) | | 5,397 |
| | (8,041 | ) |
Increase (decrease) in pension and postretirement benefit obligations | 9,689 |
| | (2,465 | ) | | 8,652 |
|
Other operating activities, net | (4,533 | ) | | (7,565 | ) | | (9,996 | ) |
Net cash provided by operating activities | 149,299 |
| | 140,274 |
| | 141,064 |
|
Cash flows from investing activities: | |
| | |
| | |
|
Capital expenditures | (44,935 | ) | | (41,682 | ) | | (48,251 | ) |
Acquisitions, net of cash acquired | (98,235 | ) | | (6,937 | ) | | (213,470 | ) |
Proceeds from sale of assets | 3,764 |
| | 1,478 |
| | 1,062 |
|
Proceeds from sale of subsidiary | — |
| | — |
| | 10,418 |
|
Purchases of investments | (2,211 | ) | | — |
| | — |
|
Restricted cash | — |
| | — |
| | (12,925 | ) |
Net cash used in investing activities | (141,617 | ) | | (47,141 | ) | | (263,166 | ) |
Cash flows from financing activities: | |
| | |
| | |
|
Proceeds from long-term debt | 417,043 |
| | 90,421 |
| | 279,377 |
|
Payments on long-term debt | (388,447 | ) | | (120,380 | ) | | (100,218 | ) |
Payment on contingent consideration | — |
| | — |
| | (484 | ) |
Purchases of treasury stock | (14,025 | ) | | (57,998 | ) | | (14,567 | ) |
Proceeds from the exercise of stock options | 14 |
| | 6,406 |
| | 4,015 |
|
Dividends | (21,762 | ) | | (19,413 | ) | | (17,847 | ) |
Transactions with noncontrolling interests | — |
| | (5,566 | ) | | (904 | ) |
Settlement of multi-employer pension plan obligation | — |
| | — |
| | (18,157 | ) |
Other financing activities | — |
| | (2,318 | ) | | — |
|
Net cash (used in) provided by financing activities | (7,177 | ) | | (108,848 | ) | | 131,215 |
|
Effect of exchange rate changes on cash | 1,299 |
| | (770 | ) | | 80 |
|
Net change in cash and cash equivalents | 1,804 |
| | (16,485 | ) | | 9,193 |
|
Cash and cash equivalents at beginning of year | 55,711 |
| | 72,196 |
| | 63,003 |
|
Cash and cash equivalents at end of year | $ | 57,515 |
| | $ | 55,711 |
| | $ | 72,196 |
|
| | | | | |
Cash paid during the year for: | |
| | |
| | |
|
Interest | $ | 26,271 |
| | $ | 24,133 |
| | $ | 19,663 |
|
Income taxes | 8,472 |
| | 11,855 |
| | 11,663 |
|
The accompanying notes are an integral part of these consolidated financial statements.
MATTHEWS INTERNATIONAL CORPORATION AND SUBSIDIARIES
NOTES TO CONSOLIDATED FINANCIAL STATEMENTS
(Dollar amounts in thousands, except per share data)
1. NATURE OF OPERATIONS:
Matthews International Corporation ("Matthews" or the "Company"), founded in 1850 and incorporated in Pennsylvania in 1902, is a global provider of brand solutions, memorialization products and industrial technologies. Brand solutions include brand development, deployment and delivery (consisting of brand management, pre-media services, printing plates and cylinders, and imaging services for consumer packaged goods and retail customers, merchandising display systems, and marketing and design services). Memorialization products consist primarily of bronze and granite memorials and other memorialization products, caskets and cremation equipment primarily for the cemetery and funeral home industries. Industrial technologies include marking and coding equipment and consumables, industrial automation products and order fulfillment systems for identifying, tracking, picking and conveying consumer and industrial products.
The Company has facilities in the United States, Europe, Asia, Canada, Australia, and Central and South America.
2. SUMMARY OF SIGNIFICANT ACCOUNTING POLICIES:
Principles of Consolidation:
The consolidated financial statements include all domestic and foreign subsidiaries in which the Company maintains an ownership interest and has operating control. Investments in certain companies over which the Company exerts significant influence, but does not control the financial and operating decisions, are accounted for as equity method investments. Investments in certain companies over which the Company does not exert significant influence are accounted for as cost method investments. All intercompany accounts and transactions have been eliminated.
Use of Estimates:
The preparation of financial statements in conformity with generally accepted accounting principles requires management to make estimates and assumptions that affect the reported amounts of assets and liabilities and the disclosure of contingent assets and liabilities at the date of the financial statements and the reported amounts of revenues and expenses during the reporting period. Actual results could differ from those estimates.
Cash and Cash Equivalents:
The Company considers all investments purchased with a remaining maturity of three months or less to be cash equivalents. The carrying amount of cash and cash equivalents approximates fair value due to the short-term maturities of these instruments.
Trade Receivables and Allowance for Doubtful Accounts:
Trade receivables are carried at their estimated collectible amounts. Trade credit is generally extended on a short-term basis; thus trade receivables do not bear interest, although a finance charge may be applied to such receivables that are more than 30 days past due. The allowance for doubtful accounts is based on an evaluation of specific customer accounts for which available facts and circumstances indicate collectability may be uncertain.
Inventories:
Inventories are stated at the lower of cost or market with cost generally determined under the average cost method. Inventory costs include material, labor, and applicable manufacturing overhead (including depreciation) and other direct costs.
NOTES TO CONSOLIDATED FINANCIAL STATEMENTS (continued)
(Dollar amounts in thousands, except per share data)
2. SUMMARY OF SIGNIFICANT ACCOUNTING POLICIES, (continued)
Property, Plant and Equipment:
Property, plant and equipment are carried at cost. Depreciation is computed primarily on the straight-line method over the estimated useful lives of the assets, which generally range from 10 to 45 years for buildings and 3 to 12 years for machinery and equipment. Gains or losses from the disposition of assets are reflected in operating profit. The cost of maintenance and repairs is charged to expense as incurred. Renewals and betterments of a nature considered to extend the useful lives of the assets are capitalized. Property, plant and equipment are reviewed for impairment whenever events or changes in circumstances indicate that the carrying amount of such assets may not be recoverable. Recoverability of assets is determined by evaluating the estimated undiscounted net cash flows of the operations to which the assets relate. An impairment loss would be recognized when the carrying amount of the assets exceeds the fair value, which is based on a discounted cash flow analysis. No such charges were recognized during the years presented.
Goodwill and Other Intangible Assets:
Intangible assets with finite useful lives are amortized over their estimated useful lives, ranging from 2 to 20 years, and are reviewed when appropriate for possible impairment, similar to property, plant and equipment. Goodwill and intangible assets with indefinite lives are not amortized, but are tested annually for impairment, or when circumstances indicate that a possible impairment may exist. In general, when the carrying value of these assets exceeds the implied fair value, an impairment loss must be recognized. A significant decline in cash flows generated from these assets may result in a write-down of the carrying values of the related assets. For purposes of testing goodwill for impairment, the Company uses a combination of valuation techniques, including discounted cash flows. For purposes of testing indefinite-lived intangible assets, the Company generally uses a relief from royalty method.
Pension and Other Postretirement Plans:
Pension assets and liabilities are determined on an actuarial basis and are affected by the market value of plan assets, estimates of the expected return on plan assets and the discount rate used to determine the present value of benefit obligations. Actual changes in the fair market value of plan assets and differences between the actual return on plan assets, the expected return on plan assets and changes in the selected discount rate will affect the amount of pension cost. Differences between actual and expected results or changes in the value of the obligations and plan assets are initially recognized through other comprehensive income and subsequently amortized to the Consolidated Statement of Income.
Environmental:
Costs that mitigate or prevent future environmental issues or extend the life or improve equipment utilized in current operations are capitalized and depreciated on a straight-line basis over the estimated useful lives of the related assets. Costs that relate to current operations or an existing condition caused by past operations are expensed. Environmental liabilities are recorded when the Company's obligation is probable and reasonably estimable. Accruals for losses from environmental remediation obligations do not consider the effects of inflation, and anticipated expenditures are not discounted to their present value.
Derivatives and Hedging:
Derivatives are held as part of a formal documented hedging program. All derivatives are held for purposes other than trading. Matthews measures effectiveness by formally assessing, at least quarterly, the historical and probable future high correlation of changes in the fair value or future cash flows of the hedged item. If the hedging relationship ceases to be highly effective or it becomes probable that an expected transaction will no longer occur, gains and losses on the derivative will be recorded in other income (deductions) at that time.
Changes in the fair value of derivatives designated as cash flow hedges are recorded in other comprehensive income (loss) ("OCI"), net of tax, and are reclassified to earnings in a manner consistent with the underlying hedged item. The cash flows from derivative activities are recognized in the statement of cash flows in a manner consistent with the underlying hedged item.
NOTES TO CONSOLIDATED FINANCIAL STATEMENTS (continued)
(Dollar amounts in thousands, except per share data)
2. SUMMARY OF SIGNIFICANT ACCOUNTING POLICIES, (continued)
Foreign Currency:
The functional currency of the Company's foreign subsidiaries is generally the local currency. Balance sheet accounts for foreign subsidiaries are translated into U.S. dollars at exchange rates in effect at the consolidated balance sheet date. Gains or losses that result from this process are recorded in accumulated other comprehensive income (loss). The revenue and expense accounts of foreign subsidiaries are translated into U.S. dollars at the average exchange rates that prevailed during the period. Realized gains and losses from foreign currency transactions are presented in the Statement of Income in a consistent manner with the underlying transaction based upon the provisions of Accounting Standards Codification ("ASC") 830 "Foreign Currency Matters."
Comprehensive Income (Loss):
Comprehensive income (loss) consists of net income adjusted for changes, net of any related income tax effect, in cumulative foreign currency translation, the fair value of derivatives, unrealized investment gains and losses and minimum pension liability.
Treasury Stock:
Treasury stock is carried at cost. The cost of treasury shares sold is determined under the average cost method.
Revenue Recognition:
Revenues are generally recognized when title, ownership, and risk of loss pass to the customer, which is typically at the time of product shipment and is based on the applicable shipping terms. The shipping terms vary across all businesses and depend on the product and customer.
Revenues from brand development and deployment services are recognized using the completed performance method, which is typically when the customer receives the final deliverable. For arrangements with customer acceptance provisions, revenue is recognized when the customer approves the final deliverable.
For pre-need sales of memorials and vases, revenue is recognized when the memorial has been manufactured to the customer's specifications (e.g., name and birth date), title has been transferred to the customer and the memorial and vase are placed in storage for future delivery. A liability has been recorded for the estimated costs of finishing pre-need bronze memorials and vases that have been manufactured and placed in storage prior to July 1, 2003 for future delivery. Beginning July 1, 2003, revenue is deferred by the Company on the portion of pre-need sales attributable to the final finishing and storage of the pre-need merchandise. Deferred revenue for final finishing is recognized at the time the pre-need merchandise is finished and shipped to the customer. Deferred revenue related to storage is recognized on a straight-line basis over the estimated average time that pre-need merchandise is held in storage. At September 30, 2017, the Company held 330,716 memorials and 221,713 vases in its storage facilities under the pre-need sales program.
Revenues from mausoleum construction and significant engineering projects, including certain roto-gravure projects, cremation units and marking and industrial automation projects, are recognized under the percentage-of-completion method of accounting using the cost-to-cost basis for measuring progress toward completion. As work is performed under contracts, estimates of the costs to complete are regularly reviewed and updated. As changes in estimates of total costs at completion on projects are identified, appropriate earnings adjustments are recorded using the cumulative catch-up method. Provisions for estimated losses on uncompleted contracts are recorded during the period in which such losses become evident.
Shipping and Handling Fees and Costs:
All fees billed to the customer for shipping and handling are classified as a component of net revenues. All costs associated with shipping and handling are classified as a component of cost of sales or selling expense.
NOTES TO CONSOLIDATED FINANCIAL STATEMENTS (continued)
(Dollar amounts in thousands, except per share data)
2. SUMMARY OF SIGNIFICANT ACCOUNTING POLICIES, (continued)
Research and Development Expenses:
Research and development costs are expensed as incurred and were approximately $16,362, $14,793 and $13,033 for the years ended September 30, 2017, 2016 and 2015, respectively.
Stock-Based Compensation:
Stock-based compensation cost is measured at grant date, based on the fair value of the award, and is recognized as expense over the employee requisite service period. A binomial lattice model is utilized to determine the fair value of awards that have vesting conditions based on market targets.
Income Taxes:
Deferred tax assets and liabilities are provided for the differences between the financial statement and tax bases of assets and liabilities using enacted tax rates in effect for the years in which the differences are expected to reverse. Valuation allowances are recorded to reduce deferred tax assets when it is more likely than not that a tax benefit will not be realized. Deferred income taxes for U.S. tax purposes have not been provided on certain undistributed earnings of foreign subsidiaries, as such earnings are considered to be reinvested indefinitely. To the extent earnings are expected to be returned in the foreseeable future, the associated deferred tax liabilities are provided. The Company has not determined the deferred tax liability associated with these undistributed earnings, as such determination is not practicable, due to the complexities of the hypothetical calculation.
Earnings Per Share:
Basic earnings per share is computed by dividing net income by the average number of common shares outstanding. Diluted earnings per share is computed using the treasury stock method, which assumes the issuance of common stock for all dilutive securities.
3. ACCOUNTING PRONOUNCEMENTS:
Issued
In August 2017, the Financial Accounting Standards Board ("FASB") issued Accounting Standards Update ("ASU") 2017-12, Derivatives and Hedging (Topic 815), which provides new guidance intended to improve the financial reporting of hedging relationships to better portray the economic results of an entity’s risk management activities in its financial statements. This ASU is effective for the Company beginning in fiscal year 2020. The adoption of this ASU is not expected to have a material impact on the Company's consolidated financial statements.
In May 2017, the FASB issued ASU 2017-09, Compensation-Stock Compensation (Topic 718), which provides new guidance intended to clarify and reduce complexities in applying stock compensation guidance to a change to the terms or conditions of share-based payment awards. This ASU is effective for the Company beginning in fiscal year 2019. The Company is in the process of assessing the impact this ASU will have on its consolidated financial statements.
In February 2017, the FASB issued ASU No. 2017-07, Compensation - Retirement Benefits (Topic 715), Improving the Presentation of Net Periodic Pension Cost and Net Periodic Postretirement Benefit Cost, which provides new guidance intended to improve the disclosure requirements related to the service cost component of net benefit cost. This ASU is effective for the Company beginning in fiscal year 2019. The adoption of this ASU is not expected to have a material impact on the Company's consolidated financial statements.
NOTES TO CONSOLIDATED FINANCIAL STATEMENTS (continued)
(Dollar amounts in thousands, except per share data)
3. ACCOUNTING PRONOUNCEMENTS, (continued)
In January 2017, the FASB issued ASU No. 2017-04, Intangibles - Goodwill and Other (Topic 350), Simplifying the Test for Goodwill Impairment, which provides new guidance intended to simplify the subsequent measurement of goodwill and removing Step 2 from the goodwill impairment process. This ASU is effective for the Company beginning in fiscal year 2021, and does allow for early adoption. The adoption of this ASU is not expected to have a material impact on the Company's consolidated financial statements.
In January 2017, the FASB issued ASU No. 2017-01, Business Combinations (Topic 805), Clarifying the Definition of a Business, which provides new guidance intended to make the definition of a business more operable and allow for more consistency in application. This ASU is effective for the Company beginning in interim periods starting in fiscal year 2019. The adoption of this ASU is not expected to have a material impact on the Company's consolidated financial statements.
In August 2016, the FASB issued ASU No. 2016-15, Statement of Cash Flows (Topic 230): Classification of Certain Cash Receipts and Cash Payments (a consensus of the Emerging Issues Task Force), which provides new guidance intended to clarify the presentation of certain cash flow items including debt prepayments, debt extinguishment costs, contingent considerations payments, and insurance proceeds, among other things. This ASU is effective for the Company beginning in interim periods starting in fiscal year 2019, and early adoption is permitted. The adoption of this ASU is not expected to have a material impact on the Company's consolidated financial statements.
In February 2016, the FASB issued ASU No. 2016-02, Leases (Topic 842), which provides new guidance on how an entity should account for leases and recognize associated lease assets and liabilities. This ASU requires lessees to recognize assets and liabilities that arise from financing and operating leases on the Consolidated Balance Sheet. The implementation of this standard will require application of the new guidance at the beginning of the earliest comparative period presented, once adopted. This ASU is effective for the Company beginning in interim periods starting in fiscal year 2020, and does allow for early adoption. The Company is in the process of assessing the impact this ASU will have on its consolidated financial statements.
In January 2016, the FASB issued ASU No. 2016-01, Financial Instruments - Overall (Subtopic 825-10): Recognition and Measurement of Financial Assets and Financial Liabilities, which provides new guidance intended to improve the recognition, measurement, presentation and disclosure of financial instruments. This ASU is effective for the Company beginning in interim periods starting in fiscal year 2019. The adoption of this ASU is not expected to have a material impact on the Company's consolidated financial statements.
In July 2015, the FASB issued ASU No. 2015-11, Simplifying the Measurement of Inventory, which provides new guidance to simplify the measurement of inventory valuation at the lower of cost or net realizable value. Net realizable value is the estimated selling price in the ordinary course of business, less reasonably predictable costs of completion, disposal, and transportation. The new inventory measurement requirements are effective for the Company's 2018 fiscal year, and will replace the current inventory valuation guidance that requires the use of a lower of cost or market framework. The adoption of this ASU is not expected to have a material impact on the Company's consolidated financial statements.
In May 2014, the FASB issued ASU No. 2014-09, Revenue from Contracts with Customers: Topic 606. This ASU replaces nearly all existing U.S. GAAP guidance on revenue recognition. The standard prescribes a five-step model for recognizing revenue, the application of which will require significant judgment. The FASB issued ASU 2015-14 in August 2015 which resulted in a deferral of the original effective date of ASU 2014-09. During 2016, the FASB issued four ASUs that address implementation issues and correct or improve certain aspects of the new revenue recognition guidance, including ASU 2016-08, Principal versus Agent Considerations (Reporting Revenue Gross versus Net), ASU 2016-10, Identifying Performance Obligations and Licensing, ASU 2016-12, Narrow-Scope Improvements and Practical Expedients and ASU 2016-20, Technical Corrections and Improvements to Topic 606, Revenue from Contracts with Customers. These ASUs do not change the core principles in the revenue recognition guidance outlined above. ASU No. 2014-09 and the related ASUs referenced above are effective for Matthews beginning October 1, 2018. The Company is in the process of completing its initial detailed review of all global revenue arrangements in accordance with these ASUs and assessing the impact these ASUs will have on its consolidated financial statements.
NOTES TO CONSOLIDATED FINANCIAL STATEMENTS (continued)
(Dollar amounts in thousands, except per share data)
3. ACCOUNTING PRONOUNCEMENTS, (continued)
Adopted
In March 2016, the FASB issued ASU No. 2016-09, Compensation - Stock Compensation (Topic 718): Improvements to Employee Share-Based Payment Accounting, which provides new guidance intended to simplify the accounting surrounding share-based compensation. Under the new guidance, all excess tax benefits related to share-based compensation are recognized as a component of income tax expense, and will no longer be recognized within additional paid-in capital. The Company has early adopted this ASU in the fourth quarter of fiscal 2017, which, under the prospective method, includes retroactive application of the ASU beginning October 1, 2016 (beginning of the fiscal year). This ASU allows for an accounting policy election to estimate the number of awards that are expected to vest or account for forfeitures when they occur. The Company elected to maintain its current forfeitures policy and will continue to include an estimate of those forfeitures when recognizing stock-based compensation expense. The adoption of this ASU in fiscal 2017 resulted in a reduction to income tax expense of $1,234, and a corresponding favorable impact on diluted earnings per share of $0.04, both of which have been retroactively included in the first quarter results for fiscal 2017.
In June 2014, the FASB issued ASU No. 2014-12, Compensation - Stock Compensation (Topic 718), which provides new guidance intended to clarify the diverse accounting treatment for certain share-based payments. Share-based payments with performance targets that could be achieved after the requisite service period should be treated as performance conditions under the existing guidance in ASC Topic 718. The adoption of this ASU in the first quarter ended December 31, 2016 had no impact on the Company's consolidated financial statements.
4. FAIR VALUE MEASUREMENTS:
Fair value is defined as the price that would be received to sell an asset or paid to transfer a liability in an orderly transaction between market participants at the measurement date. A three level fair value hierarchy is used to prioritize the inputs used in valuations, as defined below:
Level 1: Observable inputs that reflect unadjusted quoted prices for identical assets or liabilities in active markets.
Level 2: Inputs other than quoted prices included within Level 1 that are observable for the asset or liability, either directly or indirectly.
Level 3: Unobservable inputs for the asset or liability.
As of September 30, 2017 and 2016, the fair values of the Company's assets and liabilities measured on a recurring basis were categorized as follows:
|
| | | | | | | | | | | | | | | |
| September 30, 2017 |
| Level 1 | | Level 2 | | Level 3 | | Total |
Assets: | | | | | | | |
Derivatives (1) | $ | — |
| | $ | 3,990 |
| | $ | — |
| | $ | 3,990 |
|
Equity and fixed income mutual funds | — |
| | 21,649 |
| | — |
| | 21,649 |
|
Other investments | — |
| | 5,810 |
| | — |
| | 5,810 |
|
Total assets at fair value | $ | — |
| | $ | 31,449 |
| | $ | — |
| | $ | 31,449 |
|
| | | | | | | |
Liabilities: | |
| | |
| | |
| | |
|
Derivatives (1) | $ | — |
| | $ | 31 |
| | $ | — |
| | $ | 31 |
|
Total liabilities at fair value | $ | — |
| | $ | 31 |
| | $ | — |
| | $ | 31 |
|
| | | | | | | |
(1) Interest rate swaps are valued based on observable market swap rates and are classified within Level 2 of the fair value hierarchy. |
NOTES TO CONSOLIDATED FINANCIAL STATEMENTS (continued)
(Dollar amounts in thousands, except per share data)
4. FAIR VALUE MEASUREMENTS, (continued)
|
| | | | | | | | | | | | | | | |
| September 30, 2016 |
| Level 1 | | Level 2 | | Level 3 | | Total |
Assets: | | | | | | | |
Derivatives (1) | $ | — |
| | $ | 193 |
| | $ | — |
| | $ | 193 |
|
Equity and fixed income mutual funds | — |
| | 19,790 |
| | — |
| | 19,790 |
|
Other investments | — |
| | 5,127 |
| | — |
| | 5,127 |
|
Total assets at fair value | $ | — |
| | $ | 25,110 |
| | $ | — |
| | $ | 25,110 |
|
| | | | | | | |
Liabilities: | |
| | |
| | |
| | |
|
Derivatives (1) | $ | — |
| | $ | 6,027 |
| | $ | — |
| | $ | 6,027 |
|
Total liabilities at fair value | $ | — |
| | $ | 6,027 |
| | $ | — |
| | $ | 6,027 |
|
| | | | | | | |
(1) Interest rate swaps are valued based on observable market swap rates and are classified within Level 2 of the fair value hierarchy. |
5. INVENTORIES:
Inventories at September 30, 2017 and 2016 consisted of the following:
|
| | | | | | | |
| 2017 | | 2016 |
Raw materials | $ | 29,396 |
| | $ | 29,597 |
|
Work in process | 61,917 |
| | 54,357 |
|
Finished goods | 80,132 |
| | 78,518 |
|
| $ | 171,445 |
| | $ | 162,472 |
|
6. INVESTMENTS:
Investment securities are recorded at fair value and are classified as trading securities. Investments classified as trading securities primarily consisted of equity and fixed income mutual funds. The market value of these investments exceeded cost by $785 and $414 at September 30, 2017 and 2016, respectively. Realized and unrealized gains and losses are recorded in investment income. Realized gains (losses) for fiscal 2017, 2016 and 2015 were not material. Other investments include ownership interests in various entities of less than 20%, which are recorded under the cost method of accounting.
At September 30, 2017 and 2016, non-current investments were as follows:
|
| | | | | | | |
| 2017 | | 2016 |
Equity and fixed income mutual funds | $ | 21,649 |
| | $ | 19,790 |
|
Other investments | 16,018 |
| | 11,575 |
|
| $ | 37,667 |
| | $ | 31,365 |
|
NOTES TO CONSOLIDATED FINANCIAL STATEMENTS (continued)
(Dollar amounts in thousands, except per share data)
7. PROPERTY, PLANT AND EQUIPMENT:
Property, plant and equipment and the related accumulated depreciation at September 30, 2017 and 2016 were as follows:
|
| | | | | | | |
| 2017 | | 2016 |
Buildings | $ | 104,604 |
| | $ | 102,153 |
|
Machinery and equipment | 412,980 |
| | 378,650 |
|
| 517,584 |
| | 480,803 |
|
Less accumulated depreciation | (335,346 | ) | | (305,613 | ) |
| 182,238 |
| | 175,190 |
|
Land | 16,845 |
| | 19,705 |
|
Construction in progress | 36,450 |
| | 24,597 |
|
| $ | 235,533 |
| | $ | 219,492 |
|
Depreciation expense, including amortization of assets under capital lease, was $44,668, $44,659 and $43,820 for each of the three years ended September 30, 2017, 2016 and 2015, respectively.
8. LONG-TERM DEBT:
Long-term debt at September 30, 2017 and 2016 consisted of the following:
|
| | | | | | | |
| 2017 | | 2016 |
Revolving credit facilities | $ | 551,126 |
| | $ | 608,000 |
|
Securitization facility | 95,825 |
| | — |
|
Senior secured term loan | 232,479 |
| | 246,449 |
|
Notes payable to banks | 21,831 |
| | 5,301 |
|
Short-term borrowings | 4,735 |
| | 8,617 |
|
Capital lease obligations | 5,134 |
| | 4,187 |
|
| 911,130 |
| | 872,554 |
|
Less current maturities | (29,528 | ) | | (27,747 | ) |
| $ | 881,602 |
| | $ | 844,807 |
|
The Company has a domestic credit facility with a syndicate of financial institutions that includes a $900,000 senior secured revolving credit facility and a $250,000 senior secured term loan. The term loan requires scheduled principal payments of 5.0% of the outstanding principal in year one, 7.5% in year two, and 10.0% in years three through five, payable in quarterly installments. The balance of the revolving credit facility and the term loan are due on the maturity date of April 26, 2021. Borrowings under both the revolving credit facility and the term loan bear interest at LIBOR plus a factor ranging from 0.75% to 2.00% (1.75% at September 30, 2017) based on the Company's leverage ratio. The leverage ratio is defined as net indebtedness divided by adjusted EBITDA (earnings before interest, taxes, depreciation and amortization). The Company is required to pay an annual commitment fee ranging from 0.15% to 0.25% (based on the Company's leverage ratio) of the unused portion of the revolving credit facility.
NOTES TO CONSOLIDATED FINANCIAL STATEMENTS (continued)
(Dollar amounts in thousands, except per share data)
8. LONG-TERM DEBT, (continued)
The domestic credit facility requires the Company to maintain certain leverage and interest coverage ratios. A portion of the facility (not to exceed $35,000) is available for the issuance of trade and standby letters of credit. Outstanding borrowings on the revolving credit facility at September 30, 2017 and 2016 were $525,000 and $608,000, respectively. Outstanding borrowings on the term loan at September 30, 2017 and 2016 was $232,479 and $246,449, respectively. The weighted-average interest rate on outstanding borrowings for the domestic credit facility (including the effects of interest rate swaps) at September 30, 2017 and 2016 was 3.01% and 2.59%, respectively.
During fiscal 2017, the Company entered into a two-year $115,000 accounts receivable securitization facility (the "Securitization Facility") with certain financial institutions. Under the Securitization Facility, the Company and certain of its domestic subsidiaries sell, on a continuous basis without recourse, their trade receivables to Matthews Receivables Funding Corporation, LLC (“Matthews RFC”), a wholly-owned bankruptcy-remote subsidiary of the Company. Matthews RFC in turn assigns a collateral interest in these receivables to certain financial institutions, and then may borrow funds under the Securitization Facility. The Securitization Facility does not qualify for sale treatment. Accordingly, the trade receivables and related debt obligations remain on the Company's Consolidated Balance Sheet. Borrowings under the Securitization Facility bear interest at LIBOR plus 0.75%. The Company is required to pay an annual commitment fee ranging from 0.25% to 0.35% of the unused portion of the Securitization Facility. The Company had $95,825 in outstanding borrowings under the Securitization Facility as of September 30, 2017. At September 30, 2017, the interest rate on borrowings under this facility was 1.98%.
The following table presents information related to interest rate contracts entered into by the Company and designated as cash flow hedges:
|
| | | | | | | | |
| | September 30, 2017 | | September 30, 2016 |
Pay fixed swaps - notional amount | | $ | 414,063 |
| | $ | 403,125 |
|
Net unrealized gain (loss) | | $ | 3,959 |
| | $ | (5,834 | ) |
Weighted-average maturity period (years) | | 3.3 |
| | 3.9 |
|
Weighted-average received rate | | 1.23 | % | | 0.53 | % |
Weighted-average pay rate | | 1.34 | % | | 1.26 | % |
The Company enters into interest rate swaps in order to achieve a mix of fixed and variable rate debt that it deems appropriate. The interest rate swaps have been designated as cash flow hedges of future variable interest payments which are considered probable of occurring. Based on the Company's assessment, all of the critical terms of each of the hedges matched the underlying terms of the hedged debt and related forecasted interest payments, and as such, these hedges were considered highly effective.
The fair value of the interest rate swaps reflected an unrealized gain, net of unrealized losses, of $3,959 ($2,415 after tax) and an unrealized loss, net of unrealized gains, of $5,834 ($3,559 after tax) at September 30, 2017 and 2016, respectively, that is included in shareholders' equity as part of accumulated other comprehensive income ("AOCI"). Assuming market rates remain constant with the rates at September 30, 2017, a gain (net of tax) of approximately $666 included in AOCI is expected to be recognized in earnings over the next twelve months.
NOTES TO CONSOLIDATED FINANCIAL STATEMENTS (continued)
(Dollar amounts in thousands, except per share data)
8. LONG-TERM DEBT, (continued)
At September 30, 2017 and 2016, the interest rate swap contracts were reflected on a gross-basis in the consolidated balance sheets as follows:
|
| | | | | | | |
Derivatives: | 2017 | | 2016 |
Current assets: | | | |
Other current assets | $ | 1,098 |
| | $ | 43 |
|
Long-term assets: | |
| | |
|
Other assets | 2,892 |
| | 150 |
|
Current liabilities: | |
| | |
|
Other current liabilities | (7 | ) | | (1,529 | ) |
Long-term liabilities: | |
| | |
|
Other liabilities | (24 | ) | | (4,498 | ) |
Total derivatives | $ | 3,959 |
| | $ | (5,834 | ) |
The gains (losses) recognized on derivatives was as follows:
|
| | | | | | | | |
Derivatives in Cash Flow Hedging Relationships | | Location of Gain (Loss) Recognized in Income on Derivatives | | Amount of Gain (Loss) Recognized in Income on Derivatives |
| | | | 2017 | | 2016 | | 2015 |
Interest rate swaps | | Interest expense | | $1,752 | | $(3,146) | | $(3,922) |
The Company recognized the following gains (losses) in AOCI:
|
| | | | | | | | | | | | | | |
Derivatives in Cash Flow Hedging Relationships | | Amount of Gain (Loss) Recognized in AOCI on Derivatives | | Location of Gain or (Loss) Reclassified from AOCI into Income | | Amount of Gain (Loss) Reclassified from AOCI into Income(Effective Portion*) |
| | 2017 | | 2016 | | 2015 | | (Effective Portion*) | | 2017 | | 2016 | | 2015 |
| | | | | | | | | | | | | | |
Interest rate swaps | | $7,043 | | $(3,230) | | $(4,841) | | Interest expense | | $1,069 | | $(1,919) | | $(2,392) |
| | | | | | | | | | | | | | |
*There is no ineffective portion or amount excluded from effectiveness testing. | | |
The Company, through certain of its European subsidiaries, has a credit facility with a European bank, which is guaranteed by Matthews International Corporation. The maximum amount of borrowings available under this facility is €35.0 million ($41,345). The credit facility matures in December 2018 and the Company intends to extend this facility. Outstanding borrowings under this facility were €22.1 million ($26,126) at September 30, 2017. There were no outstanding borrowings under this facility at September 30, 2016. The weighted-average interest rate on this facility at September 30, 2017 was 1.75%.
In November 2016, the Company’s German subsidiary, Matthews Europe GmbH & Co. KG, issued €15.0 million ($17,719 at September 30, 2017) of senior unsecured notes with European banks. The notes are guaranteed by Matthews International Corporation and mature in November 2019. A portion of the notes (€5.0 million) have a fixed interest rate of 1.40%, and the remainder bear interest at Euro LIBOR plus 1.40%. The weighted-average interest rate on the notes at September 30, 2017 was 1.40%.
NOTES TO CONSOLIDATED FINANCIAL STATEMENTS (continued)
(Dollar amounts in thousands, except per share data)
8. LONG-TERM DEBT, (continued)
The Company, through its Italian subsidiary, Matthews International S.p.A., has several loans with various Italian banks. Outstanding borrowings on these loans totaled €2.6 million ($3,079) and €3.2 million ($3,538) at September 30, 2017 and 2016, respectively. The maturity dates for these loans range from October 2017 through November 2019. Matthews International S.p.A. also has multiple on-demand lines of credit totaling €11.3 million ($13,384) with the same Italian banks. Outstanding borrowings on these lines were €4.0 million ($4,735) and €5.2 million ($5,801) at September 30, 2017 and 2016, respectively. The weighted-average interest rate on outstanding Matthews International S.p.A. borrowings at September 30, 2017 and 2016 was 2.20% and 1.80%, respectively.
Other debt totaled $1,032 and $4,579 at September 30, 2017 and 2016, respectively. The weighted-average interest rate on these outstanding borrowings was 5.04% and 3.31% at September 30, 2017 and 2016, respectively.
In September 2014, a claim was filed seeking to draw upon a letter of credit issued by the Company of £8,570,000 ($11,477 at September 30, 2017) with respect to a performance guarantee on a project in Saudi Arabia. Management assessed the customer's demand to be without merit and initiated an action with the court in the United Kingdom (the "Court"). Pursuant to this action, an order was issued by the Court in January 2015 requiring that, upon receipt by the customer, the funds were to be remitted by the customer to the Court pending resolution of the dispute between the parties. As a result, the Company made payment on the draw to the financial institution for the letter of credit and the funds were ultimately received by the customer. The customer did not remit the funds to the Court as ordered. On June 14, 2016, the Court ruled completely in favor of Matthews following a trial on the merits. However, as the customer has neither yet remitted the funds nor complied with the final, un-appealed orders of the Court, it is possible the resolution of this matter could have an unfavorable financial impact on Matthews’ results of operations. As of September 30, 2017, the Company has determined that resolution of this matter may take an extended period of time and therefore has reclassified the funded letter of credit from other current assets to other assets on the Consolidated Balance Sheet. The Company will continue to assess collectability related to this matter as facts and circumstances evolve. As of September 30, 2016, the Company presented the funded letter of credit within other current assets on the Consolidated Balance Sheet.
As of September 30, 2017 and 2016, the fair value of the Company's long-term debt, including current maturities, which is classified as Level 2 in the fair value hierarchy, approximated the carrying value included in the Consolidated Balance Sheets.
Aggregate maturities of long-term debt, including short-term borrowings and capital leases, is as follows:
|
| | | |
2018 | $ | 29,528 |
|
2019 | 166,012 |
|
2020 | 25,487 |
|
2021 | 687,504 |
|
2022 | 242 |
|
Thereafter | 2,357 |
|
| $ | 911,130 |
|
9. SHAREHOLDERS' EQUITY:
The authorized common stock of the Company consists of 70,000,000 shares of Class A Common Stock, $1.00 par value.
The Company has a stock repurchase program. The buy-back program is designed to increase shareholder value, enlarge the Company's holdings of its common stock, and add to earnings per share. Repurchased shares may be retained in treasury, utilized for acquisitions, or reissued to employees or other purchasers, subject to the restrictions of the Company's Restated Articles of Incorporation. Under the current authorization, the Company's Board of Directors has authorized the repurchase of a total of 5,000,000 shares of Matthews' common stock under the program, of which 1,816,146 shares remain available for repurchase as of September 30, 2017.
NOTES TO CONSOLIDATED FINANCIAL STATEMENTS (continued)
(Dollar amounts in thousands, except per share data)
10. SHARE-BASED PAYMENTS:
The Company maintains an equity incentive plan (the "2012 Equity Incentive Plan") that provides for grants of stock options, restricted shares, stock-based performance units and certain other types of stock-based awards. Under the 2012 Equity Incentive Plan, which has a ten years term, the maximum number of shares available for grants or awards is an aggregate of 2,500,000. At September 30, 2017, there were 589,238 shares reserved for future issuance under the 2012 Equity Incentive Plan. The 2012 Equity Incentive Plan is administered by the Compensation Committee of the Board of Directors.
The option price for each stock option granted under any of the plans may not be less than the fair market value of the Company's Class A Common Stock on the date of grant. As of September 30, 2017, there were no stock options outstanding.
With respect to outstanding restricted share grants, for grants made prior to fiscal 2013, generally one-half of the shares vested on the third anniversary of the grant, with the remaining one-half of the shares vesting in one-third increments upon attainment of pre-defined levels of appreciation in the market value of the Company's Class A Common Stock. For grants made in and after fiscal 2013, generally one-half of the shares vest on the third anniversary of the grant, one-quarter of the shares vest in one-third increments upon the attainment of pre-defined levels of adjusted earnings per share, and the remaining one-quarter of the shares vest in one-third increments upon attainment of pre-defined levels of appreciation in the market value of the Company's Class A Common Stock. Additionally, restricted shares cannot vest until the first anniversary of the grant date. Unvested restricted shares generally expire on the earlier of three or five years from the date of grant, upon employment termination, or within specified time limits following voluntary employment termination (with the consent of the Company), retirement or death. The Company issues restricted shares from treasury shares.
For the years ended September 30, 2017, 2016 and 2015, stock-based compensation cost totaled $14,562, $10,612 and $9,097, respectively. The year ended September 30, 2017 included $3,337 of stock-based compensation cost that was recognized at the time of grant for retirement-eligible employees. The associated future income tax benefit recognized was $5,534, $4,139 and $3,548 for the years ended September 30, 2017, 2016 and 2015, respectively.
The amount of cash received from the exercise of stock options was $14, $6,406 and $4,015, for the years ended September 30, 2017, 2016 and 2015, respectively. In connection with these exercises, the tax benefits realized by the Company were $3, $932 and $350 for the years ended September 30, 2017, 2016 and 2015, respectively.
The transactions for restricted stock for the year ended September 30, 2017 were as follows:
|
| | | | | | |
| Shares | | Weighted- average Grant-date Fair Value |
Non-vested at September 30, 2016 | 522,710 |
| | $ | 45.10 |
|
Granted | 216,655 |
| | 66.61 |
|
Vested | (231,231 | ) | | 46.57 |
|
Expired or forfeited | (6,950 | ) | | 50.29 |
|
Non-vested at September 30, 2017 | 501,184 |
| | $ | 53.65 |
|
As of September 30, 2017, the total unrecognized compensation cost related to unvested restricted stock was $7,205 which is expected to be recognized over a weighted-average period of 1.5 years.
NOTES TO CONSOLIDATED FINANCIAL STATEMENTS (continued)
(Dollar amounts in thousands, except per share data)
10. SHARE-BASED PAYMENTS, (continued)
The transactions for shares under options for the year ended September 30, 2017 were as follows:
|
| | | | | | | | | | | | | |
| Shares | | Weighted- average Exercise Price | | Weighted- average Remaining Contractual Term | | Aggregate Intrinsic Value |
Outstanding, September 30, 2016 | 77,733 |
| | $ | 40.56 |
| | | | |
Exercised | (333 | ) | | 40.56 |
| | | | |
Expired or forfeited | (77,400 | ) | | 40.56 |
| | | | |
Outstanding, September 30, 2017 | — |
| | $ | — |
| | — |
| | $ | — |
|
Exercisable, September 30, 2017 | — |
| | $ | — |
| | — |
| | $ | — |
|
No options vested during the year ended September 30, 2017 and 2016, respectively. The intrinsic value of options (which is the amount by which the stock price exceeded the exercise price of the options on the date of exercise) exercised during the years ended September 30, 2017, 2016 and 2015 was $9, $2,692 and $931, respectively.
The transactions for non-vested option shares for the year ended September 30, 2017 were as follows:
|
| | | | | | |
| Shares | | Weighted- average Grant-date Fair Value |
Non-vested at September 30, 2016 | 77,400 |
| | $ | 12.29 |
|
Expired or forfeited | (77,400 | ) | | 12.29 |
|
Non-vested at September 30, 2017 | — |
| | $ | — |
|
The fair value of each restricted stock grant is estimated on the date of grant using a binomial lattice valuation model. The following table indicates the assumptions used in estimating fair value of restricted stock for the years ended September 30, 2017, 2016 and 2015.
|
| | | | | | | | |
| 2017 | | 2016 | | 2015 |
Expected volatility | 20.2 | % | | 20.7 | % | | 22.2 | % |
Dividend yield | 1.1 | % | | 1.0 | % | | 1.0 | % |
Average risk-free interest rate | 1.7 | % | | 1.7 | % | | 1.7 | % |
Average expected term (years) | 2.1 |
| | 2.1 |
| | 1.8 |
|
The risk-free interest rate is based on United States Treasury yields at the date of grant. The dividend yield is based on the most recent dividend payment and average stock price over the 12 months prior to the grant date. Expected volatilities are based on the historical volatility of the Company's stock price. The expected term for grants in the years ended September 30, 2017, 2016 and 2015 represents an estimate of the average period of time for restricted shares to vest. The option characteristics for each grant are considered separately for valuation purposes.
NOTES TO CONSOLIDATED FINANCIAL STATEMENTS (continued)
(Dollar amounts in thousands, except per share data)
10. SHARE-BASED PAYMENTS, (continued)
The Company maintains the 1994 Director Fee Plan and the Amended and Restated 2014 Director Fee Plan (collectively, the "Director Fee Plans"). There will be no further fees or share-based awards granted under the 1994 Director Fee Plan. Under the Amended and Restated 2014 Director Fee Plan, non-employee directors (except for the Chairman of the Board) each receive, as an annual retainer fee for fiscal 2017, either cash or shares of the Company's Class A Common Stock with a value equal to $75. The annual retainer fee for fiscal 2017 paid to a non-employee Chairman of the Board is $175. Where the annual retainer fee is provided in shares, each director may elect to be paid these shares on a current basis or have such shares credited to a deferred stock account as phantom stock, with such shares to be paid to the director subsequent to leaving the Board. The value of deferred shares is recorded in other liabilities. A total of 16,139 shares had been deferred under the Director Fee Plans at September 30, 2017. Additionally, non-employee directors each receive an annual stock-based grant (non-statutory stock options, stock appreciation rights and/or restricted shares) with a value of $125 for fiscal year 2017. A total of 22,300 stock options have been granted under the Director Fee Plans. At September 30, 2017, there were no options outstanding. Additionally, 161,724 shares of restricted stock have been granted under the Director Fee Plans, 58,574 of which were issued under the Amended and Restated 2014 Director Fee Plan. 25,157 shares of restricted stock are unvested at September 30, 2017. A total of 150,000 shares have been authorized to be issued under the Amended and Restated 2014 Director Fee Plan.
11. EARNINGS PER SHARE:
The information used to compute earnings per share attributable to Matthews' common shareholders was as follows:
|
| | | | | | | | | | | |
| 2017 | | 2016 | | 2015 |
Net income attributable to Matthews shareholders | $ | 74,368 |
| | $ | 66,749 |
| | $ | 63,449 |
|
Less: dividends and undistributed earnings allocated to participating securities | — |
| | — |
| | 10 |
|
Net income available to Matthews shareholders | $ | 74,368 |
| | $ | 66,749 |
| | $ | 63,439 |
|
| | | | | |
Weighted-average shares outstanding (in thousands): | |
| | |
| | |
|
Basic shares | 32,240 |
| | 32,642 |
| | 32,939 |
|
Effect of dilutive securities | 330 |
| | 262 |
| | 257 |
|
Diluted shares | 32,570 |
| | 32,904 |
| | 33,196 |
|
| | | | | |
Anti-dilutive securities excluded from the dilutive calculation were insignificant for the fiscal years ended September 30, 2017, 2016, and 2015.
NOTES TO CONSOLIDATED FINANCIAL STATEMENTS (continued)
(Dollar amounts in thousands, except per share data)
12. PENSION AND OTHER POSTRETIREMENT PLANS:
The Company provides defined benefit pension and other postretirement plans to certain employees. Effective January 1, 2014, the Company's principal retirement plan was closed to new participants. The following provides a reconciliation of benefit obligations, plan assets and funded status of the plans as of the Company's actuarial valuation as of September 30, 2017 and 2016:
|
| | | | | | | | | | | | | | | |
| Pension | | Other Postretirement |
| 2017 | | 2016 | | 2017 | | 2016 |
Change in benefit obligation: | | | | | | | |
Benefit obligation, beginning of year | $ | 263,566 |
| | $ | 238,727 |
| | $ | 23,290 |
| | $ | 20,424 |
|
Service cost | 8,553 |
| | 7,446 |
| | 392 |
| | 402 |
|
Interest cost | 7,362 |
| | 9,725 |
| | 626 |
| | 845 |
|
Actuarial (gain) loss | (4,264 | ) | | 26,841 |
| | (2,600 | ) | | 2,931 |
|
Exchange loss (gain) | 589 |
| | (6 | ) | | — |
| | — |
|
Benefit payments | (16,134 | ) | | (19,167 | ) | | (1,392 | ) | | (1,312 | ) |
Benefit obligation, end of year | 259,672 |
| | 263,566 |
| | 20,316 |
| | 23,290 |
|
| | | | | | | |
Change in plan assets: | |
| | |
| | |
| | |
|
Fair value, beginning of year | 151,864 |
| | 142,225 |
| | — |
| | — |
|
Actual return | 12,586 |
| | 11,244 |
| | — |
| | — |
|
Benefit payments (1) | (16,134 | ) | | (19,167 | ) | | (1,392 | ) | | (1,312 | ) |
Employer contributions | 7,318 |
| | 17,562 |
| | 1,392 |
| | 1,312 |
|
Fair value, end of year | 155,634 |
| | 151,864 |
| | — |
| | — |
|
| | | | | | | |
Funded status | (104,039 | ) | | (111,701 | ) | | (20,317 | ) | | (23,291 | ) |
Unrecognized actuarial loss (gain) | 73,616 |
| | 92,310 |
| | (1,469 | ) | | 1,130 |
|
Unrecognized prior service cost | (690 | ) | | (1,048 | ) | | (720 | ) | | (916 | ) |
Net amount recognized | $ | (31,113 | ) | | $ | (20,439 | ) | | $ | (22,506 | ) | | $ | (23,077 | ) |
| | | | | | | |
Amounts recognized in the consolidated balance sheet: | |
| | |
| | |
| | |
|
Current liability | $ | (766 | ) | | $ | (760 | ) | | $ | (1,044 | ) | | $ | (1,148 | ) |
Noncurrent benefit liability | (103,273 | ) | | (110,941 | ) | | (19,273 | ) | | (22,143 | ) |
Accumulated other comprehensive loss (income) | 72,926 |
| | 91,262 |
| | (2,189 | ) | | 214 |
|
Net amount recognized | $ | (31,113 | ) | | $ | (20,439 | ) | | $ | (22,506 | ) | | $ | (23,077 | ) |
| | | | | | | |
Amounts recognized in accumulated | |
| | |
| | |
| | |
|
other comprehensive loss (income): | |
| | |
| | |
| | |
|
Net actuarial loss (income) | $ | 73,616 |
| | $ | 92,310 |
| | $ | (1,469 | ) | | $ | 1,130 |
|
Prior service cost | (690 | ) | | (1,048 | ) | | (720 | ) | | (916 | ) |
Net amount recognized | $ | 72,926 |
| | $ | 91,262 |
| | $ | (2,189 | ) | | $ | 214 |
|
(1) Pension benefit payments in fiscal 2017 and 2016 include $5,655 and $9,300 of lump sum distributions, respectively, that were made to certain terminated vested employees as settlements of the employees' pension obligations. These distributions did not meet the threshold to qualify as settlements under U.S. GAAP and therefore, no unamortized actuarial losses were recognized in the Statements of Income upon completion of the lump sum distributions.
NOTES TO CONSOLIDATED FINANCIAL STATEMENTS (continued)
(Dollar amounts in thousands, except per share data)
12. PENSION AND OTHER POSTRETIREMENT PLANS, (continued)
Based upon actuarial valuations performed as of September 30, 2017 and 2016, the accumulated benefit obligation for the Company's defined benefit pension plans was $238,307 and $240,329 at September 30, 2017 and 2016, respectively, and the projected benefit obligation for the Company's defined benefit pension plans was $259,672 and $263,566 at September 30, 2017 and 2016, respectively.
Net periodic pension and other postretirement benefit cost for the plans included the following:
|
| | | | | | | | | | | | | | | | | | | | | | | |
| Pension | | Other Postretirement |
| 2017 | | 2016 | | 2015 | | 2017 | | 2016 | | 2015 |
Service cost | $ | 8,553 |
| | $ | 7,446 |
| | $ | 6,764 |
| | $ | 392 |
| | $ | 402 |
| | $ | 454 |
|
Interest cost | 7,362 |
| | 9,725 |
| | 8,740 |
| | 626 |
| | 845 |
| | 885 |
|
Expected return on plan assets | (9,249 | ) | | (9,625 | ) | | (10,151 | ) | | — |
| | — |
| | — |
|
Amortization: | |
| | |
| | |
| | |
| | |
| | |
|
Prior service cost | (181 | ) | | (183 | ) | | (180 | ) | | (195 | ) | | (195 | ) | | (195 | ) |
Net actuarial loss (gain) | 10,034 |
| | 7,468 |
| | 6,203 |
| | — |
| | — |
| | — |
|
Net benefit cost | $ | 16,519 |
| | $ | 14,831 |
| | $ | 11,376 |
| | $ | 823 |
| | $ | 1,052 |
| | $ | 1,144 |
|
Effective September 30, 2016, the Company changed the method used to estimate the service and interest components of net periodic benefit cost for its pensions. This change, compared to the previous method, resulted in a decrease in the service and interest components for pension cost beginning in fiscal 2017. Historically, the Company estimated these service and interest cost components utilizing a single weighted-average discount rate derived from the yield curve used to measure the benefit obligation at the beginning of the period. Matthews has elected to utilize a full yield curve approach in the estimation of these components by applying the specific spot rates along the yield curve used in the determination of the benefit obligation to the relevant projected cash flows. This change was made to provide a more precise measurement of service and interest costs by improving the correlation between projected benefit cash flows to the corresponding spot yield curve rates. This change does not affect the measurement of the total benefit obligations. The Company has accounted for this change as a change in accounting estimate that is inseparable from a change in accounting principle and accordingly, has accounted for it prospectively. This change resulted in a reduction of service and interest costs of approximately $1,960 in fiscal 2017.
Benefit payments under the Company's principal retirement plan are made from plan assets, while benefit payments under the supplemental retirement plan and postretirement benefit plan are made from the Company's operating cash. Under I.R.S. regulations, the Company was required to make a $5,109 contribution to its principal retirement plan in fiscal 2017. The Company is not required to make any significant cash contributions to its principal retirement plan in fiscal 2018.
Contributions made in fiscal 2017 are as follows:
|
| | | | | | | |
Contributions | Pension | | Other Postretirement |
Principal retirement plan | $ | 6,180 |
| | $ | — |
|
Supplemental retirement plan | 725 |
| | — |
|
Other retirement plans | 413 |
| | — |
|
Other postretirement plan | — |
| | 1,392 |
|
NOTES TO CONSOLIDATED FINANCIAL STATEMENTS (continued)
(Dollar amounts in thousands, except per share data)
12. PENSION AND OTHER POSTRETIREMENT PLANS, (continued)
Amounts of AOCI expected to be recognized in net periodic benefit costs in fiscal 2018 include:
|
| | | | | | | |
| Pension Benefits | | Other Postretirement Benefits |
Net actuarial loss | $ | 7,010 |
| | $ | — |
|
Prior service cost | (138 | ) | | (195 | ) |
The weighted-average assumptions in the following table represent the rates used to develop the actuarial present value of the projected benefit obligation for the year listed and also the net periodic benefit cost for the following year. The measurement date of annual actuarial valuations for the Company's principal retirement and other postretirement benefit plans was September 30, for fiscal 2017, 2016 and 2015. The weighted-average assumptions for those plans were:
|
| | | | | | | | | | | | | | | | | |
| Pension | | Other Postretirement |
| 2017 | | 2016 | | 2015 | | 2017 | | 2016 | | 2015 |
Discount rate | 3.76 | % | | 3.51 | % | | 4.25 | % | | 3.72 | % | | 3.42 | % | | 4.25 | % |
Return on plan assets | 6.75 | % | | 7.25 | % | | 7.75 | % | | — |
| | — |
| | — |
|
Compensation increase | 3.50 | % | | 3.50 | % | | 3.50 | % | | — |
| | — |
| | — |
|
In October 2014, the Society of Actuaries' Retirement Plans Experience Committee (RPEC) released new mortality tables known as RP 2014. Each year, RPEC releases an update to the mortality improvement assumption that was released with the RP 2014 tables. The Company considered the RPEC mortality and mortality improvement tables and performed a review of its own mortality history to assess the appropriateness of the RPEC tables for use in generating financial results. In fiscal years 2017, 2016 and 2015 , the Company elected to value its principal retirement and other postretirement benefit plan liabilities using the base RP 2014 mortality table and a slightly modified fully generational mortality improvement assumption. The revised assumption uses the most recent RPEC mortality improvement table for all years where the RPEC tables are based on finalized data, and the most recently published Social Security Administration Intermediate mortality improvement for subsequent years.
The underlying basis of the investment strategy of the Company's defined benefit plans is to ensure the assets are invested to achieve a positive rate of return over the long term sufficient to meet the plans' actuarial interest rate and provide for the payment of benefit obligations and expenses in perpetuity in a secure and prudent fashion, maintain a prudent risk level that balances growth with the need to preserve capital, diversify plan assets so as to minimize the risk of large losses or excessive fluctuations in market value from year to year, achieve investment results over the long term that compare favorably with other pension plans and appropriate indices. The Company's investment policy, as established by the Company's pension board, specifies the types of investments appropriate for the plans, asset allocation guidelines, criteria for the selection of investment managers, procedures to monitor overall investment performance as well as investment manager performance. It also provides guidelines enabling plan fiduciaries to fulfill their responsibilities.
NOTES TO CONSOLIDATED FINANCIAL STATEMENTS (continued)
(Dollar amounts in thousands, except per share data)
12. PENSION AND OTHER POSTRETIREMENT PLANS, (continued)
Effective August 1, 2017, the Company merged the IDL, Inc. retirement income plan and the Aurora Casket Company, LLC pension plan into the Company’s principal pension plan. No changes were made to the benefit formulas, vesting provisions, or to the employees covered by the plans.
The Company's defined benefit pension plans' weighted-average asset allocation at September 30, 2017 and 2016 and weighted-average target allocation were as follows:
|
| | | | | | | | | | |
| Plan Assets at | | Target |
Asset Category | 2017 | | 2016 | | Allocation* |
Equity securities | $ | 77,245 |
| | $ | 58,849 |
| | 50 | % |
Fixed income, cash and cash equivalents | 49,008 |
| | 72,495 |
| | 30 | % |
Other investments | 29,381 |
| | 20,520 |
| | 20 | % |
| $ | 155,634 |
| | $ | 151,864 |
| | 100 | % |
| | | | | |
* Target allocation relates to the Company's primary defined benefit pension plan | | | | | |
Based on an analysis of the historical and expected future performance of the plan's assets and information provided by its independent investment advisor, the Company set the long-term rate of return assumption for its primary defined benefit pension plans' assets at 6.75% in 2017 for purposes of determining pension cost and funded status under current guidance. The Company's discount rate assumption used in determining the present value of the projected benefit obligation is based upon published indices.
The Company categorizes plan assets within a three level fair value hierarchy (see Note 4 for a further discussion of the fair value hierarchy). The valuation methodologies used to measure the fair value of pension assets, including the level in the fair value hierarchy in which each type of pension plan asset is classified as follows.
Equity securities consist of direct investments in the stocks of publicly traded companies. Such investments are valued based on the closing price reported in an active market on which the individual securities are traded. As such, the direct investments are classified as Level 1.
Mutual funds are valued at the closing price of shares held by the Plan at year end. As such, these mutual fund investments are classified as Level 1.
Fixed income securities consist of publicly traded fixed interest obligations (primarily U.S. government notes and corporate and agency bonds). Such investments are valued through consultation and evaluation with brokers in the institutional market using quoted prices and other observable market data. As such, U.S. government notes are included in Level 1, and the remainder of the fixed income securities are included in Level 2.
Cash and cash equivalents consist of direct cash holdings and short-term money market mutual funds. These values are valued based on cost, which approximates fair value, and as such, are classified as Level 1.
Other investments consist primarily of real estate, commodities, private equity holdings and hedge fund investments. These holdings are valued by investment managers based on the most recent information available. The valuation information used by investment managers may not be readily observable. As such, these investments are classified as Level 3.
NOTES TO CONSOLIDATED FINANCIAL STATEMENTS (continued)
(Dollar amounts in thousands, except per share data)
12. PENSION AND OTHER POSTRETIREMENT PLANS, (continued)
The Company's defined benefit pension plans' asset categories at September 30, 2017 and 2016 were as follows:
|
| | | | | | | | | | | | | | | |
| September 30, 2017 |
Asset Category | Level 1 | | Level 2 | | Level 3 | | Total |
Equity securities - stocks | $ | 42,731 |
| | $ | — |
| | $ | — |
| | $ | 42,731 |
|
Equity securities - mutual funds | 34,514 |
| | — |
| | — |
| | 34,514 |
|
Fixed income securities | 30,032 |
| | 14,870 |
| | — |
| | 44,902 |
|
Cash and cash equivalents | 4,106 |
| | — |
| | — |
| | 4,106 |
|
Other investments | 19,901 |
| | — |
| | 9,480 |
| | 29,381 |
|
Total | $ | 131,284 |
| | $ | 14,870 |
| | $ | 9,480 |
| | $ | 155,634 |
|
|
| | | | | | | | | | | | | | | |
| September 30, 2016 |
Asset Category | Level 1 | | Level 2 | | Level 3 | | Total |
Equity securities - stocks | $ | 35,912 |
| | $ | — |
| | $ | — |
| | $ | 35,912 |
|
Equity securities - mutual funds | 22,937 |
| | — |
| | — |
| | 22,937 |
|
Fixed income securities | 41,099 |
| | 11,732 |
| | — |
| | 52,831 |
|
Cash and cash equivalents | 19,664 |
| | — |
| | — |
| | 19,664 |
|
Other investments | 7,694 |
| | 10 |
| | 12,816 |
| | 20,520 |
|
Total | $ | 127,306 |
| | $ | 11,742 |
| | $ | 12,816 |
| | $ | 151,864 |
|
Changes in the fair value of Level 3 assets at September 30, 2017 and 2016 are summarized as follows:
|
| | | | | | | | | | | | | | | | | | | | | | | |
Asset Category | Fair Value, Beginning of Period | | Acquisitions | | Dispositions | | Realized Gains | | Unrealized Gains (Losses) | | Fair Value, End of Period |
Other investments: | | | | | | | | | | | |
Fiscal Year Ended: | | | | | | | | | | | |
September 30, 2017 | $ | 12,816 |
| | $ | — |
| | $ | (3,286 | ) | | $ | 418 |
| | $ | (468 | ) | | $ | 9,480 |
|
September 30, 2016 | 13,982 |
| | — |
| | (941 | ) | | 449 |
| | (674 | ) | | 12,816 |
|
NOTES TO CONSOLIDATED FINANCIAL STATEMENTS (continued)
(Dollar amounts in thousands, except per share data)
12. PENSION AND OTHER POSTRETIREMENT PLANS, (continued)
Benefit payments expected to be paid are as follows:
|
| | | | | | | |
Years ending September 30: | Pension Benefits | | Other Postretirement Benefits |
| | | |
2018 | $ | 10,137 |
| | $ | 1,044 |
|
2019 | 10,586 |
| | 1,072 |
|
2020 | 10,983 |
| | 1,013 |
|
2021 | 11,447 |
| | 1,044 |
|
2022 | 12,811 |
| | 1,094 |
|
2023-2027 | 72,463 |
| | 6,004 |
|
| $ | 128,427 |
| | $ | 11,271 |
|
For measurement purposes, a rate of increase of 7.3% in the per capita cost of health care benefits was assumed for 2018; the rate was assumed to decrease gradually to 4.0% for 2058 and remain at that level thereafter. Assumed health care cost trend rates have a significant effect on the amounts reported. An increase in the assumed health care cost trend rates by one percentage point would have increased the accumulated postretirement benefit obligation as of September 30, 2017 by $718 and the aggregate of the service and interest cost components of net periodic postretirement benefit cost for the year then ended by $47. A decrease in the assumed health care cost trend rates by one percentage point would have decreased the accumulated postretirement benefit obligation as of September 30, 2017 by $822 and the aggregate of the service and interest cost components of net periodic postretirement benefit cost for the year then ended by $54.
Prior to its acquisition by Matthews, Schawk, Inc. ("Schawk") participated in a multi-employer pension fund pursuant to certain collective bargaining agreements. In 2012, Schawk bargained to withdraw from the fund, and recorded a withdrawal liability at the conclusion of the negotiations, based on the present value of the installment payments expected to be paid through 2034. During fiscal 2015, the Company finalized an agreement to settle this installment payment obligation in exchange for a lump-sum payment of $18,157, which is presented within cash flows from financing activities on the Consolidated Statement of Cash Flows. This settlement also resulted in an $11,522 gain recognized in other income (deductions), net during fiscal 2015.
The Company sponsors defined contribution plans for hourly and salary employees. The expense associated with the contributions made to these plans was $8,620, $8,117, and $6,819 for the fiscal years ended September 30, 2017, 2016 and 2015, respectively.
NOTES TO CONSOLIDATED FINANCIAL STATEMENTS (continued)
(Dollar amounts in thousands, except per share data)
13. ACCUMULATED OTHER COMPREHENSIVE INCOME:
The changes in AOCI by component, net of tax, for the years ended September 30, 2017, 2016 and 2015 were as follows:
|
| | | | | | | | | | | | | | | | |
| | Postretirement Benefit Plans | | Currency Translation Adjustment | | Derivatives | | Total |
Attributable to Matthews: | | | | | | | | |
Balance, September 30, 2014 | | $ | (39,651 | ) | | $ | (27,367 | ) | | $ | 201 |
| | $ | (66,817 | ) |
OCI before reclassification | | (7,378 | ) | | (77,237 | ) | | (4,841 | ) | | (89,456 | ) |
Amounts reclassified from AOCI | (a) | 3,555 |
| | — |
| (b) | 2,392 |
| | 5,947 |
|
Net current-period OCI | | (3,823 | ) | | (77,237 | ) | | (2,449 | ) | | (83,509 | ) |
Balance, September 30, 2015 | | $ | (43,474 | ) | | $ | (104,604 | ) | | $ | (2,248 | ) | | $ | (150,326 | ) |
OCI before reclassification | | (16,901 | ) | | (17,655 | ) | | (3,230 | ) | | (37,786 | ) |
Amounts reclassified from AOCI | (a) | 4,325 |
| | — |
| (b) | 1,919 |
| | 6,244 |
|
Net current-period OCI | | (12,576 | ) | | (17,655 | ) | | (1,311 | ) | | (31,542 | ) |
Balance, September 30, 2016 | | $ | (56,050 | ) | | $ | (122,259 | ) | | $ | (3,559 | ) | | $ | (181,868 | ) |
OCI before reclassification | | 6,536 |
| | 9,352 |
| | 7,043 |
| | 22,931 |
|
Amounts reclassified from AOCI | (a) | 5,891 |
| | — |
| (b) | (1,069 | ) | | 4,822 |
|
Net current-period OCI | | 12,427 |
| | 9,352 |
| | 5,974 |
| | 27,753 |
|
Balance, September 30, 2017 | | $ | (43,623 | ) | | $ | (112,907 | ) | | $ | 2,415 |
| | $ | (154,115 | ) |
| | | | | | | | |
Attributable to noncontrolling interest: | | |
| | |
| | |
| | |
|
Balance, September 30, 2014 | | $ | — |
| | $ | 516 |
| | $ | — |
| | $ | 516 |
|
OCI before reclassification | | — |
| | (150 | ) | | — |
| | (150 | ) |
Net current-period OCI | | — |
| | (150 | ) | | — |
| | (150 | ) |
Balance, September 30, 2015 | | $ | — |
| | $ | 366 |
| | $ | — |
| | $ | 366 |
|
OCI before reclassification | | — |
| | (89 | ) | | — |
| | (89 | ) |
Net current-period OCI | | — |
| | (89 | ) | | — |
| | (89 | ) |
Balance, September 30, 2016 | | $ | — |
| | $ | 277 |
| | $ | — |
| | $ | 277 |
|
OCI before reclassification | | — |
| | 119 |
| | — |
| | 119 |
|
Net current-period OCI | | — |
| | 119 |
| | — |
| | 119 |
|
Balance, September 30, 2017 | | $ | — |
| | $ | 396 |
| | $ | — |
| | $ | 396 |
|
| |
(a) | Amounts were included in net periodic benefit cost for pension and other postretirement benefit plans (see Note 12). |
| |
(b) | Amounts were included in interest expense in the periods the hedged item affected earnings (see Note 8). |
Accumulated other comprehensive loss at September 30, 2017 and 2016 consisted of the following:
|
| | | | | | | |
| 2017 | | 2016 |
Cumulative foreign currency translation | $ | (112,907 | ) | | $ | (122,259 | ) |
Fair value of derivatives, net of tax of $1,544 and $2,275, respectively | 2,415 |
| | (3,559 | ) |
Minimum pension liabilities, net of tax of $27,114 and $35,426, respectively | (43,623 | ) | | (56,050 | ) |
| $ | (154,115 | ) | | $ | (181,868 | ) |
NOTES TO CONSOLIDATED FINANCIAL STATEMENTS (continued)
(Dollar amounts in thousands, except per share data)
13. ACCUMULATED OTHER COMPREHENSIVE INCOME, (continued)
Reclassifications out of AOCI for the years ended September 30, 2017, 2016 and 2015 were as follows:
|
| | | | | | | | | | | | | | |
Details about AOCI Components | | September 30, 2017 | | September 30, 2016 | | September 30, 2015 | | Affected line item in the Statement of Income |
Postretirement benefit plans | | | | | | | | |
Prior service (cost) credit | (a) | $ | 376 |
| | $ | 378 |
| | $ | 375 |
| | |
Actuarial losses | (a) | (10,034 | ) | | (7,468 | ) | | (6,203 | ) | | |
| (b) | (9,658 | ) | | (7,090 | ) | | (5,828 | ) | | Income before income tax |
| | (3,767 | ) | | (2,765 | ) | | (2,273 | ) | | Income taxes |
| | $ | (5,891 | ) | | $ | (4,325 | ) | | $ | (3,555 | ) | | Net income |
Derivatives | | |
| | |
| | |
| | |
Interest rate swap contracts | | $ | 1,752 |
| | $ | (3,146 | ) | | $ | (3,922 | ) | | Interest expense |
| (b) | 1,752 |
| | (3,146 | ) | | (3,922 | ) | | Income before income tax |
| | 683 |
| | (1,227 | ) | | (1,530 | ) | | Income taxes |
| | $ | 1,069 |
| | $ | (1,919 | ) | | $ | (2,392 | ) | | Net income |
| |
(a) | Amounts are included in the computation of pension and other postretirement benefit expense, which is reported in both cost of goods sold and selling and administrative expenses. For additional information, see Note 12. |
(b)For pre-tax items, positive amounts represent income and negative amounts represent expense.
14. INCOME TAXES:
The provision for income taxes consisted of the following:
|
| | | | | | | | | | | |
| 2017 | | 2016 | | 2015 |
Current: | | | | | |
Federal | $ | 1,542 |
| | $ | 18,733 |
| | $ | 655 |
|
State | 628 |
| | 1,829 |
| | 1,466 |
|
Foreign | 10,459 |
| | 12,482 |
| | 10,599 |
|
| 12,629 |
| | 33,044 |
| | 12,720 |
|
Deferred: | | | | | |
Federal | 11,887 |
| | (3,066 | ) | | 13,279 |
|
State | 905 |
| | (2,412 | ) | | 645 |
|
Foreign | (3,067 | ) | | 1,507 |
| | (280 | ) |
| 9,725 |
| | (3,971 | ) | | 13,644 |
|
Total | $ | 22,354 |
| | $ | 29,073 |
| | $ | 26,364 |
|
During 2017, the Company adopted ASU 2016-09 and recorded current year tax benefits related to share-based payments as a component of income tax expense (See Note 3, Accounting Pronouncements). The tax benefits related to share-based payments recorded as a component of income tax expense for the year ended September 30, 2017 were $1,234. The tax benefits related to share-based payments recorded directly to additional paid-in capital for the years ended September 30, 2016, and 2015 were $1,720, and $418, respectively.
NOTES TO CONSOLIDATED FINANCIAL STATEMENTS (continued)
(Dollar amounts in thousands, except per share data)
14. INCOME TAXES, (continued)
The reconciliation of the federal statutory tax rate to the consolidated effective tax rate was as follows:
|
| | | | | | | | |
| 2017 | | 2016 | | 2015 |
Federal statutory tax rate | 35.0 | % | | 35.0 | % | | 35.0 | % |
Effect of state income taxes, net of federal deduction | 1.4 | % | | (0.6 | )% | | 1.8 | % |
Foreign taxes less than federal statutory rate | (7.2 | )% | | (3.5 | )% | | (3.2 | )% |
Share-based compensation | (1.2 | )% | | — | % | | — | % |
Other | (4.8 | )% | | (0.4 | )% | | (4.2 | )% |
Effective tax rate | 23.2 | % | | 30.5 | % | | 29.4 | % |
The Company's effective tax rate for fiscal 2017 was 23.2%, compared to 30.5% for fiscal 2016. Fiscal 2017 reflects the benefits from lower foreign taxes, organizational structure changes, primarily initiated in connection with acquisition integration, increased benefits from credits and incentives, and the impact of other tax benefits specific to the current year. The difference between the Company's effective tax rate and the Federal statutory rate of 35.0% primarily reflected lower foreign income taxes and the benefit of credits and incentives, offset by the impact of state taxes.
The Company's foreign subsidiaries had income before income taxes for the years ended September 30, 2017, 2016 and 2015 of approximately $24,118, $48,864 and $40,024, respectively. Deferred income taxes for U.S. tax purposes have not been provided on certain undistributed earnings of foreign subsidiaries, as such earnings are considered to be reinvested indefinitely. At September 30, 2017, undistributed earnings of foreign subsidiaries for which deferred U.S. income taxes have not been provided approximated $596,281. The Company has not determined the deferred tax liability associated with these undistributed earnings, as such determination is not practicable due to the complexity of the hypothetical calculation.
The components of deferred tax assets and liabilities at September 30, 2017 and 2016 are as follows:
|
| | | | | | | |
| 2017 | | 2016 |
Deferred tax assets: | | | |
Pension and postretirement benefits | $ | 45,654 |
| | $ | 46,282 |
|
Accruals and reserves not currently deductible | 20,579 |
| | 26,214 |
|
Income tax credit carryforward | 3,313 |
| | 10,080 |
|
Operating and capital loss carryforwards | 23,610 |
| | 25,258 |
|
Stock options | 8,614 |
| | 6,544 |
|
Other | 2,782 |
| | 5,246 |
|
Total deferred tax assets | 104,552 |
| | 119,624 |
|
Valuation allowances | (20,866 | ) | | (22,412 | ) |
Net deferred tax assets | 83,686 |
| | 97,212 |
|
| | | |
Deferred tax liabilities: | |
| | |
|
Depreciation | (4,763 | ) | | (5,207 | ) |
Unrealized gains and losses | (10,446 | ) | | (5,640 | ) |
Goodwill and intangible assets | (203,957 | ) | | (190,541 | ) |
Other | (1,494 | ) | | (2,087 | ) |
| (220,660 | ) | | (203,475 | ) |
| | | |
Net deferred tax liability | $ | (136,974 | ) | | $ | (106,263 | ) |
NOTES TO CONSOLIDATED FINANCIAL STATEMENTS (continued)
(Dollar amounts in thousands, except per share data)
14. INCOME TAXES, (continued)
At September 30, 2017, the Company had foreign net operating loss carryforwards of $84,175 and foreign capital loss carryforwards of $20,930. The Company has recorded deferred tax assets of $2,232 for state net operating loss carryforwards, and various non-U.S. income tax credit carryforwards of $3,080 which will be available to offset future income tax liabilities. If not used, state net operating losses will begin to expire in 2018. Certain of the foreign net operating losses begin to expire in 2018 while the majority of the Company's foreign net operating losses have no expiration period. Certain of these carryforwards are subject to limitations on use due to tax rules affecting acquired tax attributes, loss sharing between group members, and business continuation. Therefore, the Company has established tax-effected valuation allowances against these tax benefits in the amount of $20,866 at September 30, 2017.
Changes in the total amount of gross unrecognized tax benefits (excluding penalties and interest) are as follows:
|
| | | | | | | | | | | |
| 2017 | | 2016 | | 2015 |
Balance, beginning of year | $ | 13,820 |
| | $ | 4,086 |
| | $ | 4,311 |
|
Increase from acquisition | — |
| | — |
| | — |
|
Increases for tax positions of prior years | 839 |
| | 5,762 |
| | 475 |
|
Decreases for tax positions of prior years | (5,890 | ) | | (166 | ) | | (155 | ) |
Increases based on tax positions related to the current year | 378 |
| | 5,456 |
| | 635 |
|
Decreases due to settlements with taxing authorities | — |
| | — |
| | (27 | ) |
Decreases due to lapse of statute of limitation | (1,179 | ) | | (1,318 | ) | | (1,153 | ) |
Balance, end of year | $ | 7,968 |
| | $ | 13,820 |
| | $ | 4,086 |
|
The Company had unrecognized tax benefits of $7,968 at September 30, 2017, which would impact the annual effective tax rate. It is reasonably possible that the amount of unrecognized tax benefits could decrease by approximately $3,587 in the next 12 months primarily due to the expiration of statutes of limitation related to specific tax positions.
The Company classifies interest and penalties on tax uncertainties as a component of the provision for income taxes. Total penalties and interest accrued were $1,779 and $2,088 at September 30, 2017 and 2016, respectively. These accruals may potentially be applicable in the event of an unfavorable outcome of uncertain tax positions.
The Company is currently under examination in several tax jurisdictions and remains subject to examination until the statute of limitation expires for those tax jurisdictions.
As of September 30, 2017, the tax years that remain subject to examination by major jurisdiction generally are:
|
| |
United States - Federal | 2013 and forward |
United States - State | 2013 and forward |
Canada | 2013 and forward |
Germany | 2009 and forward |
United Kingdom | 2015 and forward |
Australia | 2013 and forward |
Singapore | 2012 and forward |
NOTES TO CONSOLIDATED FINANCIAL STATEMENTS (continued)
(Dollar amounts in thousands, except per share data)
15. COMMITMENTS AND CONTINGENT LIABILITIES:
The Company operates various production, warehouse and office facilities and equipment under operating lease agreements. Annual rentals under these and other operating leases were $36,400, $32,716 and $31,766 in fiscal 2017, 2016 and 2015, respectively. Future minimum rental commitments under non-cancelable operating lease arrangements for fiscal years 2018 through 2022 are $21,939, $15,562, $11,992, $8,559 and $5,276, respectively.
The Company is party to various legal proceedings, the eventual outcome of which are not predictable. Although the ultimate disposition of these proceedings is not presently determinable, management is of the opinion that they should not result in liabilities in an amount which would materially affect the Company's consolidated financial position, results of operations or cash flows.
The Company has employment agreements with certain employees, the terms of which expire at various dates between fiscal 2017 and 2019. The agreements generally provide for base salary and bonus levels and include non-compete provisions. The aggregate commitment for salaries under these agreements at September 30, 2017 was $5,652.
The Company is involved in a dispute with a customer related to a project in Saudi Arabia. It is possible the resolution of this matter could have an unfavorable financial impact on Matthews’ results of operations. See further discussion in Note 8.
16. ENVIRONMENTAL MATTERS:
The Company's operations are subject to various federal, state and local laws and regulations relating to the protection of the environment. These laws and regulations impose limitations on the discharge of materials into the environment and require the Company to obtain and operate in compliance with conditions of permits and other government authorizations. As such, the Company has developed environmental, health and safety policies and procedures that include the proper handling, storage and disposal of hazardous materials.
The Company is party to various environmental matters. These include obligations to investigate and mitigate the effects on the environment of the disposal of certain materials at various operating and non-operating sites. The Company is currently performing environmental assessments and remediation at these sites, as appropriate.
At September 30, 2017, an accrual of $2,928 had been recorded for environmental remediation (of which $750 was classified in other current liabilities), representing management's best estimate of the probable and reasonably estimable costs of known remediation obligations for one of the Company's subsidiaries. The accrual does not consider the effects of inflation and anticipated expenditures are not discounted to their present value. While final resolution of these contingencies could result in costs different than current accruals, management believes the ultimate outcome will not have a significant effect on the Company's consolidated results of operations or financial position.
NOTES TO CONSOLIDATED FINANCIAL STATEMENTS (continued)
(Dollar amounts in thousands, except per share data)
17. SUPPLEMENTAL CASH FLOW INFORMATION:
Changes in working capital items as presented in the Consolidated Statements of Cash Flows consisted of the following:
|
| | | | | | | | | | | |
| 2017 | | 2016 | | 2015 |
Current assets: | | | | | |
Accounts receivable | $ | (7,045 | ) | | $ | (10,632 | ) | | $ | 7,566 |
|
Inventories | (2,289 | ) | | 10,453 |
| | 17,001 |
|
Other current assets | 4,447 |
| | 12,434 |
| | (14,567 | ) |
| (4,887 | ) | | 12,255 |
| | 10,000 |
|
Current liabilities: | |
| | |
| | |
|
Trade accounts payable | 5,672 |
| | (11,083 | ) | | (9,103 | ) |
Accrued compensation | (2,469 | ) | | 147 |
| | (183 | ) |
Accrued income taxes | 5,054 |
| | 4,079 |
| | 3,389 |
|
Other current liabilities | 2,414 |
| | 8,317 |
| | (6,854 | ) |
| 10,671 |
| | 1,460 |
| | (12,751 | ) |
Net change | $ | 5,784 |
| | $ | 13,715 |
| | $ | (2,751 | ) |
18. SEGMENT INFORMATION:
The Company manages its businesses under three segments: SGK Brand Solutions, Memorialization and Industrial Technologies. The SGK Brand Solutions segment includes brand development, deployment and delivery (consisting of brand management, printing plates and cylinders, pre-media services and imaging services for consumer packaged goods and retail customers, merchandising display systems, and marketing and design services). The Memorialization segment consists primarily of bronze and granite memorials and other memorialization products, caskets and cremation equipment primarily for the cemetery and funeral home industries. The Industrial Technologies segment includes marking and coding equipment and consumables, industrial automation products and order fulfillment systems for identifying, tracking, picking and conveying consumer and industrial products. Management evaluates segment performance based on operating profit (before income taxes) and does not allocate non-operating items such as investment income, interest expense, other income (deductions), net and noncontrolling interest amongst the segments.
The accounting policies of the segments are the same as those described in Summary of Significant Accounting Policies (Note 2). Intersegment sales are accounted for at negotiated prices. Operating profit is total revenue less operating expenses. Segment assets include those assets that are used in the Company's operations within each segment. Assets classified under "Other" principally consist of cash and cash equivalents, investments, deferred income taxes and corporate headquarters' assets. Long-lived assets include property, plant and equipment (net of accumulated depreciation), goodwill, and other intangible assets (net of accumulated amortization).
NOTES TO CONSOLIDATED FINANCIAL STATEMENTS (continued)
(Dollar amounts in thousands, except per share data)
18. SEGMENT INFORMATION, (continued)
Information about the Company's segments follows:
|
| | | | | | | | | | | | | | | | | | | |
| SGK Brand Solutions | | Memorialization | | Industrial Technologies | | Other | | Consolidated |
Sales to external customers: |
2017 | $ | 770,181 |
| | $ | 615,882 |
| | $ | 129,545 |
| | $ | — |
| | $ | 1,515,608 |
|
2016 | 755,975 |
| | 610,142 |
| | 114,347 |
| | — |
| | 1,480,464 |
|
2015 | 798,339 |
| | 508,058 |
| | 119,671 |
| | — |
| | 1,426,068 |
|
Intersegment sales: |
2017 | 356 |
| | — |
| | 2 |
| | — |
| | 358 |
|
2016 | 346 |
| | 43 |
| | 99 |
| | — |
| | 488 |
|
2015 | 478 |
| | 77 |
| | 25 |
| | — |
| | 580 |
|
Depreciation and amortization: |
2017 | 41,941 |
| | 19,808 |
| | 2,863 |
| | 3,369 |
| | 67,981 |
|
2016 | 41,238 |
| | 19,223 |
| | 2,503 |
| | 2,516 |
| | 65,480 |
|
2015 | 46,594 |
| | 12,410 |
| | 2,294 |
| | 1,322 |
| | 62,620 |
|
Operating profit: |
2017 | 24,919 |
| | 80,652 |
| | 7,032 |
| | — |
| | 112,603 |
|
2016 | 42,909 |
| | 68,252 |
| | 7,654 |
| | — |
| | 118,815 |
|
2015 | 21,864 |
| | 70,064 |
| | 13,095 |
| | — |
| | 105,023 |
|
Total assets: |
2017 | 1,276,295 |
| | 741,148 |
| | 161,472 |
| | 65,734 |
| | 2,244,649 |
|
2016 | 1,177,816 |
| | 735,985 |
| | 122,179 |
| | 55,061 |
| | 2,091,041 |
|
2015 | 1,157,771 |
| | 762,028 |
| | 115,664 |
| | 108,148 |
| | 2,143,611 |
|
Capital expenditures: |
2017 | 22,941 |
| | 8,078 |
| | 4,622 |
| | 9,294 |
| | 44,935 |
|
2016 | 22,043 |
| | 11,870 |
| | 3,461 |
| | 4,308 |
| | 41,682 |
|
2015 | 23,676 |
| | 10,922 |
| | 5,866 |
| | 7,787 |
| | 48,251 |
|
Information about the Company's operations by geographic area follows:
|
| | | | | | | | | | | | | | | | | | | | | | | | | | | |
| United States | | Central and South America | | Canada | | Europe | | Australia | | Asia | | Consolidated |
Sales to external customers: | | | | | | | | | | | | |
2017 | $ | 1,014,906 |
| | $ | 6,518 |
| | $ | 29,018 |
| | $ | 396,242 |
| | $ | 21,507 |
| | $ | 47,417 |
| | $ | 1,515,608 |
|
2016 | 1,018,129 |
| | 10,160 |
| | 27,589 |
| | 360,678 |
| | 20,043 |
| | 43,865 |
| | 1,480,464 |
|
2015 | 936,513 |
| | 8,806 |
| | 30,367 |
| | 398,533 |
| | 21,225 |
| | 30,624 |
| | 1,426,068 |
|
| | | | | | | | | | | | | |
Long-lived assets: | | |
| | |
| | |
| | |
| | |
| | |
|
2017 | 1,027,891 |
| | 13,882 |
| | 41,971 |
| | 382,940 |
| | 24,887 |
| | 66,138 |
| | 1,557,709 |
|
2016 | 1,000,870 |
| | 13,267 |
| | 41,393 |
| | 334,847 |
| | 23,768 |
| | 50,677 |
| | 1,464,822 |
|
2015 | 1,016,703 |
| | 17,488 |
| | 41,690 |
| | 349,533 |
| | 22,072 |
| | 50,650 |
| | 1,498,136 |
|
NOTES TO CONSOLIDATED FINANCIAL STATEMENTS (continued)
(Dollar amounts in thousands, except per share data)
19. ACQUISITIONS:
Fiscal 2017:
On March 1, 2017, the Company acquired GJ Creative Limited ("Equator") for £30.5 million ($37,596) (net of cash acquired). Equator provides design expertise capable of taking brands from creation to shelf under one roof, and is included in the Company's SGK Brand Solutions segment. The preliminary purchase price allocation related to the Equator acquisition is not finalized as of September 30, 2017, and is subject to changes as the Company obtains additional information related to fixed assets, intangible assets, and other assets and liabilities.
On February 28, 2017, the Company acquired certain net assets of RAF Technology, Inc. ("RAF") for $8,717 (net of cash acquired). RAF is a global leader in pattern and optical character recognition software, and is included in the Company's Industrial Technologies segment. The Company finalized the allocation of purchase price related to the RAF acquisition in the fourth quarter of fiscal 2017, resulting in an immaterial adjustment to certain working capital accounts.
On January 13, 2017, the Company acquired VCG (Holdings) Limited ("VCG") for £8.8 million ($10,695) (net of cash acquired). VCG is a leading graphics, plate-making, and creative design company and is included in the Company's SGK Brand Solutions segment. The preliminary purchase price allocation related to the VCG acquisition is not finalized as of September 30, 2017, and is subject to change as the Company obtains additional information related to fixed assets, intangible assets, and other assets and liabilities.
On January 3, 2017, the Company acquired A. + E. Ungricht GmbH + Co KG ("Ungricht") for €24.0 million ($25,185) (net of cash acquired). Ungricht is a leading European provider of pre-press services and gravure printing forms, located in Germany, and is included in the Company's SGK Brand Solutions segment. The preliminary purchase price allocation related to the Ungricht acquisition is not finalized as of September 30, 2017, and is subject to change as the Company obtains additional information related to fixed assets, intangible assets, and other assets and liabilities.
On November 30, 2016, the Company acquired Guidance Automation Limited ("Guidance") for £8.0 million ($9,974) (net of cash acquired). Guidance provides technological solutions for autonomous warehouse vehicles and is included in the Company's Industrial Technologies segment. The Company finalized the allocation of purchase price related to the Guidance acquisition in the fourth quarter of fiscal 2017, resulting in an immaterial adjustment to certain working capital and intangible asset accounts.
Fiscal 2016:
On February 1, 2016, the Company acquired certain net assets of Digital Design, Inc. ("DDI") for $8,773 (net of cash acquired and holdback amount). DDI is a manufacturer and seller of ink jet printing systems and is included in the Company's Industrial Technologies segment. The Company finalized the allocation of purchase price related to the DDI acquisition during fiscal 2017, resulting in an immaterial adjustment to certain working capital accounts.
Fiscal 2015:
On August 19, 2015, the Company acquired Aurora Products Group, LLC ("Aurora") for $210,026 (net of cash acquired). Aurora provides burial, cremation, and technology products to funeral home clients and distributors in the United States and Canada. The acquisition was designed to expand the Company's memorialization product offerings and geographic distribution footprint in the United States. During fiscal 2016, the Company finalized the allocation of purchase price related to the Aurora acquisition, resulting in immaterial adjustments to property, plant and equipment, goodwill, certain working capital accounts and deferred taxes. The final allocation of the purchase price resulted in goodwill of $73,927, which was assigned to the Memorialization segment, $76,340 of intangible assets, of which $30,540 is not subject to amortization, $26,268 of property, plant and equipment, and $33,491 of other net assets, primarily working capital. Approximately $44,000 of the goodwill is expected to be deductible for tax purposes.
NOTES TO CONSOLIDATED FINANCIAL STATEMENTS (continued)
(Dollar amounts in thousands, except per share data)
20. GOODWILL AND OTHER INTANGIBLE ASSETS:
Changes to goodwill during the years ended September 30, 2017 and 2016, follow.
|
| | | | | | | | | | | | | | | |
| SGK Brand Solutions | | Memorialization | | Industrial Technologies | | Consolidated |
Goodwill | $ | 466,647 |
| | $ | 346,946 |
| | $ | 52,887 |
| | $ | 866,480 |
|
Accumulated impairment losses | (5,752 | ) | | (5,000 | ) | | — |
| | (10,752 | ) |
Balance at September 30, 2015 | 460,895 |
| | 341,946 |
| | 52,887 |
| | 855,728 |
|
| | | | | | | |
Additions during period | — |
| | — |
| | 3,958 |
| | 3,958 |
|
Translation and other adjustments | (8,137 | ) | | 170 |
| | (230 | ) | | (8,197 | ) |
Goodwill | 458,510 |
| | 347,116 |
| | 56,615 |
| | 862,241 |
|
Accumulated impairment losses | (5,752 | ) | | (5,000 | ) | | — |
| | (10,752 | ) |
Balance at September 30, 2016 | 452,758 |
| | 342,116 |
| | 56,615 |
| | 851,489 |
|
| | | | | | | |
Additions during period | 21,361 |
| | 158 |
| | 11,694 |
| | 33,213 |
|
Translation and other adjustments | 12,024 |
| | 233 |
| | 835 |
| | 13,092 |
|
Goodwill | 491,895 |
| | 347,507 |
| | 69,144 |
| | 908,546 |
|
Accumulated impairment losses | (5,752 | ) | | (5,000 | ) | | — |
| | (10,752 | ) |
Balance at September 30, 2017 | $ | 486,143 |
| | $ | 342,507 |
| | $ | 69,144 |
| | $ | 897,794 |
|
The Company performed its annual impairment review of goodwill in the second quarter of fiscal 2017 and determined that estimated fair value for all reporting units exceeded carrying value, therefore no adjustments to the carrying value of goodwill were necessary.
In fiscal 2017, the additions to SGK Brand Solutions goodwill primarily reflects the acquisitions of Equator, VCG and Ungricht. The additions to Industrial Technologies goodwill primarily reflects the acquisitions of RAF and Guidance.
In fiscal 2016, the addition to Industrial Technologies goodwill reflects the acquisition of DDI.
In fiscal 2015, the addition to Memorialization goodwill primarily reflects the acquisition of Aurora, and the addition to Industrial Technologies goodwill primarily reflects the acquisition of a small printing products business. The amount reflected in translation and other adjustments for the SGK Brand Solutions segment includes the impact of purchase price adjustments.
NOTES TO CONSOLIDATED FINANCIAL STATEMENTS (continued)
(Dollar amounts in thousands, except per share data)
20. GOODWILL AND OTHER INTANGIBLE ASSETS, (continued)
The following tables summarize the carrying amounts and related accumulated amortization for intangible assets as of September 30, 2017 and 2016, respectively.
|
| | | | | | | | | | | |
| Carrying Amount | | Accumulated Amortization | | Net |
September 30, 2017 | | | | | |
Trade names | $ | 168,467 |
| | $ | — |
| * | $ | 168,467 |
|
Trade names | 5,522 |
| | (2,030 | ) | | 3,492 |
|
Customer relationships | 333,632 |
| | (84,560 | ) | | 249,072 |
|
Copyrights/patents/other | 14,787 |
| | (11,436 | ) | | 3,351 |
|
| $ | 522,408 |
| | $ | (98,026 | ) | | $ | 424,382 |
|
| | | | | |
September 30, 2016 | |
| | |
| | |
|
Trade names | $ | 168,467 |
| | $ | — |
| * | $ | 168,467 |
|
Trade names | 1,814 |
| | (1,802 | ) | | 12 |
|
Customer relationships | 286,595 |
| | (61,706 | ) | | 224,889 |
|
Copyrights/patents/other | 11,066 |
| | (10,593 | ) | | 473 |
|
| $ | 467,942 |
| | $ | (74,101 | ) | | $ | 393,841 |
|
*Not subject to amortization | |
| | |
| | |
|
The net change in intangible assets during fiscal 2017 included the impact of foreign currency fluctuations during the period, additional amortization, and additions related to the Guidance, Ungricht, VCG, RAF and Equator acquisitions.
Amortization expense on intangible assets was $23,313, $20,821, and $18,800 in fiscal 2017, 2016 and 2015, respectively. Fiscal year amortization expense is estimated to be $24,187 in 2018, $22,731 in 2019, $21,281 in 2020, $20,237 in 2021 and $19,161 in 2022.
21. RELATED PARTY TRANSACTION:
In May 2016, the Company purchased 970,000 common shares from members of the Schawk family, including David A. Schawk (who is a member of the Board of Directors of the Company and the Company's President, SGK Brand Solutions) and certain family members of Mr. Schawk and/or trusts established for the benefit of Mr. Schawk or his family members. The purchase price for the shares purchase was $50.6921625 per share, which was equal to 96.76% of the average of the high and low trading prices for the common stock as reported on the Nasdaq Global Select Market on May 12, 2016.
22. LEGAL MATTER:
During fiscal 2017, the Company recognized loss recoveries of $11,325 related to the previously disclosed theft of funds by a former employee initially identified in fiscal 2015.
SUPPLEMENTARY FINANCIAL INFORMATION
Selected Quarterly Financial Data (Unaudited):
The following table sets forth certain items included in the Company's unaudited consolidated financial statements for each quarter of fiscal 2017 and fiscal 2016.
|
| | | | | | | | | | | | | | | | | | | |
| Quarter Ended | | |
| December 31 | | March 31 | | June 30 | | September 30 | | Year Ended September 30 |
| (Dollar amounts in thousands, except per share data) | | |
FISCAL YEAR 2017: | | | | | | | | | |
| | | | | | | | | |
Sales | $ | 348,998 |
| | $ | 380,916 |
| | $ | 389,630 |
| | $ | 396,064 |
| | $ | 1,515,608 |
|
| | | | | | | | | |
Gross profit | 127,267 |
| | 138,422 |
| | 144,094 |
| | 153,604 |
| | 563,387 |
|
| | | | | | | | | |
Operating profit | 19,063 |
| | 26,828 |
| | 36,786 |
| | 29,926 |
| | 112,603 |
|
| | | | | | | | | |
Net income attributable to Matthews shareholders | 10,322 |
| (1) | 14,920 |
| | 29,485 |
| | 19,641 |
| | 74,368 |
|
| | | | | | | | | |
Earnings per share: | |
| | |
| | |
| | |
| | |
|
Basic | $ | 0.32 |
| (1) | $ | 0.46 |
| | $ | 0.91 |
| | $ | 0.61 |
| | $ | 2.31 |
|
Diluted | 0.32 |
| (1) | 0.46 |
| | 0.91 |
| | 0.60 |
| | 2.28 |
|
| | | | | | | | | |
| | | | | | | | | |
FISCAL YEAR 2016: | |
| | |
| | |
| | |
| | |
|
| | | | | | | | | |
Sales | $ | 354,232 |
| | $ | 367,176 |
| | $ | 382,061 |
| | $ | 376,995 |
| | $ | 1,480,464 |
|
| | | | | | | | | |
Gross profit | 126,567 |
| | 137,760 |
| | 145,297 |
| | 146,830 |
| | 556,454 |
|
| | | | | | | | | |
Operating profit | 12,038 |
| | 26,435 |
| | 40,670 |
| | 39,672 |
| | 118,815 |
|
| | | | | | | | | |
Net income attributable to Matthews shareholders | 4,614 |
| | 14,357 |
| | 23,915 |
| | 23,863 |
| | 66,749 |
|
| | | | | | | | | |
Earnings per share: | |
| | |
| | |
| | |
| | |
|
Basic | $ | 0.14 |
| | $ | 0.44 |
| | $ | 0.73 |
| | $ | 0.74 |
| | $ | 2.04 |
|
Diluted | 0.14 |
| | 0.43 |
| | 0.73 |
| | 0.74 |
| | 2.03 |
|
| |
(1) | Results for the first quarter of fiscal 2017 have been revised to reflect the adoption of ASU 2016-09. The adoption of this ASU resulted in a reduction to income tax expense of $1,234 and a corresponding favorable impact on earnings per share of $0.04. |
FINANCIAL STATEMENT SCHEDULE
SCHEDULE II - VALUATION AND QUALIFYING ACCOUNTS
|
| | | | | | | | | | | | | | | | | | | |
| | | Additions | | | | |
Description | Balance at Beginning of Period | | Charged to Expense | | Charged to other Accounts(1) | | Deductions(2) | | Balance at End of Period |
| (Dollar amounts in thousands) | | |
Allowance for Doubtful Accounts: | | | | | | | | | |
Fiscal Year Ended: | | | | | | | | | |
September 30, 2017 | $ | 11,516 |
| | $ | 1,733 |
| | $ | 642 |
| | $ | (2,269 | ) | | $ | 11,622 |
|
September 30, 2016 | 10,015 |
| | 3,055 |
| | 435 |
| | (1,989 | ) | | 11,516 |
|
September 30, 2015 | 10,937 |
| | 2,101 |
| | (134 | ) | | (2,889 | ) | | 10,015 |
|
| |
(1) | Amount comprised principally of acquisitions and purchase accounting adjustments in connection with acquisitions, and amounts reclassified to other accounts. |
| |
(2) | Amounts determined not to be collectible (including direct write-offs), net of recoveries. |
|
| | | | | | | | | | | | | | | | | | | |
Description | Balance at Beginning of Period | | Provision Charged (Credited) To Expense(1) | | Allowance Changes(2) | | Other Deductions(3) | | Balance at End of Period |
| (Dollar amounts in thousands) | | |
Deferred Tax Asset Valuation Allowance: | | | | | | | | | |
Fiscal Year Ended: | | | | | | | | | |
September 30, 2017 | $ | 22,412 |
| | $ | (1,279 | ) | | $ | — |
| | $ | (267 | ) | | $ | 20,866 |
|
September 30, 2016 | 20,977 |
| | 2,438 |
| | — |
| | (1,003 | ) | | 22,412 |
|
September 30, 2015 | 24,540 |
| | 399 |
| | (1,705 | ) | | (2,257 | ) | | 20,977 |
|
| |
(1) | Amounts relate primarily to adjustments in net operating loss carryforwards which are precluded from use. |
| |
(2) | Fiscal 2015 amounts primarily reflect a release of a valuation allowance resulting from a fiscal 2015 legal structure reorganization in foreign jurisdictions that enabled the utilization of certain tax attributes. |
| |
(3) | Consists principally of adjustments related to foreign exchange. |
ITEM 9. CHANGES IN AND DISAGREEMENTS WITH ACCOUNTANTS ON ACCOUNTING AND FINANCIAL DISCLOSURE.
None.
ITEM 9A. CONTROLS AND PROCEDURES.
(a) Evaluation of Disclosure Controls and Procedures.
The Company's disclosure controls and procedures (as defined in Rules 13a-15(e) and 15d-15(e) under the Securities Exchange Act of 1934, as amended (the "Exchange Act")) are designed to provide reasonable assurance that information required to be disclosed in the Company's reports filed under the Exchange Act, such as this Annual Report on Form 10-K, are recorded, processed, summarized and reported within the time periods specified in the rules of the Securities and Exchange Commission ("SEC"). These disclosure controls and procedures also are designed to provide reasonable assurance that such information is accumulated and communicated to management, including the Chief Executive Officer and Chief Financial Officer, to allow timely decisions regarding required disclosures.
Management, under the supervision and with the participation of our Chief Executive Officer and Chief Financial Officer, evaluated the effectiveness of the Company's disclosure controls and procedures in effect as of September 30, 2017. Based on that evaluation, the Chief Executive Officer and Chief Financial Officer concluded that, as of September 30, 2017, the Company's disclosure controls and procedures were effective to provide reasonable assurance that material information is accumulated and communicated to management, including the Chief Executive Officer and Chief Financial Officer, and that such information is recorded, processed, summarized and properly reported within the appropriate time period, relating to the Company and its consolidated subsidiaries, required to be included in the Exchange Act reports, including this Annual Report on Form 10-K.
The Company is in the process of implementing a global operating and financial reporting information technology system, SAP, as part of a multi-year plan to integrate and upgrade its systems and processes. As the phased implementation of this system occurs, certain changes will be made to the Company's processes and procedures which, in turn, result in changes to its internal control over financial reporting. While the Company expects to strengthen its internal financial controls by automating certain manual processes and standardizing business processes and reporting across its global organization, management will continue to evaluate and monitor its internal controls as processes and procedures in each of the affected areas evolve.
(b) Management's Report on Internal Control over Financial Reporting.
Management's Report on Internal Control over Financial Reporting is included in Management's Report to Shareholders in Item 8 of this Annual Report on Form 10-K.
(c) Report of Independent Registered Public Accounting Firm.
The Company's internal control over financial reporting as of September 30, 2017 has been audited by Ernst & Young LLP, an independent registered public accounting firm, as stated in their report which is included in Item 8 of this Annual Report on Form 10-K.
(d) Changes in Internal Control over Financial Reporting.
Other than changes with respect to the SAP implementation described above, there have been no changes in the Company's internal controls over financial reporting that occurred during the fourth fiscal quarter ended September 30, 2017 that have materially affected, or are reasonably likely to materially affect, the Company's internal controls over financial reporting.
ITEM 9B. OTHER INFORMATION.
None.
ITEM 10. DIRECTORS, EXECUTIVE OFFICERS AND CORPORATE GOVERNANCE.
In addition to the information reported in Part I of this Annual Report on Form 10-K, under the caption "Officers and Executive Management of the Registrant," the information required by this item as to the directors of the Company is hereby incorporated by reference from the information appearing under the captions "General Information Regarding Corporate Governance – Audit Committee," "Proposal No. 1 – Elections of Directors" and "Compliance with Section 16(a) of the Exchange Act" in the Company's definitive proxy statement, which involves the election of the directors and is to be filed with the Securities and Exchange Commission (the "SEC") pursuant to the Exchange Act, within 120 days of the end of the Company's fiscal year ended September 30, 2017.
The Company's Code of Ethics Applicable to Executive Management is set forth in Exhibit 14.1 hereto. Any amendment to the Company's Code of Ethics or waiver of the Company's Code of Ethics for senior financial officers, executive officers or directors will be posted on the Company's website within four business days following the date of the amendment or waiver, and such information will remain available on the website for at least a twelve-month period.
ITEM 11. EXECUTIVE COMPENSATION.
The information required by this item as to the compensation of directors and executive management of the Company is hereby incorporated by reference from the information appearing under the captions "Compensation of Directors" and "Executive Compensation and Retirement Benefits" in the Company's definitive proxy statement which involves the election of directors and is to be filed with the SEC pursuant to the Exchange Act, within 120 days of the end of the Company's fiscal year ended September 30, 2017. The information contained in the "Compensation Committee Report" is specifically not incorporated herein by reference.
ITEM 12. SECURITY OWNERSHIP OF CERTAIN BENEFICIAL OWNERS AND MANAGEMENT.
The information required by this item as to the ownership by management and others of securities of the Company is hereby incorporated by reference from the information appearing under the caption "Stock Ownership" in the Company's definitive proxy statement, which involves the election of directors and is to be filed with the SEC pursuant to the Exchange Act, within 120 days of the end of the Company's fiscal year ended September 30, 2017.
Equity Compensation Plans:
The Company maintains an equity incentive plan (the "2012 Equity Incentive Plan") that provides for grants of stock options, restricted shares, stock-based performance units and certain other types of stock-based awards. The Company also maintains an equity incentive plan (the "2007 Equity Incentive Plan") and a stock incentive plan (the "1992 Incentive Stock Plan") that previously provided for grants of stock options, restricted shares and certain other types of stock-based awards. Under the 2012 Equity Incentive Plan, which has a ten years term, the maximum number of shares available for grants or awards is an aggregate of 2,500,000. There will be no further grants under the 2007 Equity Incentive Plan or the 1992 Incentive Stock Plan. At September 30, 2017, there were 589,238 shares reserved for future issuance under the 2012 Equity Incentive Plan. All plans are administered by the Compensation Committee of the Board of Directors.
ITEM 12. SECURITY OWNERSHIP OF CERTAIN BENEFICIAL OWNERS AND MANAGEMENT, continued
The option price for each stock option granted under any of the plans may not be less than the fair market value of the Company's Class A Common Stock on the date of grant. As of September 30, 2017, there were no stock options outstanding.
With respect to outstanding restricted share grants, for grants made prior to fiscal 2013, generally one-half of the shares vest on the third anniversary of the grant, with the remaining one-half of the shares vesting in one-third increments upon attainment of pre-defined levels of appreciation in the market value of the Company's Class A Common Stock. For grants made in and after fiscal 2013, generally one-half of the shares vest on the third anniversary of the grant, one-quarter of the shares vest in one-third increments upon the attainment of pre-defined levels of adjusted earnings per share, and the remaining one-quarter of the shares vest in one-third increments upon attainment of pre-defined levels of appreciation in the market value of the Company's Class A Common Stock. Additionally, restricted shares cannot vest until the first anniversary of the grant date. For grants made in July 2014, generally one-half of the shares vest on the third anniversary of the grant, with the remaining one-half of the shares vesting in one-third increments upon the attainment of pre-defined levels of adjusted EBITDA. Unvested restricted shares generally expire on the earlier of five years from the date of grant, upon employment termination, or within specified time limits following voluntary employment termination (with the consent of the Company), retirement or death. The Company issues restricted shares from treasury shares.
The Company maintains the 1994 Director Fee Plan and the Amended and Restated 2014 Director Fee Plan (collectively, the "Director Fee Plans"). There will be no further fees or share-based awards granted under the 1994 Director Fee Plan. Under the Amended and Restated 2014 Director Fee Plan, non-employee directors (except for the Chairman of the Board) each receive, as an annual retainer fee for fiscal 2017, either cash or shares of the Company's Class A Common Stock with a value equal to $75,000. The annual retainer fee for fiscal 2017 paid to a non-employee Chairman of the Board is $175,000. Where the annual retainer fee is provided in shares, each director may elect to be paid these shares on a current basis or have such shares credited to a deferred stock account as phantom stock, with such shares to be paid to the director subsequent to leaving the Board. The value of deferred shares is recorded in other liabilities. A total of 16,139 shares had been deferred under the Director Fee Plans at September 30, 2017. Additionally, non-employee directors each receive an annual stock-based grant (non-statutory stock options, stock appreciation rights and/or restricted shares) with a value of $125,000 for fiscal year 2017. A total of 22,300 stock options have been granted under the Director Fee Plans. At September 30, 2017, there were no options outstanding. Additionally, 161,724 shares of restricted stock have been granted under the Director Fee Plans, 58,574 of which were issued under the Amended and Restated 2014 Director Fee Plan. 25,157 shares of restricted stock are unvested at September 30, 2017. A total of 150,000 shares have been authorized to be issued under the Amended and Restated 2014 Director Fee Plan.
ITEM 12. SECURITY OWNERSHIP OF CERTAIN BENEFICIAL OWNERS AND MANAGEMENT, continued
The following table provides information about grants under the Company's equity compensation plans as of September 30, 2017:
|
| | | | | | | | | | |
| Equity Compensation Plan Information | | | |
Plan category | Number of securities to be issued upon exercise of outstanding options, warrants and rights | | Weighted-average exercise price of outstanding options, warrants and rights | | Number of securities remaining available for future issuance under equity compensation plans (excluding securities reflected in column (a)) | |
| (a) | | (b) | | (c) | |
Equity compensation plans | | | | | | |
approved by security holders: | | | | | | |
1992 Stock Incentive Plan | — |
| | $ | — |
| | — |
| (1) |
2007 Equity Incentive Plan | — |
| | — |
| | — |
| (2) |
2012 Equity Incentive Plan | — |
| | — |
| | 589,238 |
| (3) |
Employee Stock Purchase Plan | — |
| | — |
| | 1,531,567 |
| (4) |
1994 Director Fee Plan | 10,105 |
| | — |
| | — |
| (5) |
Amended and Restated 2014 Director Fee Plan | 6,034 |
| | — |
| | 85,392 |
| (6) |
Equity compensation plans not approved by security holders | None |
| | None |
| | None |
| |
Total | 16,139 |
| | $ | — |
| | 2,206,197 |
| |
| |
(1) | As a result of the approval of the 2007 Equity Incentive Plan, no further grants or awards will be made under the 1992 Incentive Stock Plan. |
| |
(2) | As a result of the approval of the 2012 Equity Incentive Plan, no further grants or awards will be made under the 2007 Incentive Stock Plan. |
| |
(3) | The 2012 Equity Incentive Plan was approved in February 2013. The Plan provides for the grant or award of stock options, restricted shares, stock-based performance units and certain other types of stock based awards, with a maximum of 2,500,000 shares available for grants or awards. |
| |
(4) | Shares under the Employee Stock Purchase Plan (the "Plan") are purchased in the open market by employees at the fair market value of the Company's stock. The Company provides a matching contribution of 10% of such purchases subject to certain limitations under the Plan. As the Plan is an open market purchase plan, it does not have a dilutive effect. |
| |
(5) | As a result of the approval of the Amended and Restated 2014 Director Fee Plan, no further grants or awards will be made under the 1994 Director Fee Plan. |
| |
(6) | Shares of restricted stock may be issued under the Amended and Restated 2014 Director Fee Plan. The maximum number of shares authorized to be issued under this plan is 150,000 shares. |
ITEM 13. CERTAIN RELATIONSHIPS AND RELATED TRANSACTIONS.
The information required by this item as to certain relationships and transactions with management and other related parties of the Company is hereby incorporated by reference from the information appearing under the captions "Proposal No. 1 – Election of Directors" and "Certain Transactions" in the Company's definitive proxy statement, which involves the election of directors and is to be filed with the SEC pursuant to the Exchange Act, within 120 days of the end of the Company's fiscal year ended September 30, 2017.
ITEM 14. PRINCIPAL ACCOUNTING FEES AND SERVICES.
The information required by this item as to the fees billed and the services provided by the principal accounting firm of the Company is hereby incorporated by reference from the information appearing under the caption "Relationship with Independent Registered Public Accounting Firm" in the Company's definitive proxy statement, which involves the election of directors and is to be filed with the SEC pursuant to the Exchange Act within 120 days of the end of the Company's fiscal year ended September 30, 2017.
ITEM 15. EXHIBITS, FINANCIAL STATEMENT SCHEDULES, AND REPORTS ON FORM 8-K.
(a) 1. Financial Statements:
The following items are included in Part II, Item 8:
|
| |
| Pages |
Management's Report to Shareholders | |
| |
Report of Independent Registered Public Accounting Firm | |
| |
Report of Independent Registered Public Accounting Firm | |
| |
Report of Independent Registered Public Accounting Firm | |
| |
Consolidated Balance Sheets as of September 30, 2017 and 2016 | |
| |
Consolidated Statements of Income for the years ended September 30, 2017, 2016 and 2015 | |
| |
Consolidated Statements of Comprehensive Income for the years ended September 30, 2017, 2016 and 2015 | |
| |
Consolidated Statements of Shareholders' Equity for the years ended September 30, 2017, 2016 and 2015 | |
| |
Consolidated Statements of Cash Flows for the years ended September 30, 2017, 2016 and 2015 | |
| |
Notes to Consolidated Financial Statements | |
| |
Supplementary Financial Information (unaudited) | |
2. Financial Statement Schedules:
The following item is included in Part II, Item 8:
|
| |
| |
Schedule II - Valuation and Qualifying Accounts | |
3. Exhibits Filed:
MATTHEWS INTERNATIONAL CORPORATION AND SUBSIDIARIES
EXHIBITS INDEX
The following Exhibits to this report are filed herewith or, if marked with an asterisk (*), are incorporated by reference. Exhibits marked with an "a" represent a management contract or compensatory plan, contract or arrangement required to be filed by Item 601(b)(10)(iii) of Regulation S-K.
|
| | | | |
Exhibit No. | | Description | | Prior Filing or Sequential Page Numbers Herein |
| | | | |
2.1 | | Purchase Agreement, dated June 8, 2015, by and among Matthews International Corporation, a Pennsylvania corporation, The York Group, Inc., a Delaware corporation, Aurora Products Group, LLC, each of the persons listed on Annex A thereto, and Kohlberg management VII, L.P., in its capacity as the seller's representative* | | Exhibit Number 2.1 to the Current Report on Form 8-K filed on June 11, 2015 |
| | | | |
3.1 | | Restated Articles of Incorporation* | | Exhibit Number 3.1 to the Annual Report on Form 10-K for the year ended September 30, 1994 |
| | | | |
3.2 | | | | Exhibit Number 3.1 to the Current Report on Form 8-K filed on July 26, 2017 |
| | | | |
4.1 a | | Form of Revised Option Agreement of Repurchase (effective October 1, 1993)* | | Exhibit Number 4.5 to the Annual Report on Form 10-K for the year ended September 30, 1993 |
| | | | |
4.2 | | Form of Share Certificate for Class A Common Stock* | | Exhibit Number 4.9 to the Annual Report on Form 10-K for the year ended September 30, 1994 |
| | | | |
10.1 | | | | Exhibit Number 10.1 to the Current Report on Form 8-K filed on April 28, 2016 |
| | | | |
10.2 | | | | Exhibit Number 10.2 to the Current Report on Form 8-K filed on March 19, 2014 |
| | | | |
10.3 a | | | | Exhibit A to the Definitive Proxy Statement on Schedule 14A filed on January 20, 2015 |
| | | | |
10.4 a | | | | Exhibit Number 10.1 to the Current Report on Form 8-K filed on May 16, 2016 |
| | | | |
| | | | |
| | | | |
| | | | |
| | | | |
| | | | |
| | | | |
| | | | |
| | | | |
| | | | |
| | | | |
MATTHEWS INTERNATIONAL CORPORATION AND SUBSIDIARIES
EXHIBITS INDEX, Continued
|
| | | | |
Exhibit No. | | Description | | Prior Filing or Sequential Page Numbers Herein |
| | | | |
10.5 a | | | | Exhibit Number 10.5 to the Annual Report on Form 10-K for the year ended September 30, 2010 |
| | | | |
10.6 a | | | | Exhibit Number 10.6 to the Annual Report on Form 10-K for the year ended September 30, 2009 |
| | | | |
10.7 a | | | | Exhibit Number 10.1 to the Quarterly Report on Form 10-Q for the quarter ended March 31, 2006 |
| | | | |
10.8 a | | | | Exhibit Number 10.7 to the Annual Report on Form 10-K for the year ended September 30, 2008 |
| | | | |
10.9 a | | | | Exhibit Number 10.8 to the Annual Report on Form 10-K for the year ended September 30, 2008 |
| | | | |
10.10 a | | | | Exhibit Number 10.7 to the Annual Report on Form 10-K for the year ended September 30, 2013 |
| | | | |
10.11 a | | | | Exhibit Number 10.1 to the Quarterly Report on Form 10-Q for the quarter ended March 31, 2017 |
| | | | |
10.12 a | | | | Exhibit Number 10.2 to the Quarterly Report on Form 10-Q for the quarter ended March 31, 1995 |
| | | | |
10.13 a | | | | Exhibit Number 10.11 to the Annual Report on Form 10-K for the year ended September 30, 2008 |
| | | | |
10.14 a | | | | Exhibit A to the Definitive Proxy Statement on Schedule 14A filed on January 22, 2013 |
| | | | |
10.15 a | | | | Exhibit A to the Definitive Proxy Statement on Schedule 14A filed on January 19, 2016 |
| | | | |
14.1 | | | | Exhibit Number 14.1 to the Annual Report on Form 10-K for the year ended September 30, 2004 |
| | | | |
21 | | | | Filed Herewith |
| | | | |
| | | | |
| | | | |
| | | | |
| | | | |
| | | | |
| | | | |
| | | | |
| | | | |
| | | | |
MATTHEWS INTERNATIONAL CORPORATION AND SUBSIDIARIES
EXHIBITS INDEX, Continued
|
| | | | |
Exhibit No. | | Description | | Prior Filing or Sequential Page Numbers Herein |
| | | | |
23.1 | | | | Filed Herewith |
| | | | |
23.2 | | | | Filed Herewith |
| | | | |
31.1 | | | | Filed Herewith |
| | | | |
31.2 | | | | Filed Herewith |
| | | | |
32.1 | | | | Furnished Herewith |
| | | | |
32.2 | | | | Furnished Herewith |
| | | | |
101.INS | | XBRL Instance Document | | Filed Herewith |
| | | | |
101.SCH | | XBRL Taxonomy Extension Schema | | Filed Herewith |
| | | | |
101.CAL | | XBRL Taxonomy Extension Calculation Linkbase | | Filed Herewith |
| | | | |
101.DEF | | XBRL Taxonomy Extension Definition Linkbase | | Filed Herewith |
| | | | |
101.LAB | | XBRL Taxonomy Extension Label Linkbase | | Filed Herewith |
| | | | |
101.PRE | | XBRL Taxonomy Extension Presentation Linkbase | | Filed Herewith |
Copies of any Exhibits will be furnished to shareholders upon written request. Requests should be directed to Mr. Steven F. Nicola, Chief Financial Officer and Secretary of the Registrant.
Pursuant to the requirements of Section 13 or 15(d) of the Securities Exchange Act of 1934, the Registrant has duly caused this report to be signed on its behalf by the undersigned, thereunto duly authorized, on November 21, 2017.
|
| | |
| | MATTHEWS INTERNATIONAL CORPORATION |
| | (Registrant) |
| | |
| | |
| By | /s/ Joseph C. Bartolacci |
| | Joseph C. Bartolacci |
| | President and Chief Executive Officer |
| | |
Pursuant to the requirements of the Securities Exchange Act of 1934, this report has been signed below by the following persons on behalf of the Registrant and in the capacities indicated on November 21, 2017:
|
| | |
/s/ Joseph C. Bartolacci | | /s/ Steven F. Nicola |
Joseph C. Bartolacci | | Steven F. Nicola |
President and Chief Executive Officer | | Chief Financial Officer and Secretary |
(Principal Executive Officer) | | (Principal Financial and Accounting Officer) |
| | |
| | |
| | |
/s/ John D. Turner | | /s/ Morgan K. O'Brien |
John D. Turner, Chairman of the Board | | Morgan K. O'Brien, Director |
| | |
| | |
| | |
/s/ Gregory S. Babe | | /s/ Don W. Quigley, Jr. |
Gregory S. Babe, Director | | Don W. Quigley, Jr., Director |
| | |
| | |
| | |
/s/ Katherine E. Dietze | | /s/ David A. Schawk |
Katherine E. Dietze, Director | | David A. Schawk, Director |
| | |
| | |
| | |
/s/ Terry L. Dunlap | | /s/ Jerry R. Whitaker |
Terry L. Dunlap, Director | | Jerry R. Whitaker, Director |
| | |
| | |
| | |
/s/ Alvaro Garcia-Tunon | | |
Alvaro Garcia-Tunon, Director | | |
| | |