INVESTOR PRESENTATION THIRD QUARTER FISCAL YEAR 2022 www.matw.com | Nasdaq: MATW
© 2022 Matthews International Corporation. All Rights Reserved. 2 DISCLAIMER Any forward-looking statements contained in this presentation are included pursuant to the “safe harbor” provisions of the Private Securities Litigation Reform Act of 1995. Such forward-looking statements involve known and unknown risks and uncertainties that may cause the Company’s actual results in future periods to be materially different from management’s expectations. Although the Company believes that the expectations reflected in such forward-looking statements are reasonable, no assurance can be given that such expectations will prove correct. Factors that could cause the Company's results to differ materially from the results discussed in such forward-looking statements principally include changes in domestic or international economic conditions, changes in foreign currency exchange rates, changes in the cost of materials used in the manufacture of the Company's products, changes in mortality and cremation rates, changes in product demand or pricing as a result of consolidation in the industries in which the Company operates, or other factors such as supply chain disruptions, labor shortages or labor cost increases, changes in product demand or pricing as a result of domestic or international competitive pressures, ability to achieve cost-reduction objectives, unknown risks in connection with the Company's acquisitions, cybersecurity concerns, effectiveness of the Company's internal controls, compliance with domestic and foreign laws and regulations, technological factors beyond the Company's control, impact of pandemics or similar outbreaks, or other disruptions to our industries, customers, or supply chains, the impact of global conflicts, such as the current war between Russia and Ukraine, and other factors described in the Company’s Annual Report on Form 10-K and other periodic filings with the U.S. Securities and Exchange Commission ("SEC"). The information contained in this presentation, including any financial data, is made as of June 30, 2022 unless otherwise noted. The Company does not, and is not obligated to, update this information after the date of such information. Included in this report are measures of financial performance that are not defined by generally accepted accounting principles in the United States (“GAAP”). The Company uses non-GAAP financial measures to assist in comparing its performance on a consistent basis for purposes of business decision-making by removing the impact of certain items that management believes do not directly reflect the Company’s core operations including acquisition costs, ERP integration costs, strategic initiative and other charges (which includes non-recurring charges related to operational initiatives and exit activities), stock-based compensation and the non-service portion of pension and postretirement expense. Management believes that presenting non-GAAP financial measures is useful to investors because it (i) provides investors with meaningful supplemental information regarding financial performance by excluding certain items that management believes do not directly reflect the Company’s core operations, (ii) permits investors to view performance using the same tools that management uses to budget, forecast, make operating and strategic decisions, and evaluate historical performance, and (iii) otherwise provides supplemental information that may be useful to investors in evaluating the Company’s results. The Company believes that the presentation of these non-GAAP financial measures, when considered together with the corresponding GAAP financial measures and the reconciliations to those measures, provided herein, provides investors with an additional understanding of the factors and trends affecting the Company’s business that could not be obtained absent these disclosures. The Company believes that adjusted EBITDA provides relevant and useful information, which is used by the Company’s management in assessing the performance of its business. Adjusted EBITDA is defined by the Company as earnings before interest, income taxes, depreciation, amortization and certain non-cash and/or non-recurring items that do not contribute directly to management’s evaluation of its operating results. These items include stock-based compensation, the non-service portion of pension and postretirement expense, acquisition costs, ERP integration costs, and strategic initiatives and other charges. Adjusted EBITDA provides the Company with an understanding of earnings before the impact of investing and financing charges and income taxes, and the effects of certain acquisition and ERP integration costs, and items that do not reflect the ordinary earnings of the Company’s operations. This measure may be useful to an investor in evaluating operating performance. It is also useful as a financial measure for lenders and is used by the Company’s management to measure business performance. Adjusted EBITDA is not a measure of the Company's financial performance under GAAP and should not be considered as an alternative to net income or other performance measures derived in accordance with GAAP, or as an alternative to cash flow from operating activities as a measure of the Company's liquidity. The Company's definition of adjusted EBITDA may not be comparable to similarly titled measures used by other companies. The Company has also presented adjusted net income and adjusted earnings per share and believes each measure provides relevant and useful information, which is widely used by analysts and investors, as well as by the Company’s management in assessing the performance of its business. Adjusted net income and adjusted earnings per share provides the Company with an understanding of the results from the primary operations of our business by excluding the effects of certain acquisition and system-integration costs, and items that do not reflect the ordinary earnings of our operations. These measures provide management with insight into the earning value for shareholders excluding certain costs, not related to the Company’s primary operations. Likewise, these measures may be useful to an investor in evaluating the underlying operating performance of the Company’s business overall, as well as performance trends, on a consistent basis. The Company has also presented net debt and a net debt leverage ratio and believes each measure provides relevant and useful information, which is widely used by analysts and investors as well as by our management. These measures provide management with insight on the indebtedness of the Company, net of cash and cash equivalents and relative to adjusted EBITDA. These measures allow management, as well as analysts and investors, to assess the Company’s leverage.. Lastly, the Company has presented free cash flow as supplemental measures of cash flow that are not required by, or presented in accordance with, GAAP. Management believes that these measures provide relevant and useful information, which is widely used by analysts and investors as well as by our management. These measures provide management with insight on the cash generated by operations, excluding capital expenditures. These measures allows management, as well as analysts and investors, to assess the Company’s ability to pursue growth and investment opportunities designed to increase Shareholder value.
© 2022 Matthews International Corporation. All Rights Reserved. 3 BUSINESS OVERVIEW
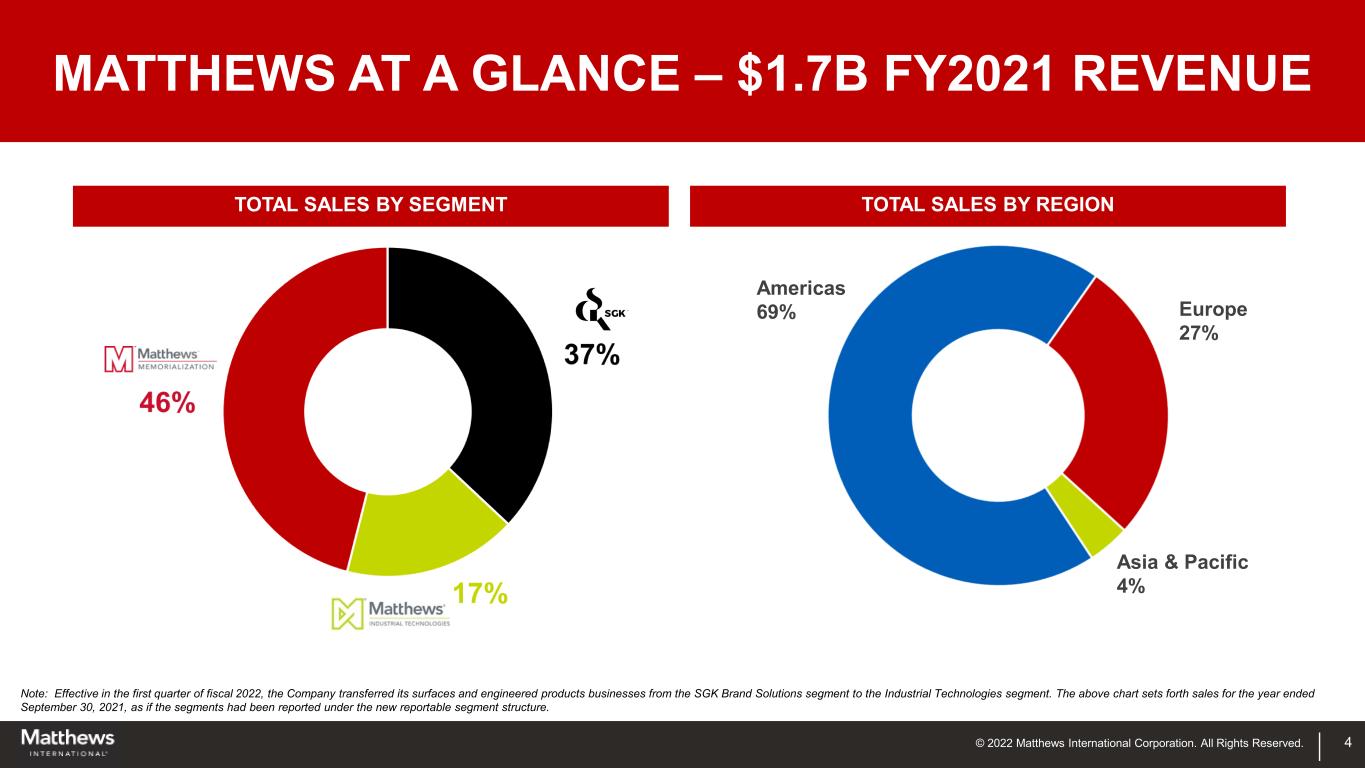
© 2022 Matthews International Corporation. All Rights Reserved. 4 MATTHEWS AT A GLANCE – $1.7B FY2021 REVENUE Note: Effective in the first quarter of fiscal 2022, the Company transferred its surfaces and engineered products businesses from the SGK Brand Solutions segment to the Industrial Technologies segment. The above chart sets forth sales for the year ended September 30, 2021, as if the segments had been reported under the new reportable segment structure. Americas 69% TOTAL SALES BY REGIONTOTAL SALES BY SEGMENT Europe 27% Asia & Pacific 4%
© 2022 Matthews International Corporation. All Rights Reserved.© 2022 Matthews International Corporation. All Rights Reserved. ENGINEERED SOLUTIONS PRODUCT IDENTIFICATION WAREHOUSE AUTOMATION
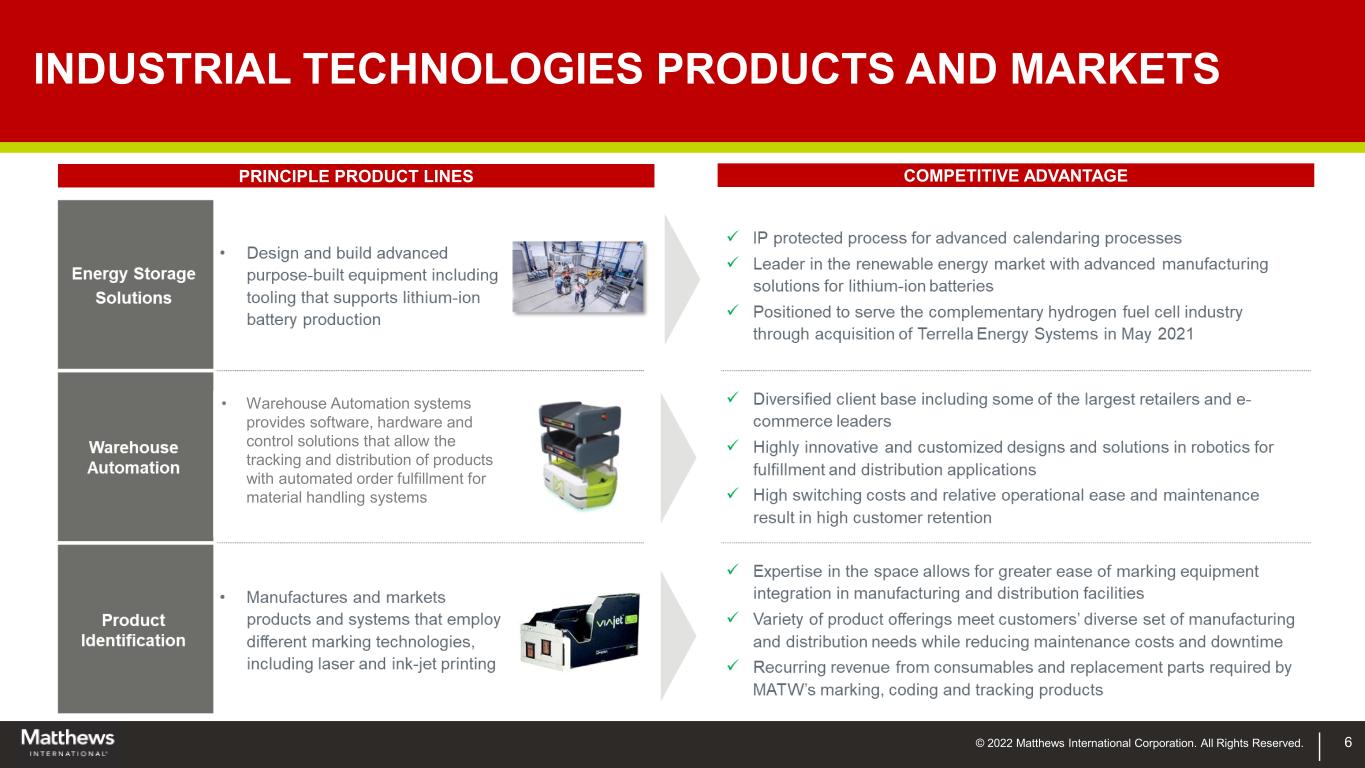
© 2022 Matthews International Corporation. All Rights Reserved. 6 INDUSTRIAL TECHNOLOGIES PRODUCTS AND MARKETS COMPETITIVE ADVANTAGEPRINCIPLE PRODUCT LINES • Warehouse Automation systems provides software, hardware and control solutions that allow the tracking and distribution of products with automated order fulfillment for material handling systems
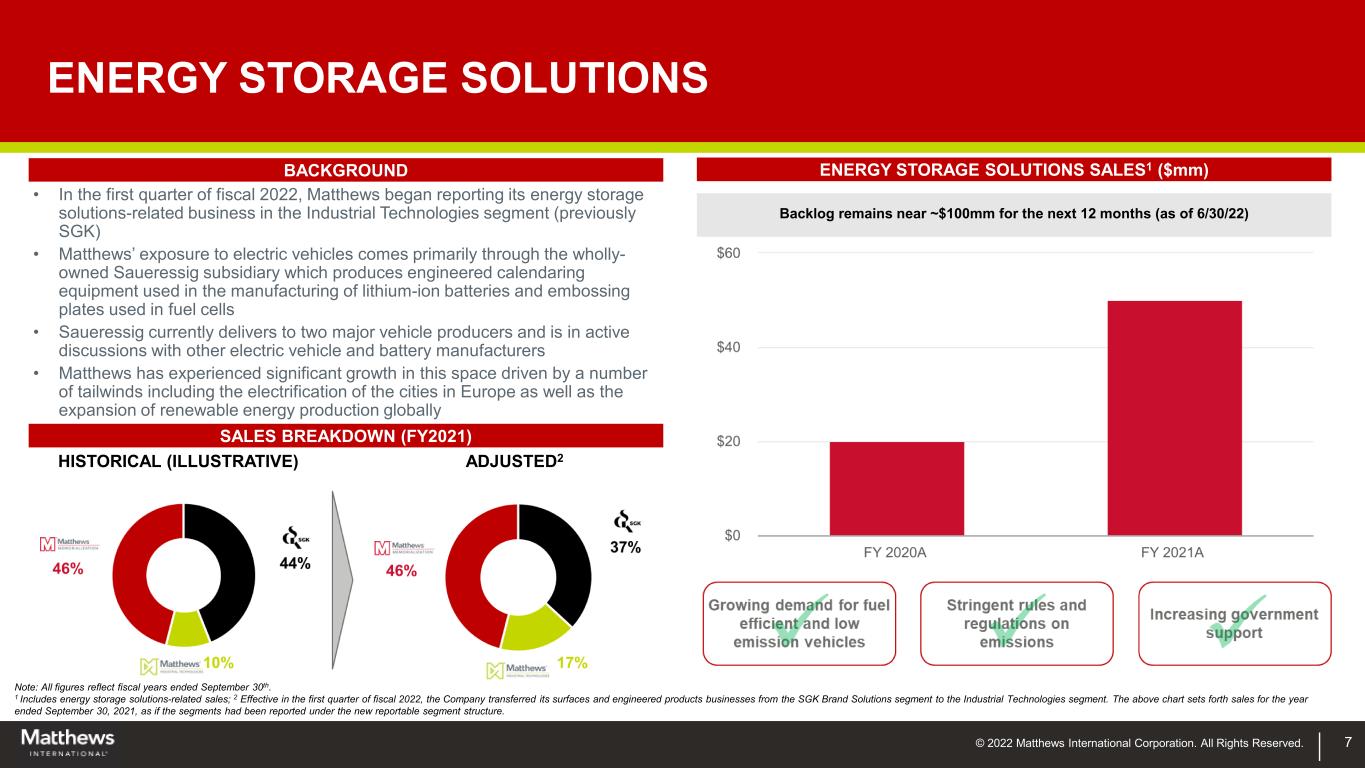
© 2022 Matthews International Corporation. All Rights Reserved. 7 ENERGY STORAGE SOLUTIONS • In the first quarter of fiscal 2022, Matthews began reporting its energy storage solutions-related business in the Industrial Technologies segment (previously SGK) • Matthews’ exposure to electric vehicles comes primarily through the wholly- owned Saueressig subsidiary which produces engineered calendaring equipment used in the manufacturing of lithium-ion batteries and embossing plates used in fuel cells • Saueressig currently delivers to two major vehicle producers and is in active discussions with other electric vehicle and battery manufacturers • Matthews has experienced significant growth in this space driven by a number of tailwinds including the electrification of the cities in Europe as well as the expansion of renewable energy production globally HISTORICAL (ILLUSTRATIVE) ADJUSTED2 Note: All figures reflect fiscal years ended September 30th. 1 Includes energy storage solutions-related sales; 2 Effective in the first quarter of fiscal 2022, the Company transferred its surfaces and engineered products businesses from the SGK Brand Solutions segment to the Industrial Technologies segment. The above chart sets forth sales for the year ended September 30, 2021, as if the segments had been reported under the new reportable segment structure. Backlog remains near ~$100mm for the next 12 months (as of 6/30/22) BACKGROUND ENERGY STORAGE SOLUTIONS SALES1 ($mm) SALES BREAKDOWN (FY2021)
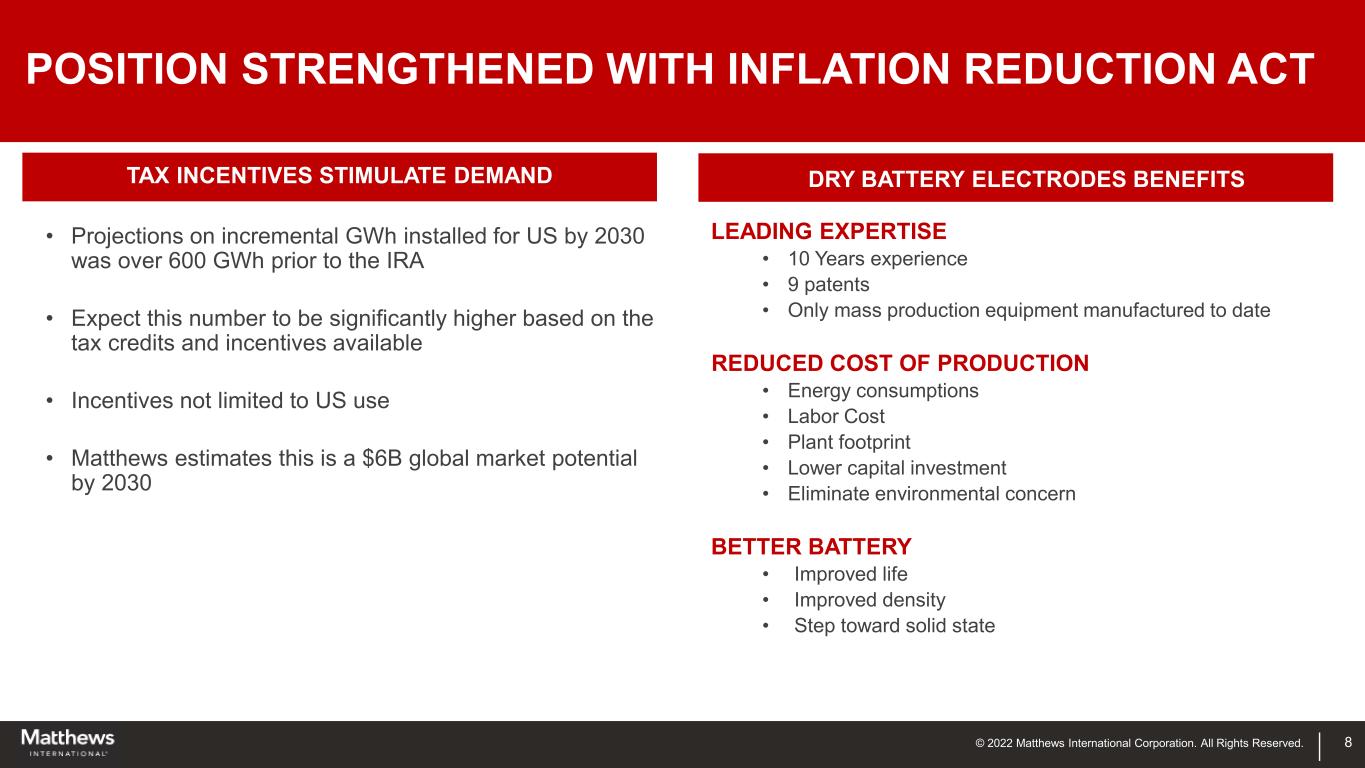
© 2022 Matthews International Corporation. All Rights Reserved. 8 POSITION STRENGTHENED WITH INFLATION REDUCTION ACT • Projections on incremental GWh installed for US by 2030 was over 600 GWh prior to the IRA • Expect this number to be significantly higher based on the tax credits and incentives available • Incentives not limited to US use • Matthews estimates this is a $6B global market potential by 2030 TAX INCENTIVES STIMULATE DEMAND DRY BATTERY ELECTRODES BENEFITS LEADING EXPERTISE • 10 Years experience • 9 patents • Only mass production equipment manufactured to date REDUCED COST OF PRODUCTION • Energy consumptions • Labor Cost • Plant footprint • Lower capital investment • Eliminate environmental concern BETTER BATTERY • Improved life • Improved density • Step toward solid state
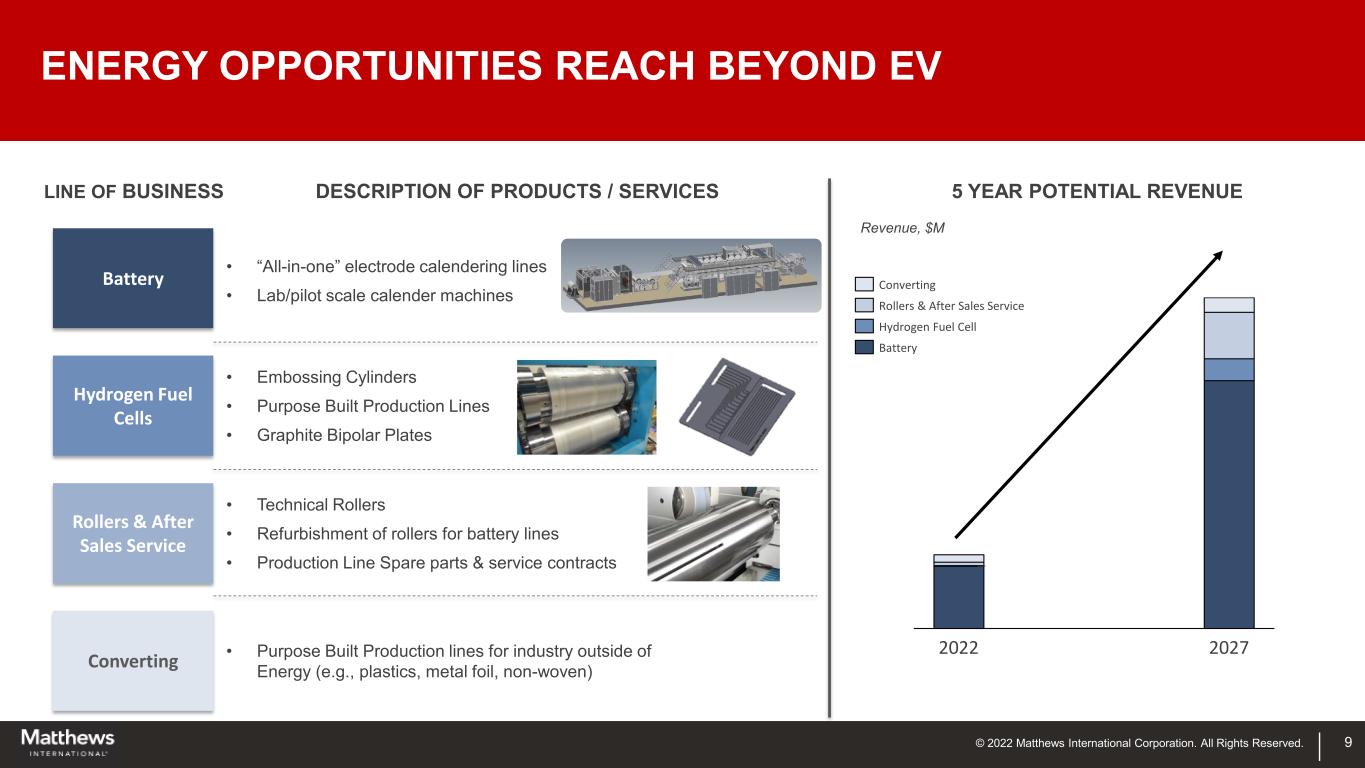
© 2022 Matthews International Corporation. All Rights Reserved. 9 ENERGY OPPORTUNITIES REACH BEYOND EV Battery Converting Hydrogen Fuel Cells Rollers & After Sales Service 2022 2027 Converting Hydrogen Fuel Cell Battery Rollers & After Sales Service 5 YEAR POTENTIAL REVENUE DESCRIPTION OF PRODUCTS / SERVICES • “All-in-one” electrode calendering lines • Lab/pilot scale calender machines • Embossing Cylinders • Purpose Built Production Lines • Graphite Bipolar Plates • Purpose Built Production lines for industry outside of Energy (e.g., plastics, metal foil, non-woven) • Technical Rollers • Refurbishment of rollers for battery lines • Production Line Spare parts & service contracts LINE OF BUSINESS Revenue, $M
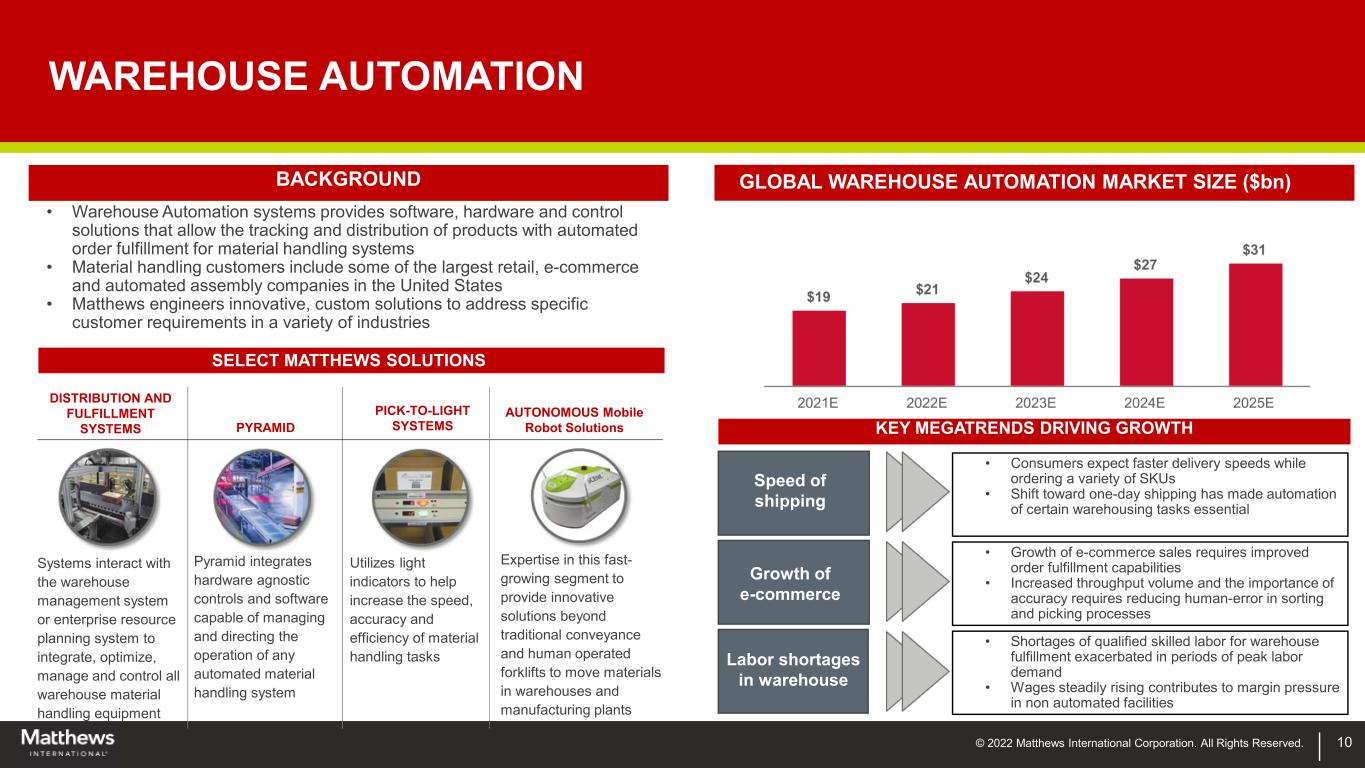
© 2022 Matthews International Corporation. All Rights Reserved. 10 WAREHOUSE AUTOMATION • Warehouse Automation systems provides software, hardware and control solutions that allow the tracking and distribution of products with automated order fulfillment for material handling systems • Material handling customers include some of the largest retail, e-commerce and automated assembly companies in the United States • Matthews engineers innovative, custom solutions to address specific customer requirements in a variety of industries BACKGROUND GLOBAL WAREHOUSE AUTOMATION MARKET SIZE ($bn) Speed of shipping Growth of e-commerce Labor shortages in warehouse KEY MEGATRENDS DRIVING GROWTH Systems interact with the warehouse management system or enterprise resource planning system to integrate, optimize, manage and control all warehouse material handling equipment DISTRIBUTION AND FULFILLMENT SYSTEMS PYRAMID PICK-TO-LIGHT SYSTEMS AUTONOMOUS Mobile Robot Solutions Pyramid integrates hardware agnostic controls and software capable of managing and directing the operation of any automated material handling system Utilizes light indicators to help increase the speed, accuracy and efficiency of material handling tasks Expertise in this fast- growing segment to provide innovative solutions beyond traditional conveyance and human operated forklifts to move materials in warehouses and manufacturing plants SELECT MATTHEWS SOLUTIONS • Consumers expect faster delivery speeds while ordering a variety of SKUs • Shift toward one-day shipping has made automation of certain warehousing tasks essential • Growth of e-commerce sales requires improved order fulfillment capabilities • Increased throughput volume and the importance of accuracy requires reducing human-error in sorting and picking processes • Shortages of qualified skilled labor for warehouse fulfillment exacerbated in periods of peak labor demand • Wages steadily rising contributes to margin pressure in non automated facilities
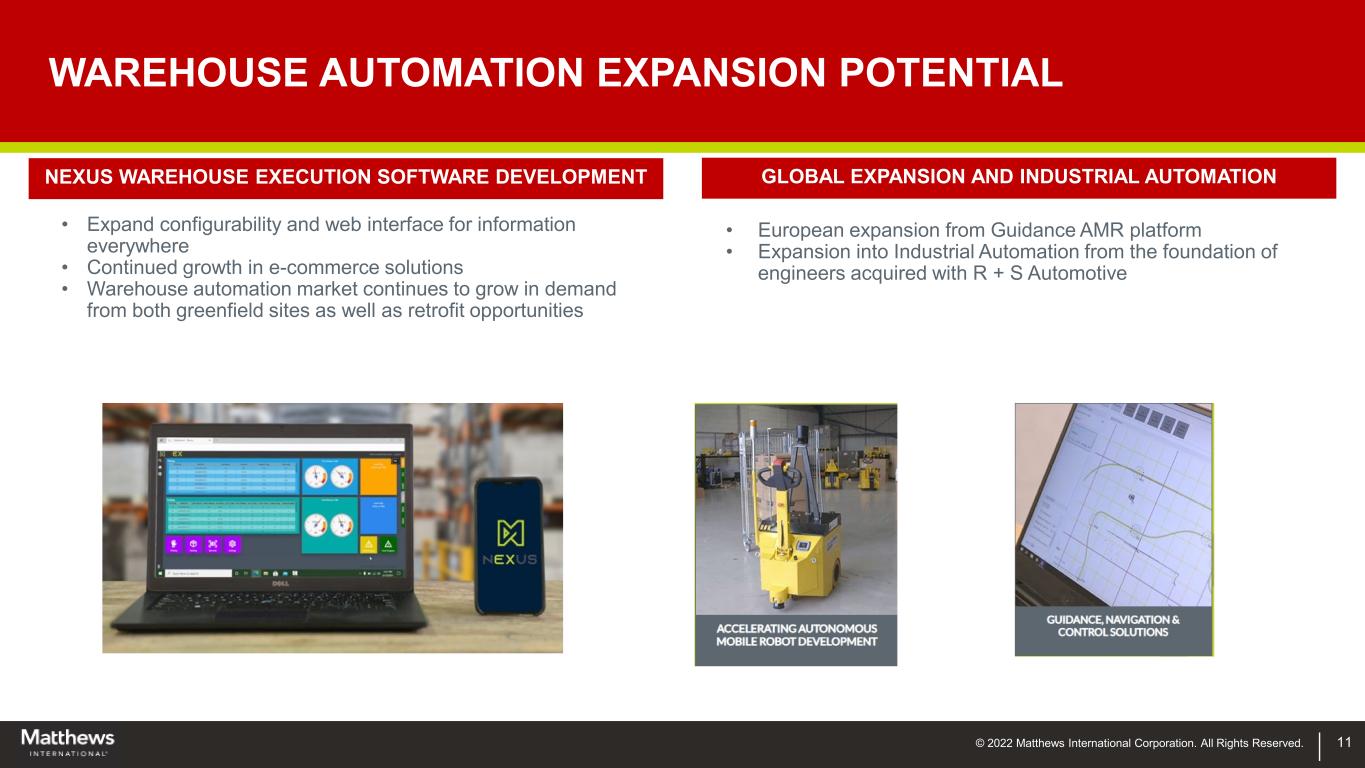
© 2022 Matthews International Corporation. All Rights Reserved. 11 WAREHOUSE AUTOMATION EXPANSION POTENTIAL • Expand configurability and web interface for information everywhere • Continued growth in e-commerce solutions • Warehouse automation market continues to grow in demand from both greenfield sites as well as retrofit opportunities • European expansion from Guidance AMR platform • Expansion into Industrial Automation from the foundation of engineers acquired with R + S Automotive NEXUS WAREHOUSE EXECUTION SOFTWARE DEVELOPMENT GLOBAL EXPANSION AND INDUSTRIAL AUTOMATION
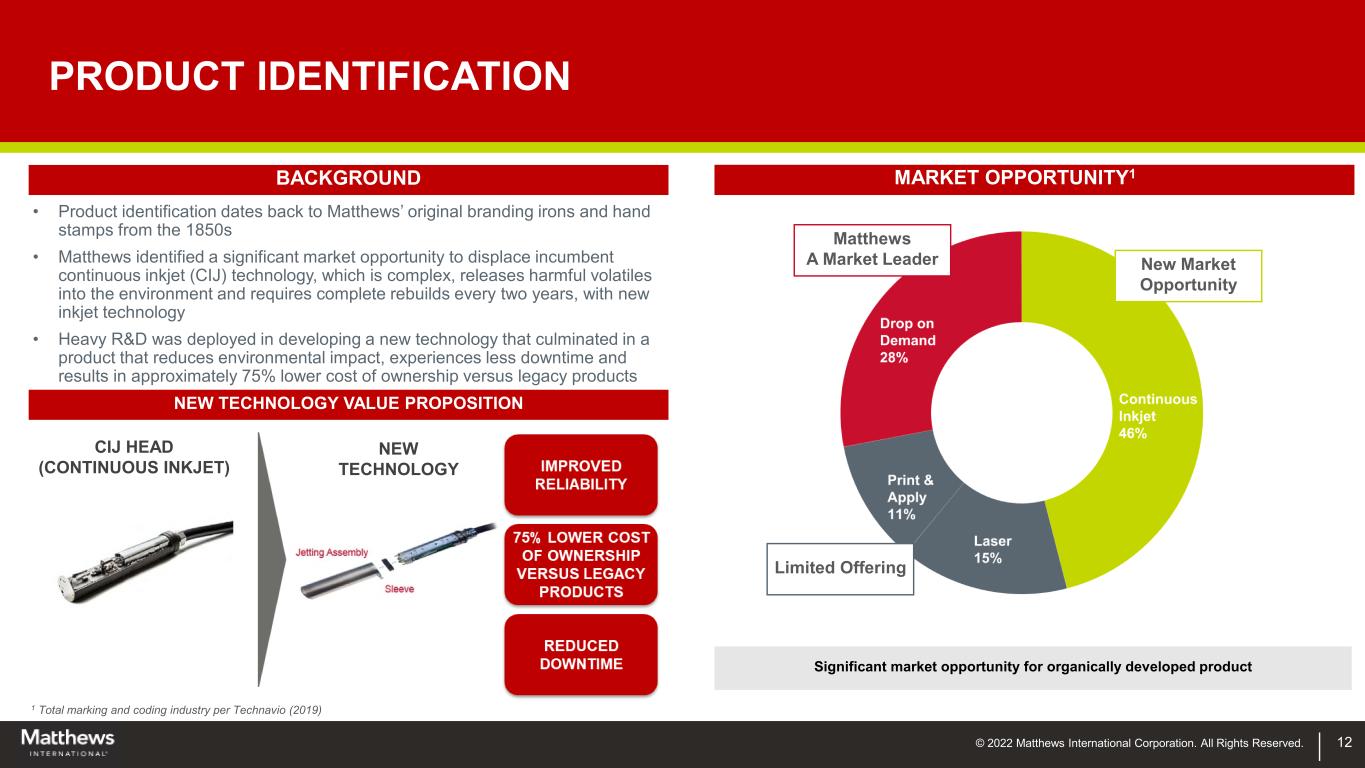
© 2022 Matthews International Corporation. All Rights Reserved. 12 PRODUCT IDENTIFICATION • Product identification dates back to Matthews’ original branding irons and hand stamps from the 1850s • Matthews identified a significant market opportunity to displace incumbent continuous inkjet (CIJ) technology, which is complex, releases harmful volatiles into the environment and requires complete rebuilds every two years, with new inkjet technology • Heavy R&D was deployed in developing a new technology that culminated in a product that reduces environmental impact, experiences less downtime and results in approximately 75% lower cost of ownership versus legacy products BACKGROUND MARKET OPPORTUNITY1 NEW TECHNOLOGY VALUE PROPOSITION CIJ HEAD (CONTINUOUS INKJET) NEW TECHNOLOGY 1 Total marking and coding industry per Technavio (2019) New Market Opportunity Limited Offering Matthews A Market Leader Significant market opportunity for organically developed product
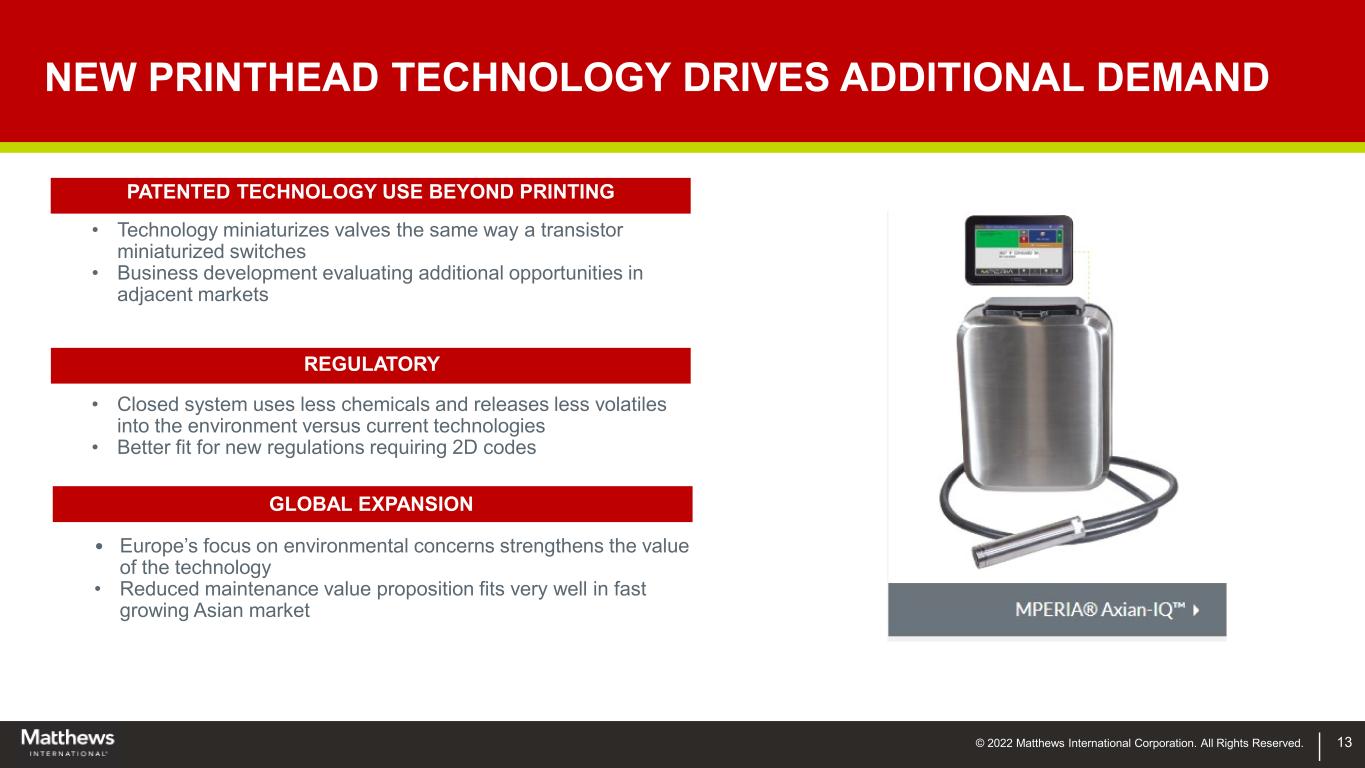
© 2022 Matthews International Corporation. All Rights Reserved. 13 NEW PRINTHEAD TECHNOLOGY DRIVES ADDITIONAL DEMAND GLOBAL EXPANSION • Technology miniaturizes valves the same way a transistor miniaturized switches • Business development evaluating additional opportunities in adjacent markets PATENTED TECHNOLOGY USE BEYOND PRINTING REGULATORY • Closed system uses less chemicals and releases less volatiles into the environment versus current technologies • Better fit for new regulations requiring 2D codes GLOBAL EXPANSION • Europe’s focus on environmental concerns strengthens the value of the technology • Reduced maintenance value proposition fits very well in fast growing Asian market
© 2022 Matthews International Corporation. All Rights Reserved.© 2022 Matthews International Corporation. All Rights Reserved. CEMETERY PRODUCTS FUNERAL HOME PRODUCTS CREMATION PRODUCTS AND EQUIPMENT tt s I t r ti l r r ti . ll i ts s rv .
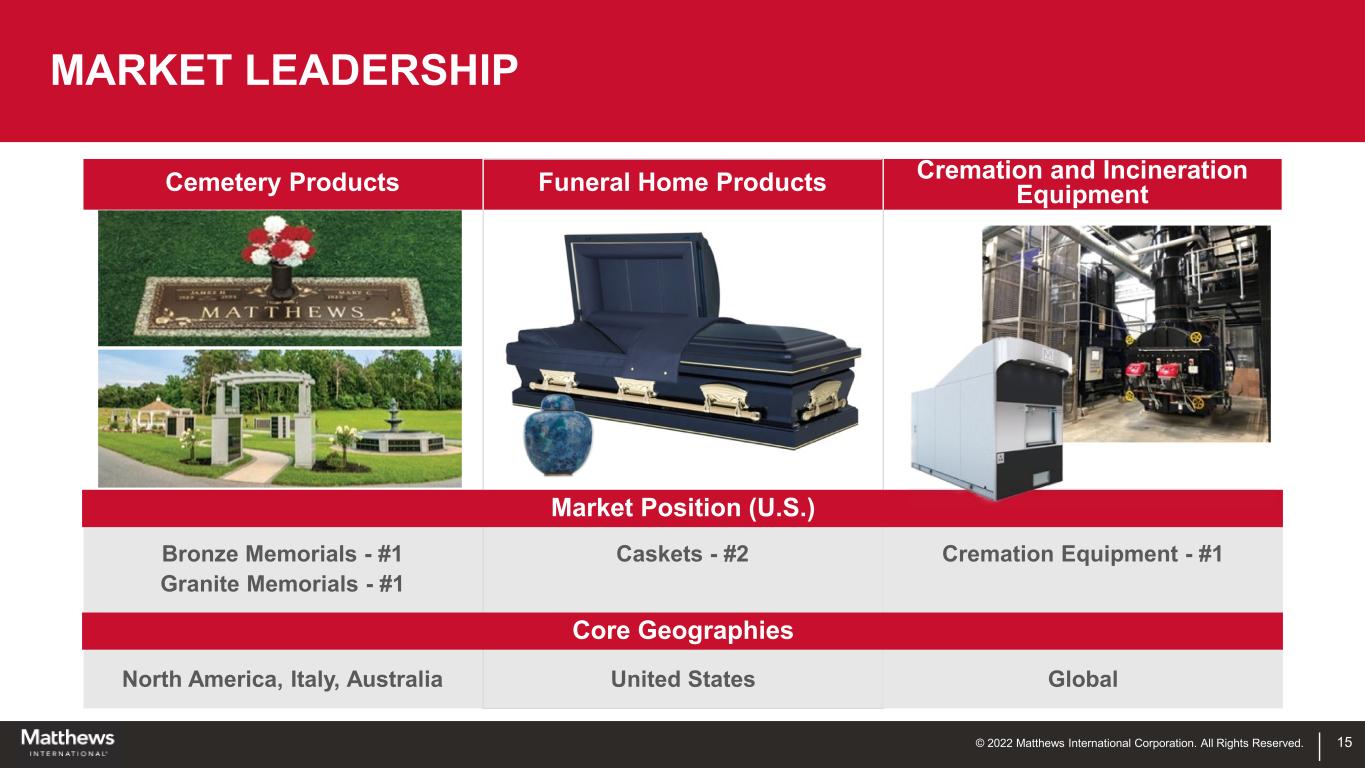
© 2022 Matthews International Corporation. All Rights Reserved. Cemetery Products Bronze Memorials - #1 Granite Memorials - #1 North America, Italy, Australia 15 Funeral Home Products Caskets - #2 United States Cremation and Incineration Equipment Cremation Equipment - #1 Global Market Position (U.S.) Core Geographies MARKET LEADERSHIP
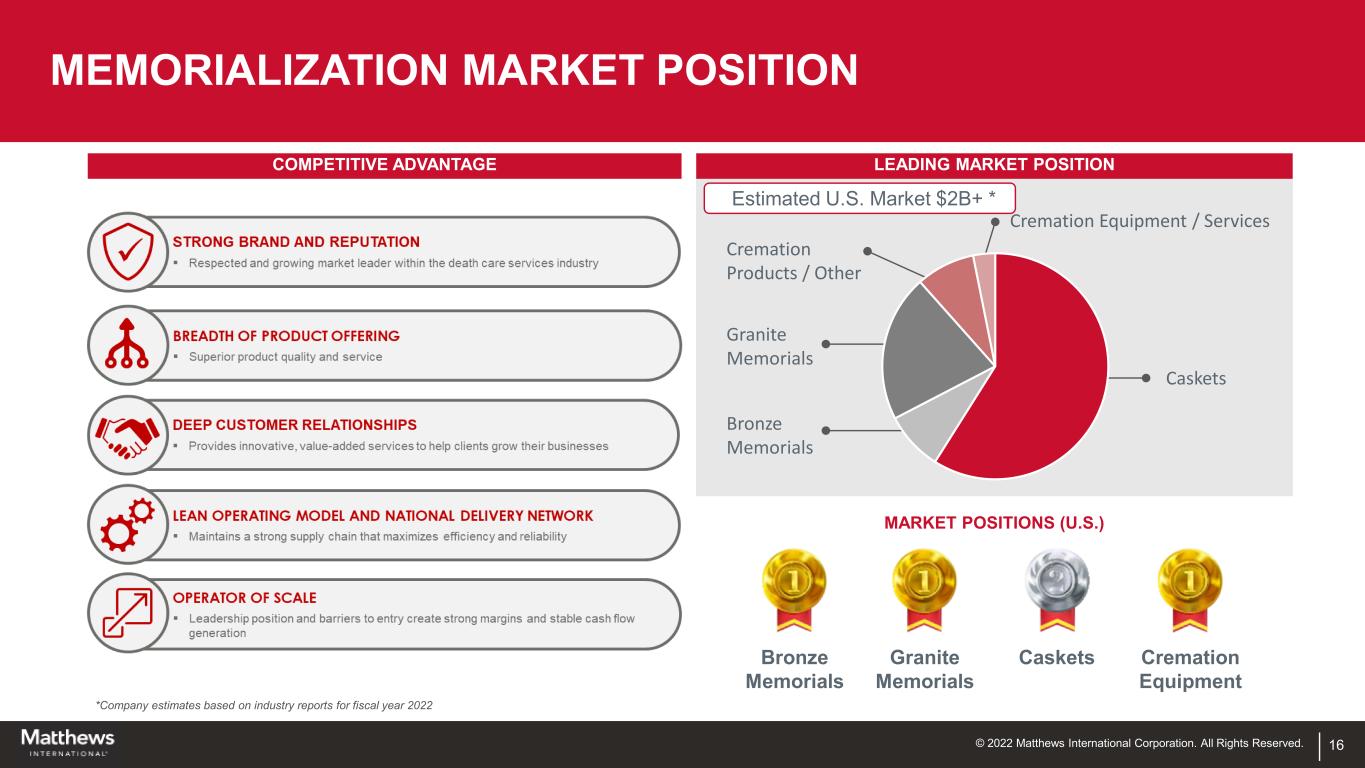
© 2022 Matthews International Corporation. All Rights Reserved. MEMORIALIZATION MARKET POSITION *Company estimates based on industry reports for fiscal year 2022 MARKET POSITIONS (U.S.) Bronze Memorials Granite Memorials Caskets Cremation Equipment COMPETITIVE ADVANTAGE Cremation Equipment / Services Caskets Cremation Products / Other Granite Memorials Bronze Memorials Estimated U.S. Market $2B+ * LEADING MARKET POSITION 16
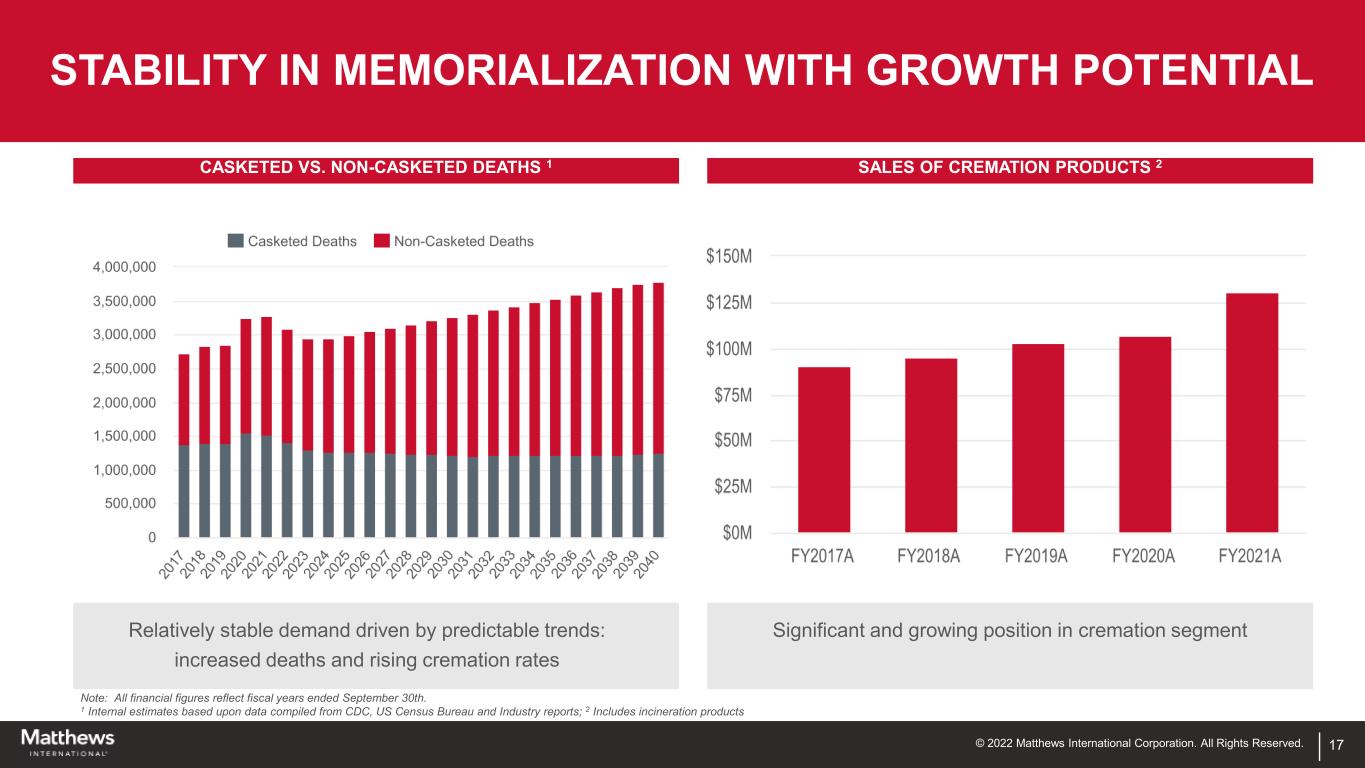
© 2022 Matthews International Corporation. All Rights Reserved. * * Note: All financial figures reflect fiscal years ended September 30th. 1 Internal estimates based upon data compiled from CDC, US Census Bureau and Industry reports; 2 Includes incineration products CASKETED VS. NON-CASKETED DEATHS 1 Relatively stable demand driven by predictable trends: increased deaths and rising cremation rates STABILITY IN MEMORIALIZATION WITH GROWTH POTENTIAL SALES OF CREMATION PRODUCTS 2 Significant and growing position in cremation segment 17
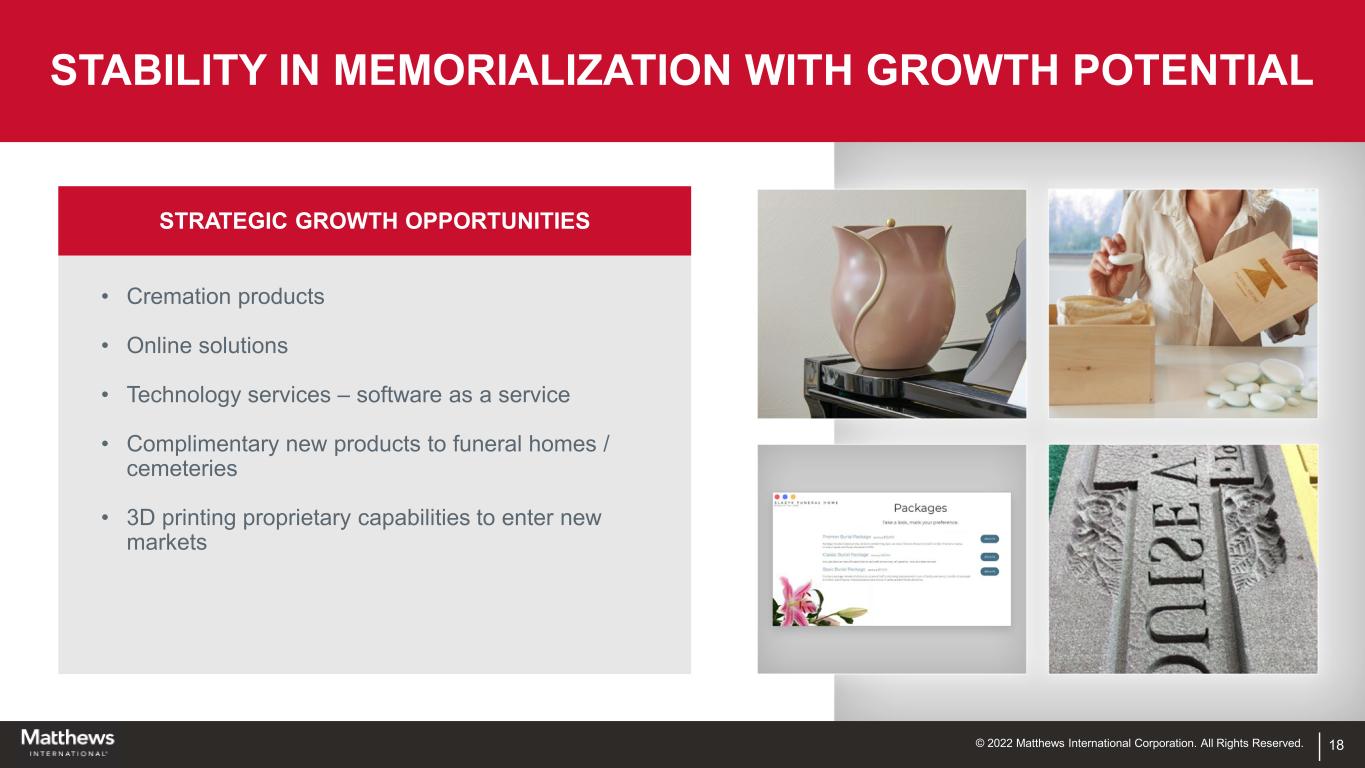
© 2022 Matthews International Corporation. All Rights Reserved. STABILITY IN MEMORIALIZATION WITH GROWTH POTENTIAL • Cremation products • Online solutions • Technology services – software as a service • Complimentary new products to funeral homes / cemeteries • 3D printing proprietary capabilities to enter new markets 18 STRATEGIC GROWTH OPPORTUNITIES
© 2022 Matthews International Corporation. All Rights Reserved.© 2022 Matthews International Corporation. All Rights Reserved.
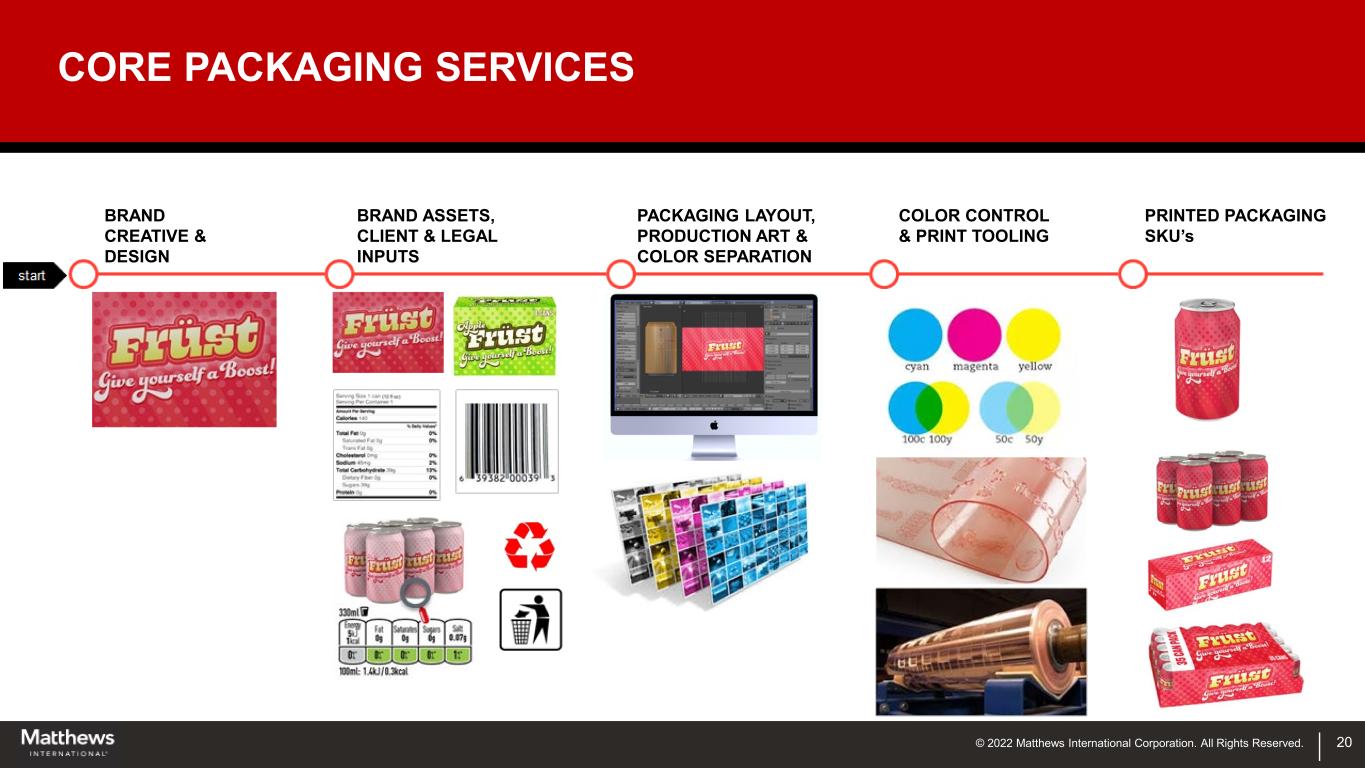
© 2022 Matthews International Corporation. All Rights Reserved. 20 PRINTED PACKAGING SKU’s BRAND CREATIVE & DESIGN BRAND ASSETS, CLIENT & LEGAL INPUTS PACKAGING LAYOUT, PRODUCTION ART & COLOR SEPARATION COLOR CONTROL & PRINT TOOLING CORE PACKAGING SERVICES CORE PACKAGING SERVICES
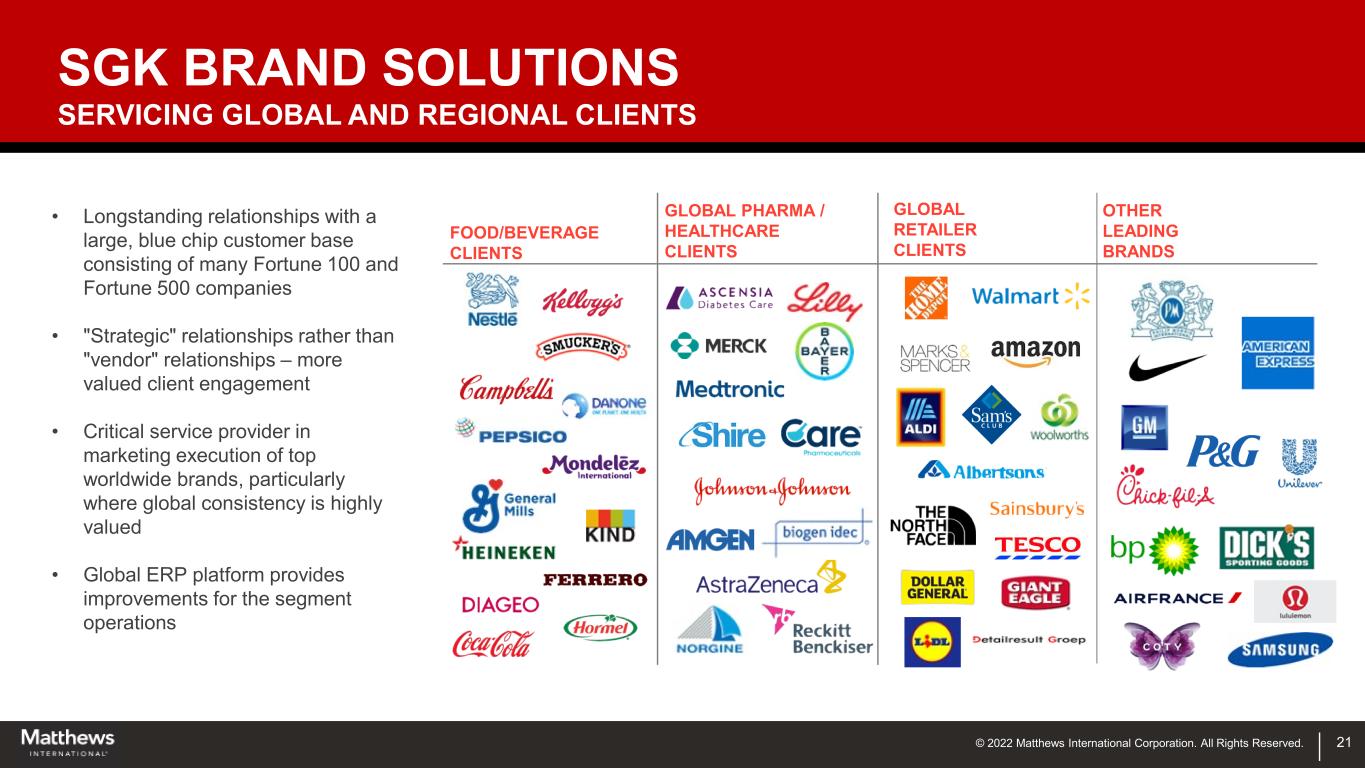
© 2022 Matthews International Corporation. All Rights Reserved. SGK BRAND SOLUTIONS FOOD/BEVERAGE CLIENTS GLOBAL PHARMA / HEALTHCARE CLIENTS GLOBAL RETAILER CLIENTS OTHER LEADING BRANDS 21 • Longstanding relationships with a large, blue chip customer base consisting of many Fortune 100 and Fortune 500 companies • "Strategic" relationships rather than "vendor" relationships – more valued client engagement • Critical service provider in marketing execution of top worldwide brands, particularly where global consistency is highly valued • Global ERP platform provides improvements for the segment operations CORE PACKAGING SERVICES BRAND SOLUTIONS SERVICING GLOBAL AND REGIONAL CLIENTS
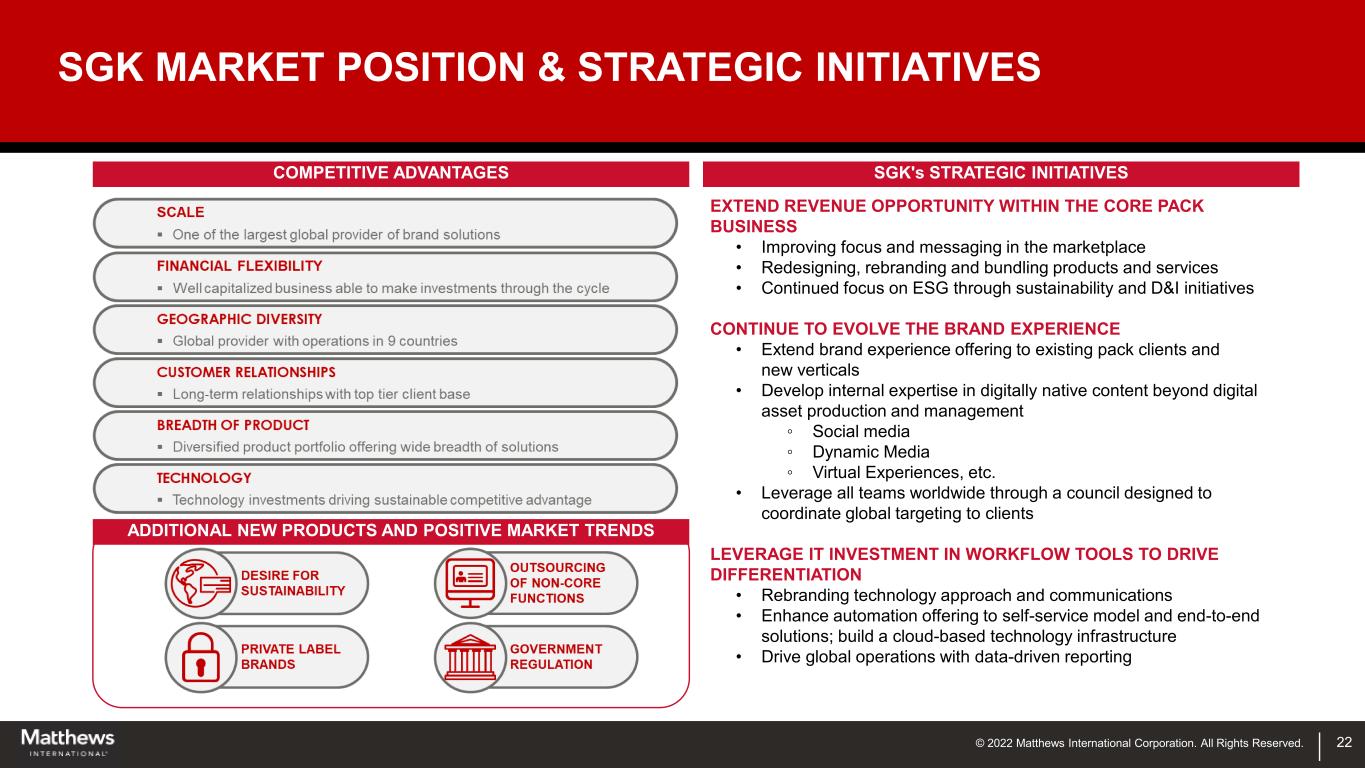
© 2022 Matthews International Corporation. All Rights Reserved. SGK's STRATEGIC INITIATIVES 22 EXTEND REVENUE OPPORTUNITY WITHIN THE CORE PACK BUSINESS • Improving focus and messaging in the marketplace • Redesigning, rebranding and bundling products and services • Continued focus on ESG through sustainability and D&I initiatives CONTINUE TO EVOLVE THE BRAND EXPERIENCE • Extend brand experience offering to existing pack clients and new verticals • Develop internal expertise in digitally native content beyond digital asset production and management ◦ Social media ◦ Dynamic Media ◦ Virtual Experiences, etc. • Leverage all teams worldwide through a council designed to coordinate global targeting to clients LEVERAGE IT INVESTMENT IN WORKFLOW TOOLS TO DRIVE DIFFERENTIATION • Rebranding technology approach and communications • Enhance automation offering to self-service model and end-to-end solutions; build a cloud-based technology infrastructure • Drive global operations with data-driven reporting COMPETITIVE ADVANTAGES CORE PACKAGING SERVICES SGK MARKET POSITION & STRATEGIC INITIATIVES ADDITIONAL NEW PRODUCTS AND POSITIVE MARKET TRENDS
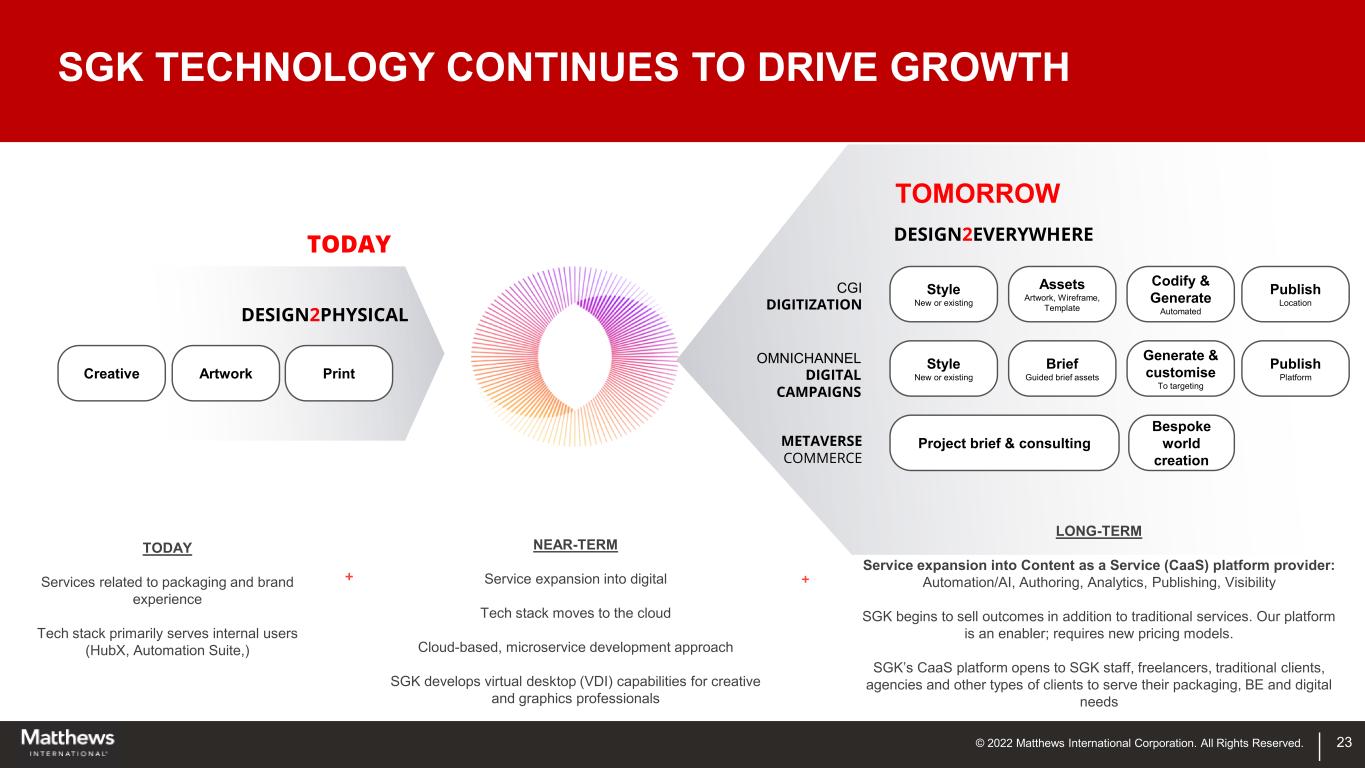
© 2022 Matthews International Corporation. All Rights Reserved. 23 CORE PACKAGING SERVICES SGK TECHNOLOGY CONTINUES TO DRIVE GROWTH TODAY Services related to packaging and brand experience Tech stack primarily serves internal users (HubX, Automation Suite,) NEAR-TERM Service expansion into digital Tech stack moves to the cloud Cloud-based, microservice development approach SGK develops virtual desktop (VDI) capabilities for creative and graphics professionals + Style New or existing DESIGN2PHYSICAL DESIGN2EVERYWHERE CGI DIGITIZATION OMNICHANNEL DIGITAL CAMPAIGNS METAVERSE COMMERCE Assets Artwork, Wireframe, Template Codify & Generate Automated Publish Location Style New or existing Brief Guided brief assets Generate & customise To targeting Publish Platform Project brief & consulting Bespoke world creation PrintArtworkCreative TODAY TOMORROW LONG-TERM Service expansion into Content as a Service (CaaS) platform provider: Automation/AI, Authoring, Analytics, Publishing, Visibility SGK begins to sell outcomes in addition to traditional services. Our platform is an enabler; requires new pricing models. SGK’s CaaS platform opens to SGK staff, freelancers, traditional clients, agencies and other types of clients to serve their packaging, BE and digital needs +
© 2022 Matthews International Corporation. All Rights Reserved. 24 INVESTMENT THESIS
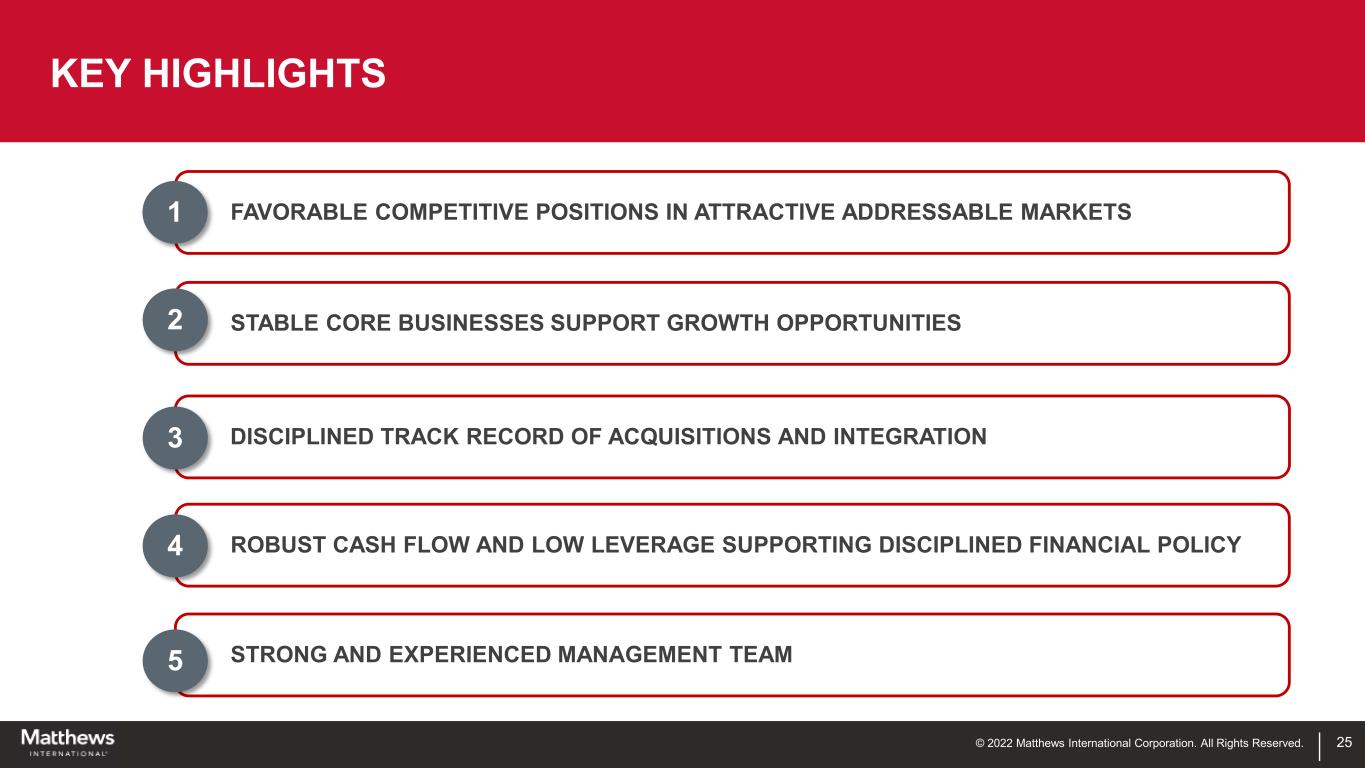
© 2022 Matthews International Corporation. All Rights Reserved. 25 FAVORABLE COMPETITIVE POSITIONS IN ATTRACTIVE ADDRESSABLE MARKETS DISCIPLINED TRACK RECORD OF ACQUISITIONS AND INTEGRATION ROBUST CASH FLOW AND LOW LEVERAGE SUPPORTING DISCIPLINED FINANCIAL POLICY STABLE CORE BUSINESSES SUPPORT GROWTH OPPORTUNITIES STRONG AND EXPERIENCED MANAGEMENT TEAM 1 2 4 5 3 KEY HIGHLIGHTS
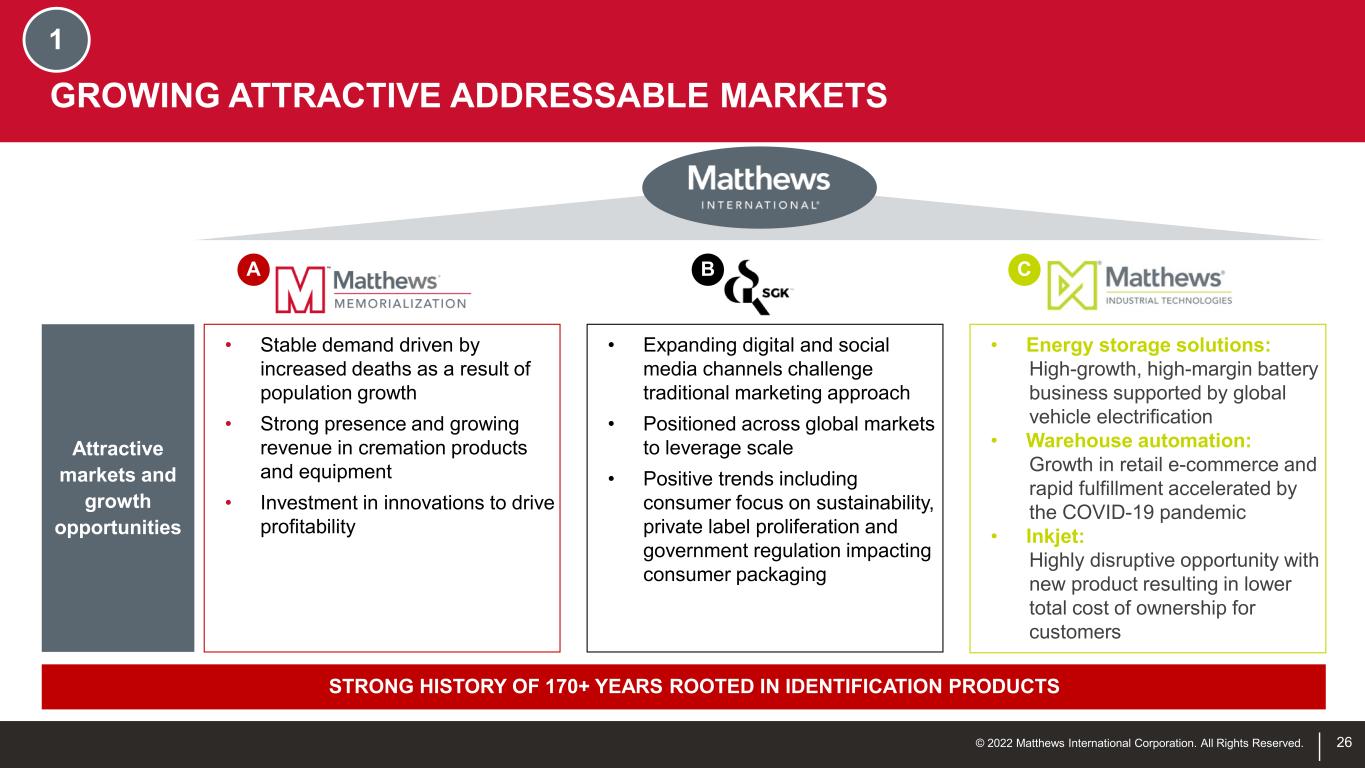
© 2022 Matthews International Corporation. All Rights Reserved. A B C Attractive markets and growth opportunities • Stable demand driven by increased deaths as a result of population growth • Strong presence and growing revenue in cremation products and equipment • Investment in innovations to drive profitability • Expanding digital and social media channels challenge traditional marketing approach • Positioned across global markets to leverage scale • Positive trends including consumer focus on sustainability, private label proliferation and government regulation impacting consumer packaging • Energy storage solutions: High-growth, high-margin battery business supported by global vehicle electrification • Warehouse automation: Growth in retail e-commerce and rapid fulfillment accelerated by the COVID-19 pandemic • Inkjet: Highly disruptive opportunity with new product resulting in lower total cost of ownership for customers STRONG HISTORY OF 170+ YEARS ROOTED IN IDENTIFICATION PRODUCTS 26 1 GROWING ATTRACTIVE ADDRESSABLE MARKETS
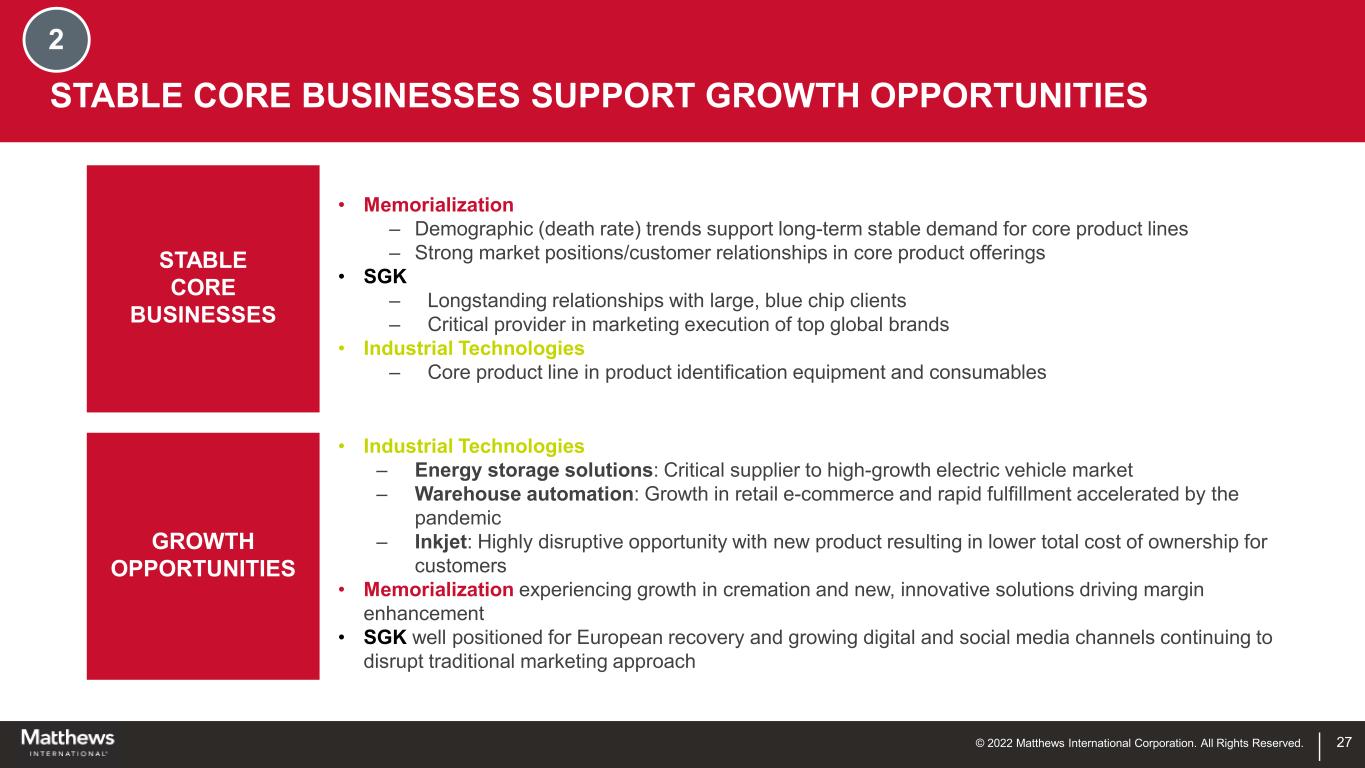
© 2022 Matthews International Corporation. All Rights Reserved. 27 STABLE CORE BUSINESSES SUPPORT GROWTH OPPORTUNITIES STABLE CORE BUSINESSES GROWTH OPPORTUNITIES • Memorialization – Demographic (death rate) trends support long-term stable demand for core product lines – Strong market positions/customer relationships in core product offerings • SGK – Longstanding relationships with large, blue chip clients – Critical provider in marketing execution of top global brands • Industrial Technologies – Core product line in product identification equipment and consumables • Industrial Technologies – Energy storage solutions: Critical supplier to high-growth electric vehicle market – Warehouse automation: Growth in retail e-commerce and rapid fulfillment accelerated by the pandemic – Inkjet: Highly disruptive opportunity with new product resulting in lower total cost of ownership for customers • Memorialization experiencing growth in cremation and new, innovative solutions driving margin enhancement • SGK well positioned for European recovery and growing digital and social media channels continuing to disrupt traditional marketing approach 2
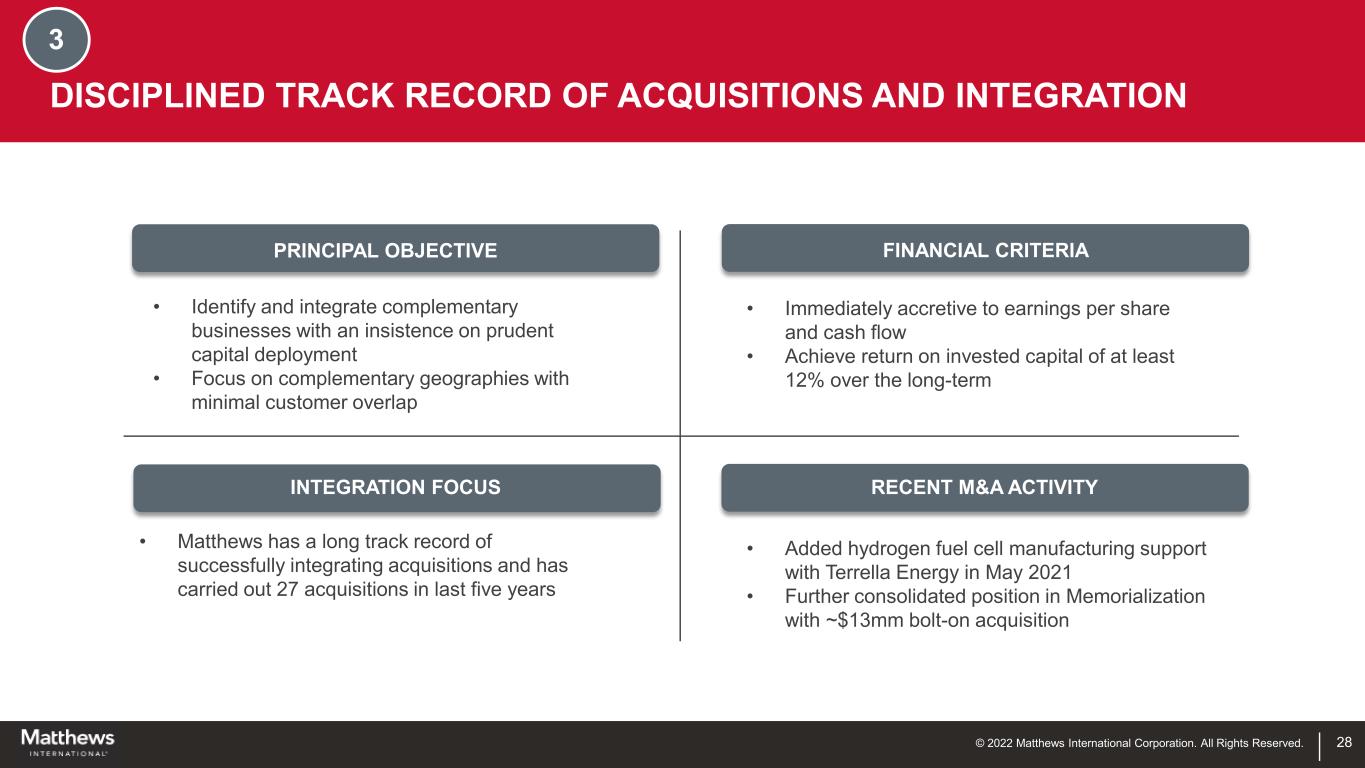
© 2022 Matthews International Corporation. All Rights Reserved. 28 3 DISCIPLINED TRACK RECORD OF ACQUISITIONS AND INTEGRATION • Identify and integrate complementary businesses with an insistence on prudent capital deployment • Focus on complementary geographies with minimal customer overlap • Immediately accretive to earnings per share and cash flow • Achieve return on invested capital of at least 12% over the long-term • Matthews has a long track record of successfully integrating acquisitions and has carried out 27 acquisitions in last five years • Added hydrogen fuel cell manufacturing support with Terrella Energy in May 2021 • Further consolidated position in Memorialization with ~$13mm bolt-on acquisition PRINCIPAL OBJECTIVE FINANCIAL CRITERIA INTEGRATION FOCUS RECENT M&A ACTIVITY
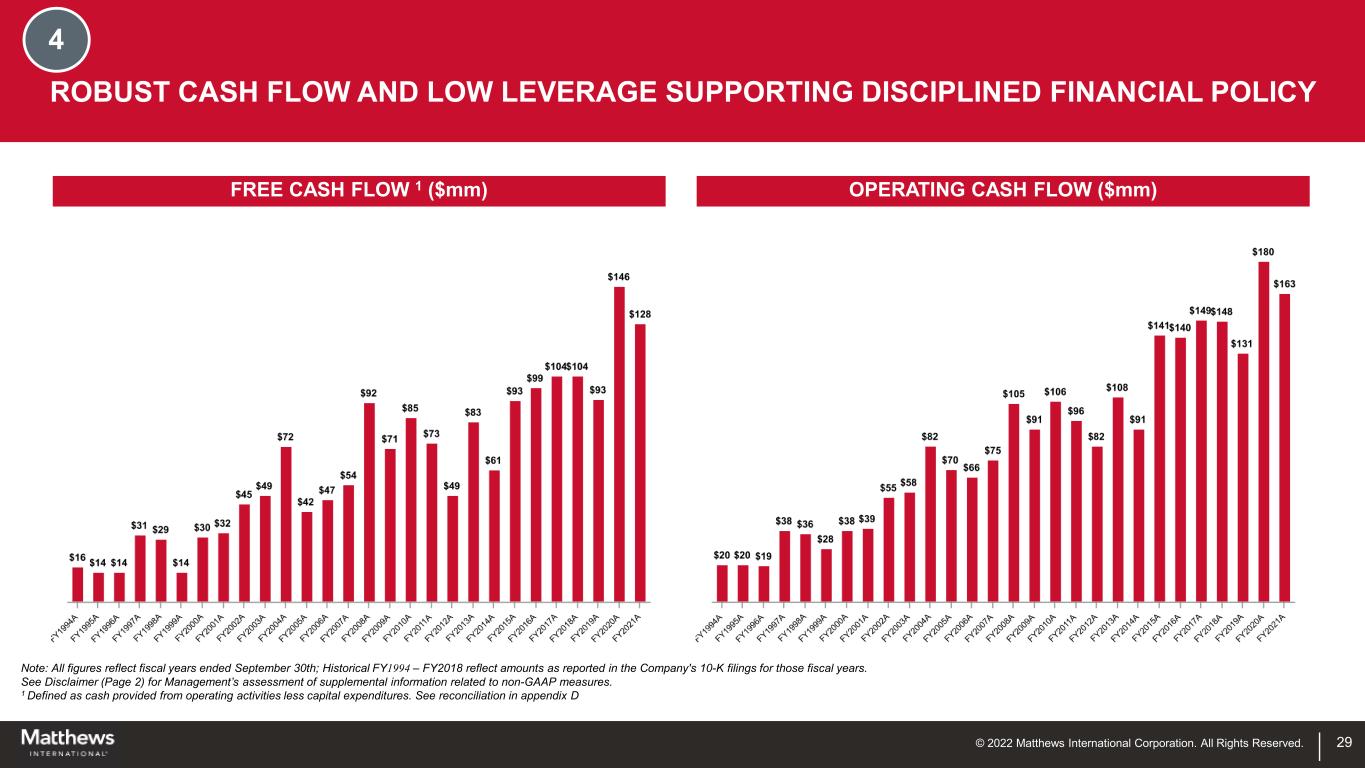
© 2022 Matthews International Corporation. All Rights Reserved. 29 Note: All figures reflect fiscal years ended September 30th; Historical FY1994 – FY2018 reflect amounts as reported in the Company's 10-K filings for those fiscal years. See Disclaimer (Page 2) for Management’s assessment of supplemental information related to non-GAAP measures. 1 Defined as cash provided from operating activities less capital expenditures. See reconciliation in appendix D ROBUST CASH FLOW AND LOW LEVERAGE SUPPORTING DISCIPLINED FINANCIAL POLICY 4 OPERATING CASH FLOW ($mm)FREE CASH FLOW 1 ($mm)
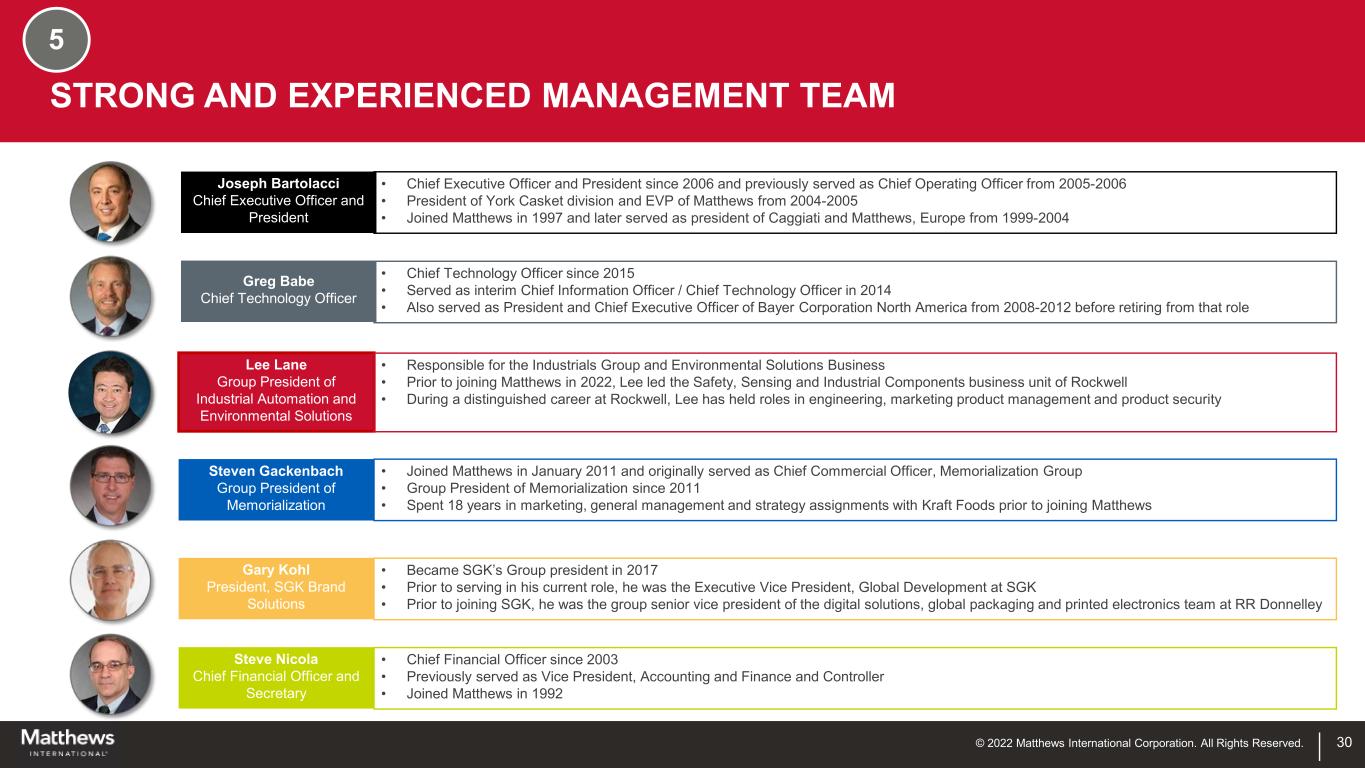
© 2022 Matthews International Corporation. All Rights Reserved. 30 5 STRONG AND EXPERIENCED MANAGEMENT TEAM Joseph Bartolacci Chief Executive Officer and President Greg Babe Chief Technology Officer Lee Lane Group President of Industrial Automation and Environmental Solutions Steven Gackenbach Group President of Memorialization Gary Kohl President, SGK Brand Solutions Steve Nicola Chief Financial Officer and Secretary • Chief Executive Officer and President since 2006 and previously served as Chief Operating Officer from 2005-2006 • President of York Casket division and EVP of Matthews from 2004-2005 • Joined Matthews in 1997 and later served as president of Caggiati and Matthews, Europe from 1999-2004 • Chief Technology Officer since 2015 • Served as interim Chief Information Officer / Chief Technology Officer in 2014 • Also served as President and Chief Executive Officer of Bayer Corporation North America from 2008-2012 before retiring from that role • Responsible for the Industrials Group and Environmental Solutions Business • Prior to joining Matthews in 2022, Lee led the Safety, Sensing and Industrial Components business unit of Rockwell • During a distinguished career at Rockwell, Lee has held roles in engineering, marketing product management and product security • Joined Matthews in January 2011 and originally served as Chief Commercial Officer, Memorialization Group • Group President of Memorialization since 2011 • Spent 18 years in marketing, general management and strategy assignments with Kraft Foods prior to joining Matthews • Became SGK’s Group president in 2017 • Prior to serving in his current role, he was the Executive Vice President, Global Development at SGK • Prior to joining SGK, he was the group senior vice president of the digital solutions, global packaging and printed electronics team at RR Donnelley • Chief Financial Officer since 2003 • Previously served as Vice President, Accounting and Finance and Controller • Joined Matthews in 1992 X
© 2022 Matthews International Corporation. All Rights Reserved. 31 FINANCIAL OVERVIEW
© 2022 Matthews International Corporation. All Rights Reserved. 32 DEBT REDUCTION • Historically maintained a modest leverage profile • Publicly stated Net Debt Leverage Ratio (1) target of 3.0x or less • Continued debt reduction, balanced growth and share repurchase • Approximately $190mm of debt reduction since the beginning of the pandemic through June 30, 2022 • Settled principal U.S. defined benefit plan, reducing the Company’s accrued pension liabilities over $100 million from September 30, 2020 (2) • New receivables purchased agreement entered into during Q2 of FY2022 (reduced debt $100 million as of June 30, 2022) GROWTH – ORGANIC & ACQUISITIONS • Organic: Leverage existing capability in new markets and geographic regions, cost structure improvements, new product development • Recent growth initiatives include (i) Saueressig engineered machines used in electric vehicle battery production, and (ii) new technology in industrial product identification business • Acquisitions: Identify and integrate complementary businesses with prudent capital deployment (achieve long-term annual return on invested capital of at least 12%) SHARE REPURCHASES & DIVIDENDS • Opportunistically repurchase in periods of excess cash flow • Authorization of 1.6 million shares at 06/30/22 • Quarterly dividend of $0.22 per share for FY2022 vs. $0.215 per share for FY2021 FINANCIAL POLICY AND CAPITAL ALLOCATION STRATEGY Note: See Disclaimer (Page 2) for Management’s assessment of supplemental information related to non-GAAP net debt leverage ratio. (1) Non-GAAP net debt leverage ratio is defined as outstanding debt (net of cash) relative to adjusted EBITDA. See reconciliation at Appendix C. (2) Reduction through 6/30/22.
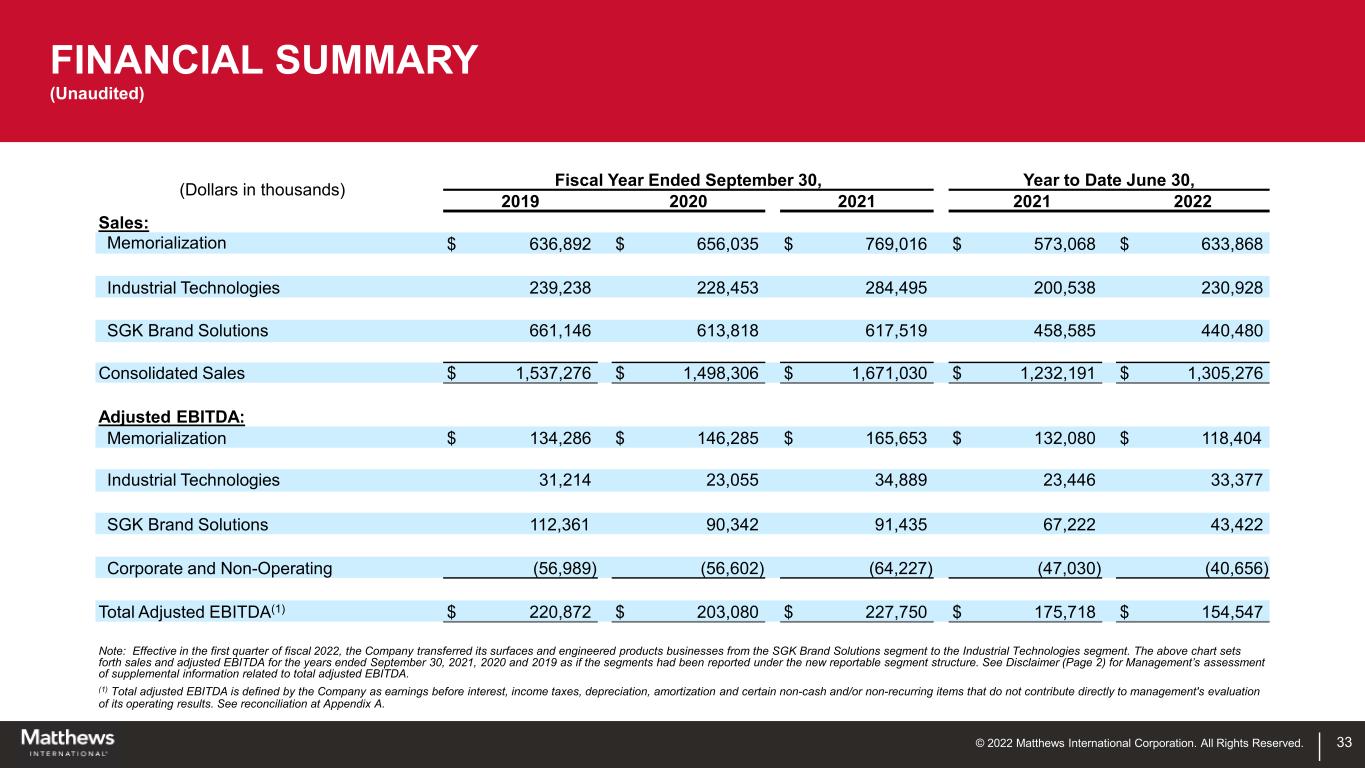
© 2022 Matthews International Corporation. All Rights Reserved. 33 (Dollars in thousands) Fiscal Year Ended September 30, Year to Date June 30, 2019 2020 2021 2021 2022 Sales: Memorialization $ 636,892 $ 656,035 $ 769,016 $ 573,068 $ 633,868 Industrial Technologies 239,238 228,453 284,495 200,538 230,928 SGK Brand Solutions 661,146 613,818 617,519 458,585 440,480 Consolidated Sales $ 1,537,276 $ 1,498,306 $ 1,671,030 $ 1,232,191 $ 1,305,276 Adjusted EBITDA: Memorialization $ 134,286 $ 146,285 $ 165,653 $ 132,080 $ 118,404 Industrial Technologies 31,214 23,055 34,889 23,446 33,377 SGK Brand Solutions 112,361 90,342 91,435 67,222 43,422 Corporate and Non-Operating (56,989) (56,602) (64,227) (47,030) (40,656) Total Adjusted EBITDA(1) $ 220,872 $ 203,080 $ 227,750 $ 175,718 $ 154,547 Note: Effective in the first quarter of fiscal 2022, the Company transferred its surfaces and engineered products businesses from the SGK Brand Solutions segment to the Industrial Technologies segment. The above chart sets forth sales and adjusted EBITDA for the years ended September 30, 2021, 2020 and 2019 as if the segments had been reported under the new reportable segment structure. See Disclaimer (Page 2) for Management’s assessment of supplemental information related to total adjusted EBITDA. (1) Total adjusted EBITDA is defined by the Company as earnings before interest, income taxes, depreciation, amortization and certain non-cash and/or non-recurring items that do not contribute directly to management's evaluation of its operating results. See reconciliation at Appendix A. FINANCIAL SUMMARY (Unaudited)
© 2022 Matthews International Corporation. All Rights Reserved. 34 ESG OVERVIEW
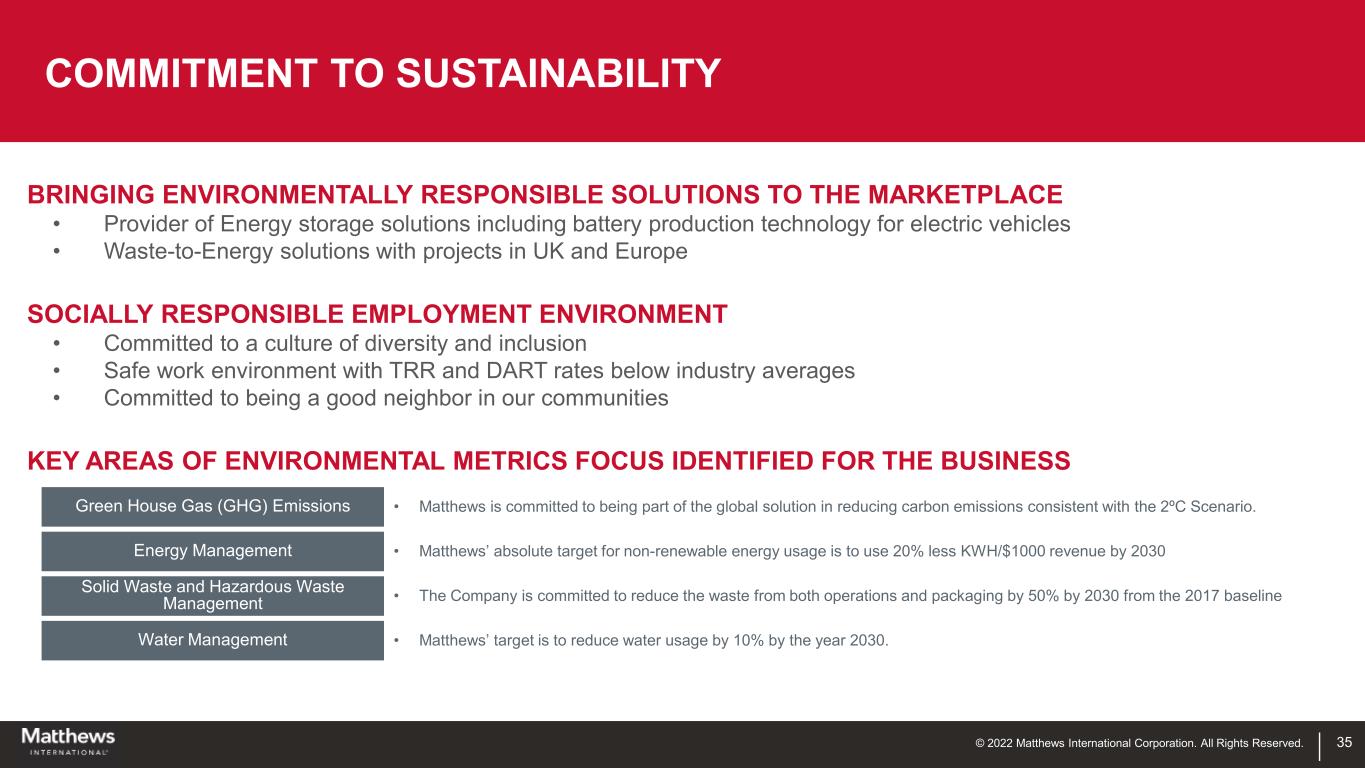
© 2022 Matthews International Corporation. All Rights Reserved. 35 BRINGING ENVIRONMENTALLY RESPONSIBLE SOLUTIONS TO THE MARKETPLACE • Provider of Energy storage solutions including battery production technology for electric vehicles • Waste-to-Energy solutions with projects in UK and Europe SOCIALLY RESPONSIBLE EMPLOYMENT ENVIRONMENT • Committed to a culture of diversity and inclusion • Safe work environment with TRR and DART rates below industry averages • Committed to being a good neighbor in our communities KEY AREAS OF ENVIRONMENTAL METRICS FOCUS IDENTIFIED FOR THE BUSINESS COMMITMENT TO SUSTAINABILITY Green House Gas (GHG) Emissions • Matthews is committed to being part of the global solution in reducing carbon emissions consistent with the 2ºC Scenario. Energy Management • Matthews’ absolute target for non-renewable energy usage is to use 20% less KWH/$1000 revenue by 2030 Solid Waste and Hazardous Waste Management • The Company is committed to reduce the waste from both operations and packaging by 50% by 2030 from the 2017 baseline Water Management • Matthews’ target is to reduce water usage by 10% by the year 2030.
© 2022 Matthews International Corporation. All Rights Reserved. 36 APPENDIX
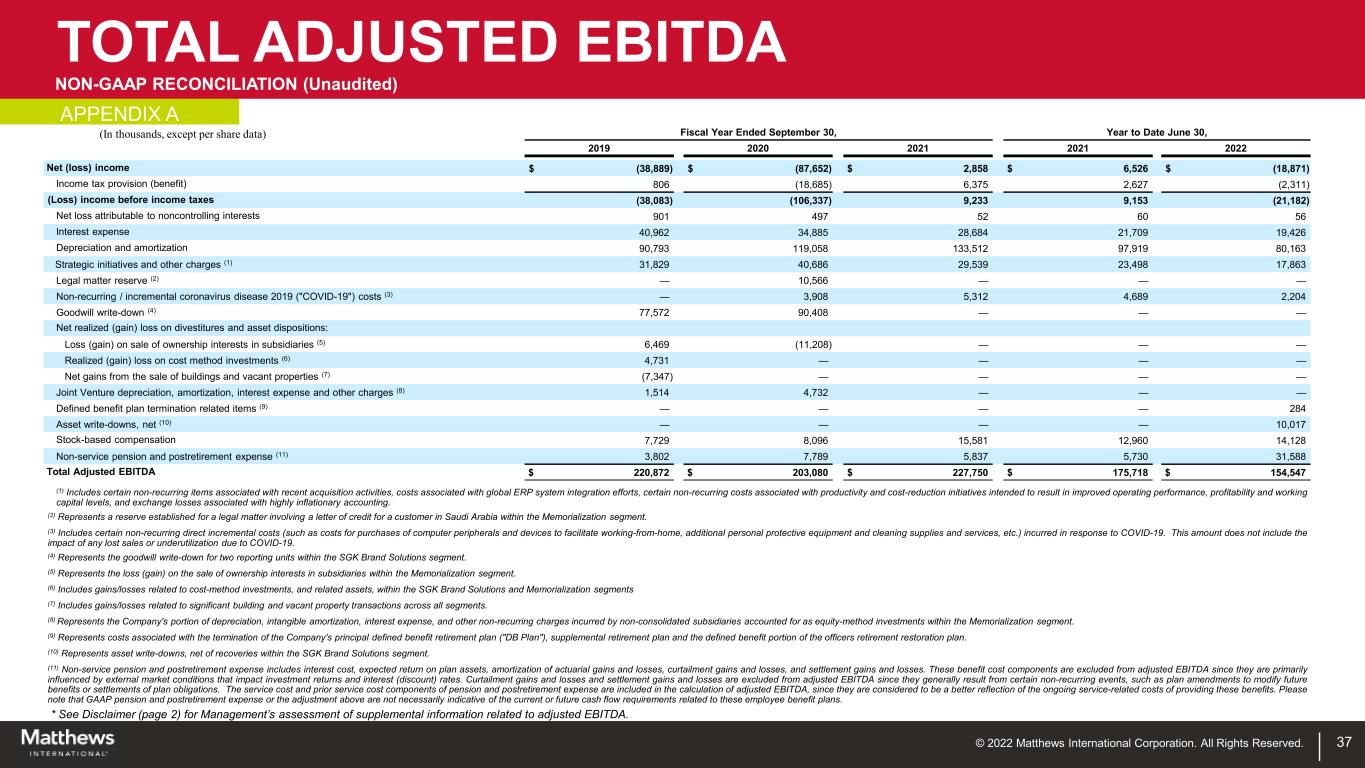
© 2022 Matthews International Corporation. All Rights Reserved. TOTAL ADJUSTED EBITDA NON-GAAP RECONCILIATION (Unaudited) * See Disclaimer (page 2) for Management’s assessment of supplemental information related to adjusted EBITDA. 37 (In thousands, except per share data) Fiscal Year Ended September 30, Year to Date June 30, 2019 2020 2021 2021 2022 Net (loss) income $ (38,889) $ (87,652) $ 2,858 $ 6,526 $ (18,871) Income tax provision (benefit) 806 (18,685) 6,375 2,627 (2,311) (Loss) income before income taxes (38,083) (106,337) 9,233 9,153 (21,182) Net loss attributable to noncontrolling interests 901 497 52 60 56 Interest expense 40,962 34,885 28,684 21,709 19,426 Depreciation and amortization 90,793 119,058 133,512 97,919 80,163 Strategic initiatives and other charges (1) 31,829 40,686 29,539 23,498 17,863 Legal matter reserve (2) — 10,566 — — — Non-recurring / incremental coronavirus disease 2019 ("COVID-19") costs (3) — 3,908 5,312 4,689 2,204 Goodwill write-down (4) 77,572 90,408 — — — Net realized (gain) loss on divestitures and asset dispositions: Loss (gain) on sale of ownership interests in subsidiaries (5) 6,469 (11,208) — — — Realized (gain) loss on cost method investments (6) 4,731 — — — — Net gains from the sale of buildings and vacant properties (7) (7,347) — — — — Joint Venture depreciation, amortization, interest expense and other charges (8) 1,514 4,732 — — — Defined benefit plan termination related items (9) — — — — 284 Asset write-downs, net (10) — — — — 10,017 Stock-based compensation 7,729 8,096 15,581 12,960 14,128 Non-service pension and postretirement expense (11) 3,802 7,789 5,837 5,730 31,588 Total Adjusted EBITDA $ 220,872 $ 203,080 $ 227,750 $ 175,718 $ 154,547 (1) Includes certain non-recurring items associated with recent acquisition activities, costs associated with global ERP system integration efforts, certain non-recurring costs associated with productivity and cost-reduction initiatives intended to result in improved operating performance, profitability and working capital levels, and exchange losses associated with highly inflationary accounting. (2) Represents a reserve established for a legal matter involving a letter of credit for a customer in Saudi Arabia within the Memorialization segment. (3) Includes certain non-recurring direct incremental costs (such as costs for purchases of computer peripherals and devices to facilitate working-from-home, additional personal protective equipment and cleaning supplies and services, etc.) incurred in response to COVID-19. This amount does not include the impact of any lost sales or underutilization due to COVID-19. (4) Represents the goodwill write-down for two reporting units within the SGK Brand Solutions segment. (5) Represents the loss (gain) on the sale of ownership interests in subsidiaries within the Memorialization segment. (6) Includes gains/losses related to cost-method investments, and related assets, within the SGK Brand Solutions and Memorialization segments (7) Includes gains/losses related to significant building and vacant property transactions across all segments. (8) Represents the Company's portion of depreciation, intangible amortization, interest expense, and other non-recurring charges incurred by non-consolidated subsidiaries accounted for as equity-method investments within the Memorialization segment. (9) Represents costs associated with the termination of the Company's principal defined benefit retirement plan ("DB Plan"), supplemental retirement plan and the defined benefit portion of the officers retirement restoration plan. (10) Represents asset write-downs, net of recoveries within the SGK Brand Solutions segment. (11) Non-service pension and postretirement expense includes interest cost, expected return on plan assets, amortization of actuarial gains and losses, curtailment gains and losses, and settlement gains and losses. These benefit cost components are excluded from adjusted EBITDA since they are primarily influenced by external market conditions that impact investment returns and interest (discount) rates. Curtailment gains and losses and settlement gains and losses are excluded from adjusted EBITDA since they generally result from certain non-recurring events, such as plan amendments to modify future benefits or settlements of plan obligations. The service cost and prior service cost components of pension and postretirement expense are included in the calculation of adjusted EBITDA, since they are considered to be a better reflection of the ongoing service-related costs of providing these benefits. Please note that GAAP pension and postretirement expense or the adjustment above are not necessarily indicative of the current or future cash flow requirements related to these employee benefit plans. APPENDIX A
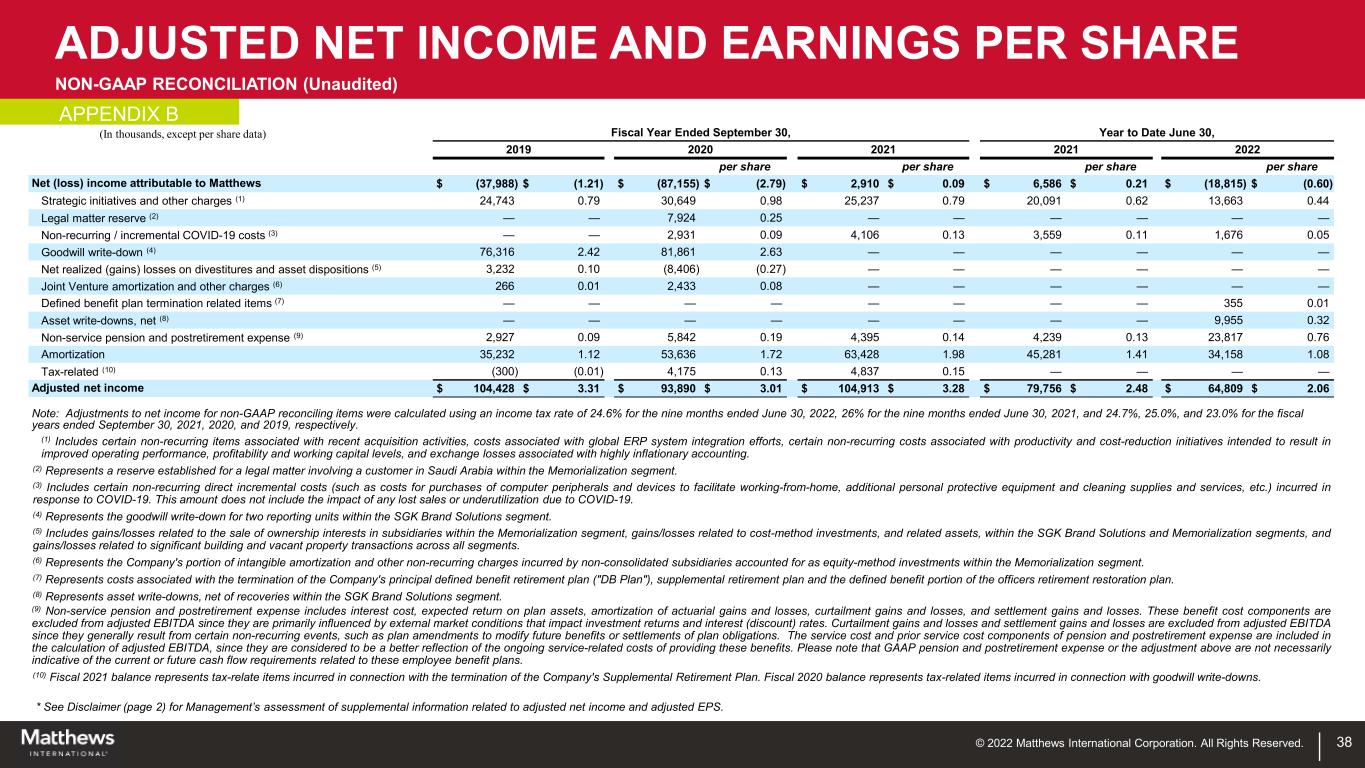
© 2022 Matthews International Corporation. All Rights Reserved. ADJUSTED NET INCOME AND EARNINGS PER SHARE NON-GAAP RECONCILIATION (Unaudited) * See Disclaimer (page 2) for Management’s assessment of supplemental information related to adjusted net income and adjusted EPS. 38 (In thousands, except per share data) Fiscal Year Ended September 30, Year to Date June 30, 2019 2020 2021 2021 2022 per share per share per share per share Net (loss) income attributable to Matthews $ (37,988) $ (1.21) $ (87,155) $ (2.79) $ 2,910 $ 0.09 $ 6,586 $ 0.21 $ (18,815) $ (0.60) Strategic initiatives and other charges (1) 24,743 0.79 30,649 0.98 25,237 0.79 20,091 0.62 13,663 0.44 Legal matter reserve (2) — — 7,924 0.25 — — — — — — Non-recurring / incremental COVID-19 costs (3) — — 2,931 0.09 4,106 0.13 3,559 0.11 1,676 0.05 Goodwill write-down (4) 76,316 2.42 81,861 2.63 — — — — — — Net realized (gains) losses on divestitures and asset dispositions (5) 3,232 0.10 (8,406) (0.27) — — — — — — Joint Venture amortization and other charges (6) 266 0.01 2,433 0.08 — — — — — — Defined benefit plan termination related items (7) — — — — — — — — 355 0.01 Asset write-downs, net (8) — — — — — — — — 9,955 0.32 Non-service pension and postretirement expense (9) 2,927 0.09 5,842 0.19 4,395 0.14 4,239 0.13 23,817 0.76 Amortization 35,232 1.12 53,636 1.72 63,428 1.98 45,281 1.41 34,158 1.08 Tax-related (10) (300) (0.01) 4,175 0.13 4,837 0.15 — — — — Adjusted net income $ 104,428 $ 3.31 $ 93,890 $ 3.01 $ 104,913 $ 3.28 $ 79,756 $ 2.48 $ 64,809 $ 2.06 Note: Adjustments to net income for non-GAAP reconciling items were calculated using an income tax rate of 24.6% for the nine months ended June 30, 2022, 26% for the nine months ended June 30, 2021, and 24.7%, 25.0%, and 23.0% for the fiscal years ended September 30, 2021, 2020, and 2019, respectively. (1) Includes certain non-recurring items associated with recent acquisition activities, costs associated with global ERP system integration efforts, certain non-recurring costs associated with productivity and cost-reduction initiatives intended to result in improved operating performance, profitability and working capital levels, and exchange losses associated with highly inflationary accounting. (2) Represents a reserve established for a legal matter involving a customer in Saudi Arabia within the Memorialization segment. (3) Includes certain non-recurring direct incremental costs (such as costs for purchases of computer peripherals and devices to facilitate working-from-home, additional personal protective equipment and cleaning supplies and services, etc.) incurred in response to COVID-19. This amount does not include the impact of any lost sales or underutilization due to COVID-19. (4) Represents the goodwill write-down for two reporting units within the SGK Brand Solutions segment. (5) Includes gains/losses related to the sale of ownership interests in subsidiaries within the Memorialization segment, gains/losses related to cost-method investments, and related assets, within the SGK Brand Solutions and Memorialization segments, and gains/losses related to significant building and vacant property transactions across all segments. (6) Represents the Company's portion of intangible amortization and other non-recurring charges incurred by non-consolidated subsidiaries accounted for as equity-method investments within the Memorialization segment. (7) Represents costs associated with the termination of the Company's principal defined benefit retirement plan ("DB Plan"), supplemental retirement plan and the defined benefit portion of the officers retirement restoration plan. (8) Represents asset write-downs, net of recoveries within the SGK Brand Solutions segment. (9) Non-service pension and postretirement expense includes interest cost, expected return on plan assets, amortization of actuarial gains and losses, curtailment gains and losses, and settlement gains and losses. These benefit cost components are excluded from adjusted EBITDA since they are primarily influenced by external market conditions that impact investment returns and interest (discount) rates. Curtailment gains and losses and settlement gains and losses are excluded from adjusted EBITDA since they generally result from certain non-recurring events, such as plan amendments to modify future benefits or settlements of plan obligations. The service cost and prior service cost components of pension and postretirement expense are included in the calculation of adjusted EBITDA, since they are considered to be a better reflection of the ongoing service-related costs of providing these benefits. Please note that GAAP pension and postretirement expense or the adjustment above are not necessarily indicative of the current or future cash flow requirements related to these employee benefit plans. (10) Fiscal 2021 balance represents tax-relate items incurred in connection with the termination of the Company's Supplemental Retirement Plan. Fiscal 2020 balance represents tax-related items incurred in connection with goodwill write-downs. APPENDIX B
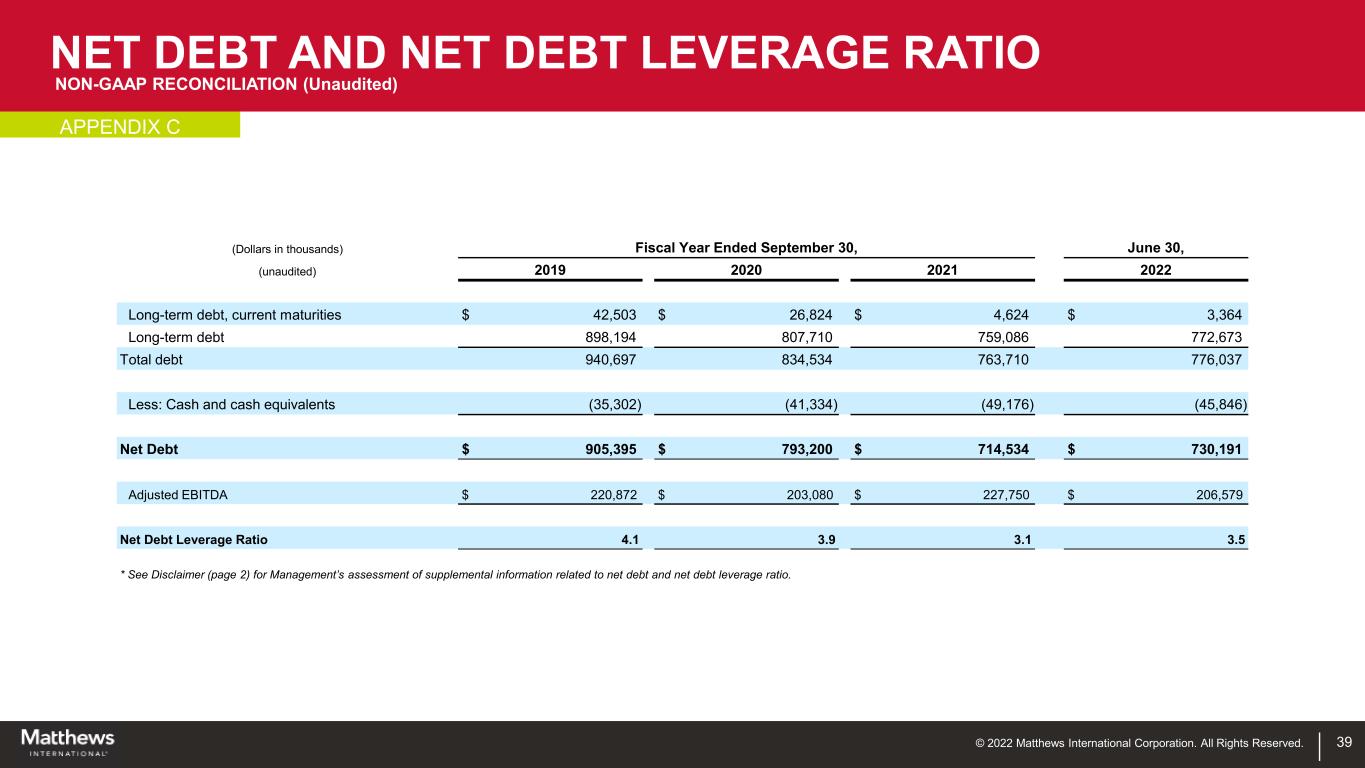
© 2022 Matthews International Corporation. All Rights Reserved. 39 (Dollars in thousands) Fiscal Year Ended September 30, June 30, (unaudited) 2019 2020 2021 2022 Long-term debt, current maturities $ 42,503 $ 26,824 $ 4,624 $ 3,364 Long-term debt 898,194 807,710 759,086 772,673 Total debt 940,697 834,534 763,710 776,037 Less: Cash and cash equivalents (35,302) (41,334) (49,176) (45,846) Net Debt $ 905,395 $ 793,200 $ 714,534 $ 730,191 Adjusted EBITDA $ 220,872 $ 203,080 $ 227,750 $ 206,579 Net Debt Leverage Ratio 4.1 3.9 3.1 3.5 * See Disclaimer (page 2) for Management’s assessment of supplemental information related to net debt and net debt leverage ratio. NET DEBT AND NET DEBT LEVERAGE RATIO APPENDIX C NON-GAAP RECONCILIATION (Unaudited)
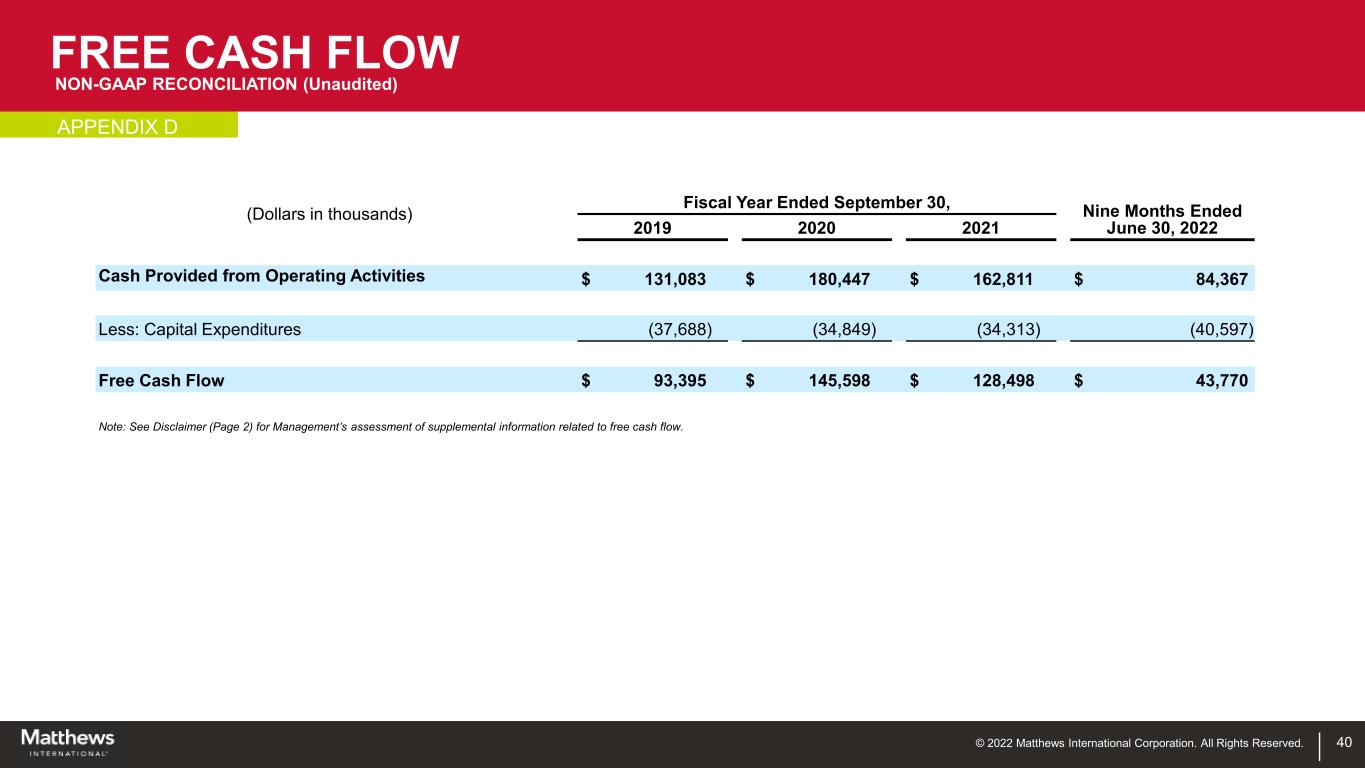
© 2022 Matthews International Corporation. All Rights Reserved. 40 (Dollars in thousands) Fiscal Year Ended September 30, Nine Months Ended June 30, 20222019 2020 2021 Cash Provided from Operating Activities $ 131,083 $ 180,447 $ 162,811 $ 84,367 Less: Capital Expenditures (37,688) (34,849) (34,313) (40,597) Free Cash Flow $ 93,395 $ 145,598 $ 128,498 $ 43,770 Note: See Disclaimer (Page 2) for Management’s assessment of supplemental information related to free cash flow. FREE CASH FLOW APPENDIX D NON-GAAP RECONCILIATION (Unaudited)
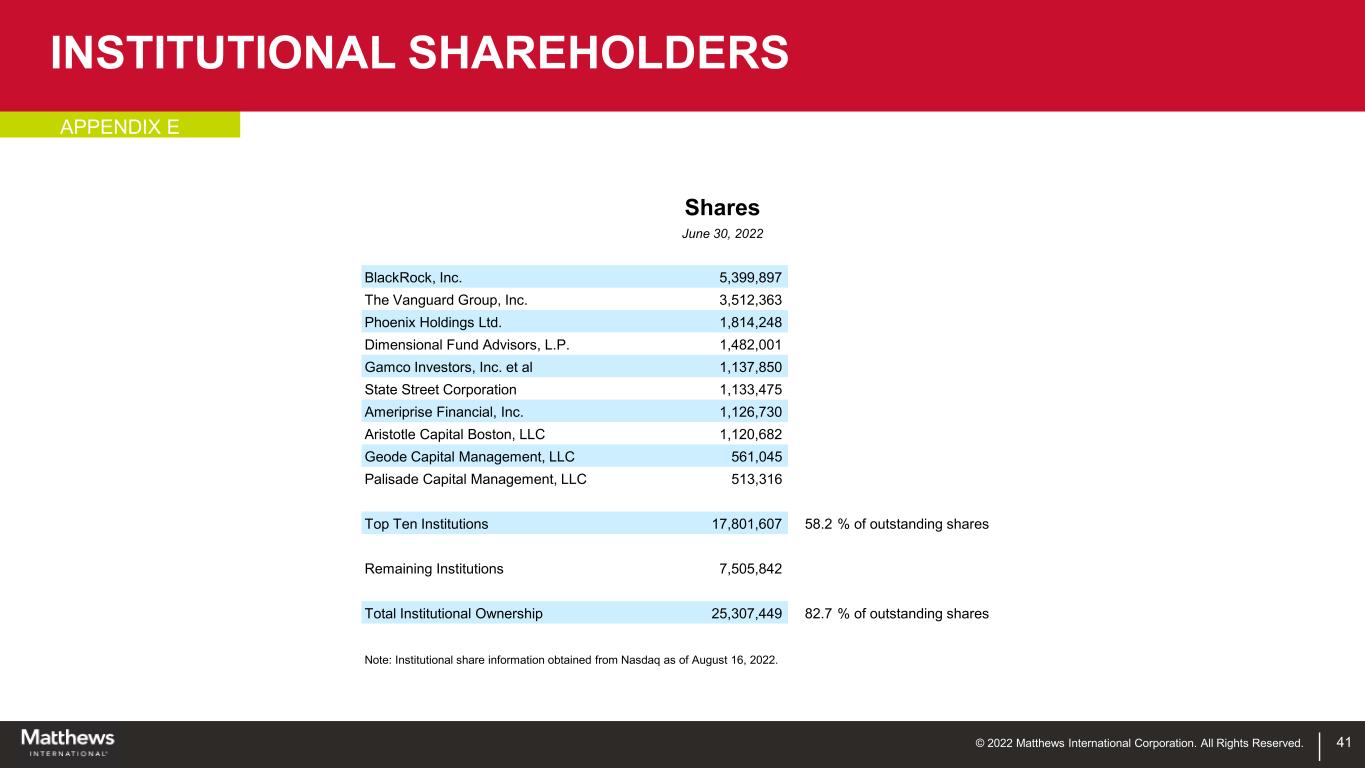
© 2022 Matthews International Corporation. All Rights Reserved. 41 Shares June 30, 2022 BlackRock, Inc. 5,399,897 The Vanguard Group, Inc. 3,512,363 Phoenix Holdings Ltd. 1,814,248 Dimensional Fund Advisors, L.P. 1,482,001 Gamco Investors, Inc. et al 1,137,850 State Street Corporation 1,133,475 Ameriprise Financial, Inc. 1,126,730 Aristotle Capital Boston, LLC 1,120,682 Geode Capital Management, LLC 561,045 Palisade Capital Management, LLC 513,316 Top Ten Institutions 17,801,607 58.2 % of outstanding shares Remaining Institutions 7,505,842 Total Institutional Ownership 25,307,449 82.7 % of outstanding shares Note: Institutional share information obtained from Nasdaq as of August 16, 2022. INSTITUTIONAL SHAREHOLDERS APPENDIX E
© 2022 Matthews International Corporation. All Rights Reserved.