www.matw.com | Nasdaq: MATW © 2023 Matthews International Corporation. All Rights Reserved. CORPORATE PRESENTATION September 30, 2023
© 2023 Matthews International Corporation. All Rights Reserved. DISCLAIMER 2 Any forward-looking statements contained in this presentation are included pursuant to the “safe harbor” provisions of the Private Securities Litigation Reform Act of 1995. These forward-looking statements include, but are not limited to, statements regarding the expectations, hopes, beliefs, intentions or strategies of the Company regarding the future, and may be identified by the use of words such as “expects,” “believes,” “intends,” “projects,” “anticipates,” estimates,” “plans,” “seeks,” “forecasts,” “predicts,” “objective,” “targets,” “potential,” “outlook,” “may,” “will,” “could” or the negative of these terms, other comparable terminology and variations thereof. Such forward-looking statements involve known and unknown risks and uncertainties that may cause the Company’s actual results in future periods to be materially different from management’s expectations, and no assurance can be given that such expectations will prove correct. Factors that could cause the Company's results to differ materially from the results discussed in such forward-looking statements principally include changes in domestic or international economic conditions, changes in foreign currency exchange rates, changes in interest rates, changes in the cost of materials used in the manufacture of the Company's products, any impairment of goodwill or intangible assets, environmental liability and limitations on the Company’s operations due to environmental laws and regulations, disruptions to certain services, such as telecommunications, network server maintenance, cloud computing or transaction processing services, provided to the Company by third-parties, changes in mortality and cremation rates, changes in product demand or pricing as a result of consolidation in the industries in which the Company operates, or other factors such as supply chain disruptions, labor shortages or labor cost increases, changes in product demand or pricing as a result of domestic or international competitive pressures, ability to achieve cost-reduction objectives, unknown risks in connection with the Company's acquisitions and divestitures, cybersecurity concerns and costs arising with management of cybersecurity threats, effectiveness of the Company's internal controls, compliance with domestic and foreign laws and regulations, technological factors beyond the Company's control, impact of pandemics or similar outbreaks, or other disruptions to our industries, customers, or supply chains, the impact of global conflicts, such as the current war between Russia and Ukraine, and other factors described in the Company’s Annual Report on Form 10-K and other periodic filings with the U.S. Securities and Exchange Commission. The information contained in this presentation, including any financial data, is made as of September 30, 2023 unless otherwise noted. The Company does not, and is not obligated to, update this information after the date of such information. Included in this report are measures of financial performance that are not defined by generally accepted accounting principles in the United States (“GAAP”). The Company uses non-GAAP financial measures to assist in comparing its performance on a consistent basis for purposes of business decision-making by removing the impact of certain items that management believes do not directly reflect the Company’s core operations including acquisition and divestiture costs, ERP integration costs, strategic initiative and other charges (which includes non-recurring charges related to certain commercial and operational initiatives and exit activities), stock-based compensation and the non-service portion of pension and postretirement expense. Management believes that presenting non-GAAP financial measures is useful to investors because it (i) provides investors with meaningful supplemental information regarding financial performance by excluding certain items that management believes do not directly reflect the Company’s core operations, (ii) permits investors to view performance using the same tools that management uses to budget, forecast, make operating and strategic decisions, and evaluate historical performance, and (iii) otherwise provides supplemental information that may be useful to investors in evaluating the Company’s results. The Company believes that the presentation of these non-GAAP financial measures, when considered together with the corresponding GAAP financial measures and the reconciliations to those measures, provided herein, provides investors with an additional understanding of the factors and trends affecting the Company’s business that could not be obtained absent these disclosures. The Company believes that adjusted EBITDA provides relevant and useful information, which is used by the Company’s management in assessing the performance of its business. Adjusted EBITDA is defined by the Company as earnings before interest, income taxes, depreciation, amortization and certain non-cash and/or non-recurring items that do not contribute directly to management’s evaluation of its operating results. These items include stock-based compensation, the non-service portion of pension and postretirement expense, acquisition and divestiture costs, ERP integration costs, and strategic initiatives and other charges. Adjusted EBITDA provides the Company with an understanding of earnings before the impact of investing and financing charges and income taxes, and the effects of certain acquisition, divestiture and ERP integration costs, and items that do not reflect the ordinary earnings of the Company’s operations. This measure may be useful to an investor in evaluating operating performance. It is also useful as a financial measure for lenders and is used by the Company’s management to measure business performance. Adjusted EBITDA is not a measure of the Company's financial performance under GAAP and should not be considered as an alternative to net income or other performance measures derived in accordance with GAAP, or as an alternative to cash flow from operating activities as a measure of the Company's liquidity. The Company's definition of adjusted EBITDA may not be comparable to similarly titled measures used by other companies. The Company has presented constant currency sales and constant currency adjusted EBITDA and believes these measures provide relevant and useful information, which is used by the Company's management in assessing the performance of its business on a consistent basis by removing the impact of changes due to foreign exchange translation rates. These measures allow management, as well as investors, to assess the Company’s sales and adjusted EBITDA on a constant currency basis. The Company has also presented adjusted net income and adjusted earnings per share and believes each measure provides relevant and useful information, which is widely used by analysts and investors, as well as by the Company’s management in assessing the performance of its business. Adjusted net income and adjusted earnings per share provides the Company with an understanding of the results from the primary operations of our business by excluding the effects of certain acquisition, divestiture and system-integration costs, and items that do not reflect the ordinary earnings of our operations. These measures provide management with insight into the earning value for shareholders excluding certain costs, not related to the Company’s primary operations. Likewise, these measures may be useful to an investor in evaluating the underlying operating performance of the Company’s business overall, as well as performance trends, on a consistent basis. The Company has also presented net debt and a net debt leverage ratio and believes each measure provides relevant and useful information, which is widely used by analysts and investors as well as by our management. These measures provide management with insight on the indebtedness of the Company, net of cash and cash equivalents and relative to adjusted EBITDA. These measures allow management, as well as analysts and investors, to assess the Company’s leverage.. Lastly, the Company has presented free cash flow as supplemental measures of cash flow that are not required by, or presented in accordance with, GAAP. Management believes that these measures provide relevant and useful information, which is widely used by analysts and investors as well as by our management. These measures provide management with insight on the cash generated by operations, excluding capital expenditures. These measures allows management, as well as analysts and investors, to assess the Company’s ability to pursue growth and investment opportunities designed to increase Shareholder value.
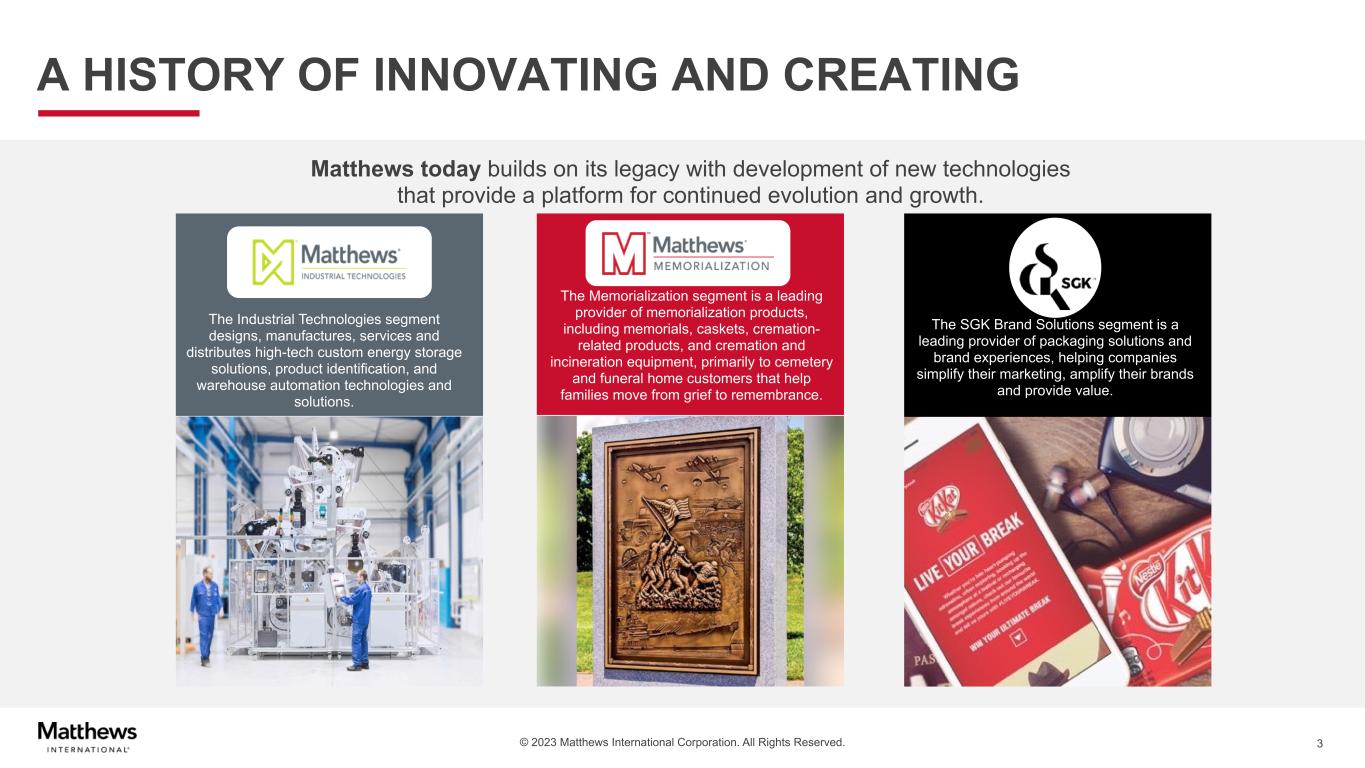
© 2023 Matthews International Corporation. All Rights Reserved. A HISTORY OF INNOVATING AND CREATING Matthews today builds on its legacy with development of new technologies that provide a platform for continued evolution and growth. 3 The SGK Brand Solutions segment is a leading provider of packaging solutions and brand experiences, helping companies simplify their marketing, amplify their brands and provide value. The Memorialization segment is a leading provider of memorialization products, including memorials, caskets, cremation- related products, and cremation and incineration equipment, primarily to cemetery and funeral home customers that help families move from grief to remembrance. The Industrial Technologies segment designs, manufactures, services and distributes high-tech custom energy storage solutions, product identification, and warehouse automation technologies and solutions.
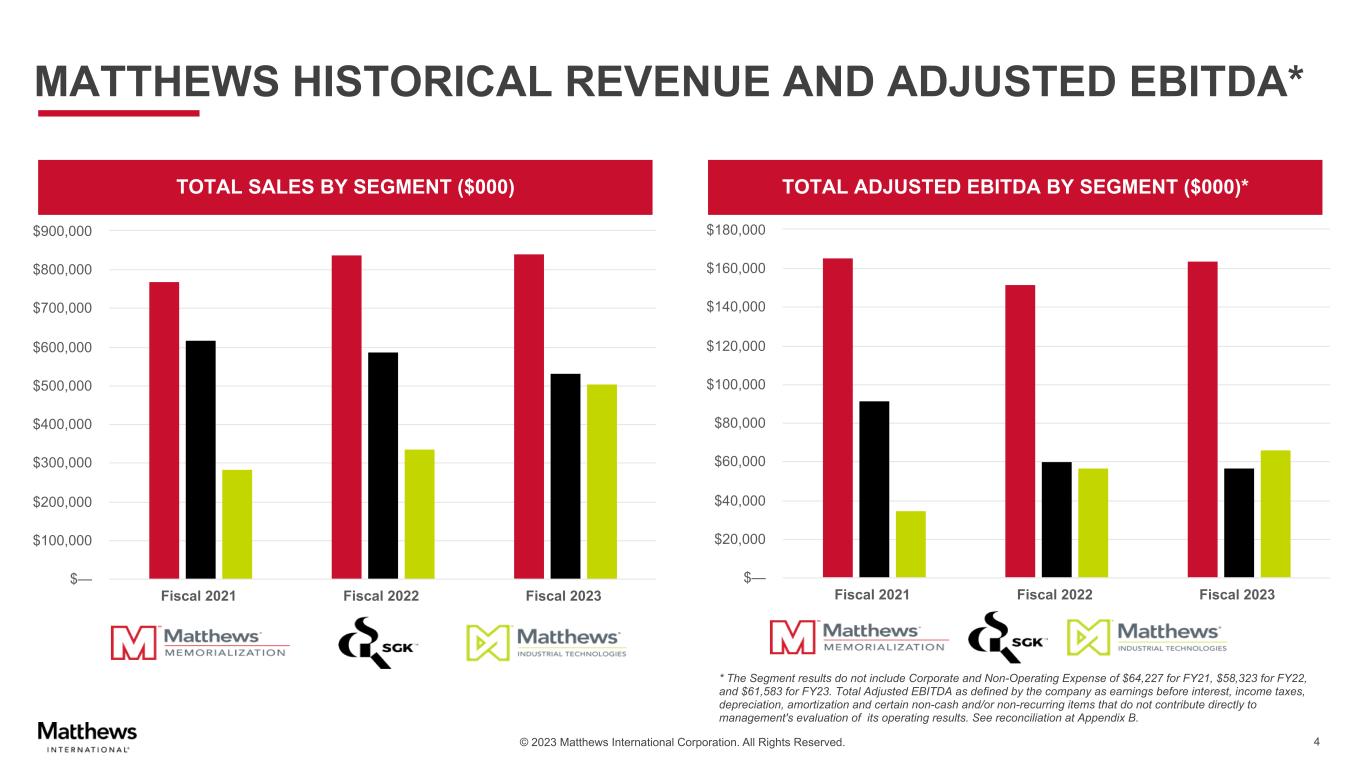
© 2023 Matthews International Corporation. All Rights Reserved. 4 * The Segment results do not include Corporate and Non-Operating Expense of $64,227 for FY21, $58,323 for FY22, and $61,583 for FY23. Total Adjusted EBITDA as defined by the company as earnings before interest, income taxes, depreciation, amortization and certain non-cash and/or non-recurring items that do not contribute directly to management's evaluation of its operating results. See reconciliation at Appendix B. MATTHEWS HISTORICAL REVENUE AND ADJUSTED EBITDA* TOTAL SALES BY SEGMENT ($000) TOTAL ADJUSTED EBITDA BY SEGMENT ($000)* Fiscal 2021 Fiscal 2022 Fiscal 2023 $— $100,000 $200,000 $300,000 $400,000 $500,000 $600,000 $700,000 $800,000 $900,000 Fiscal 2021 Fiscal 2022 Fiscal 2023 $— $20,000 $40,000 $60,000 $80,000 $100,000 $120,000 $140,000 $160,000 $180,000
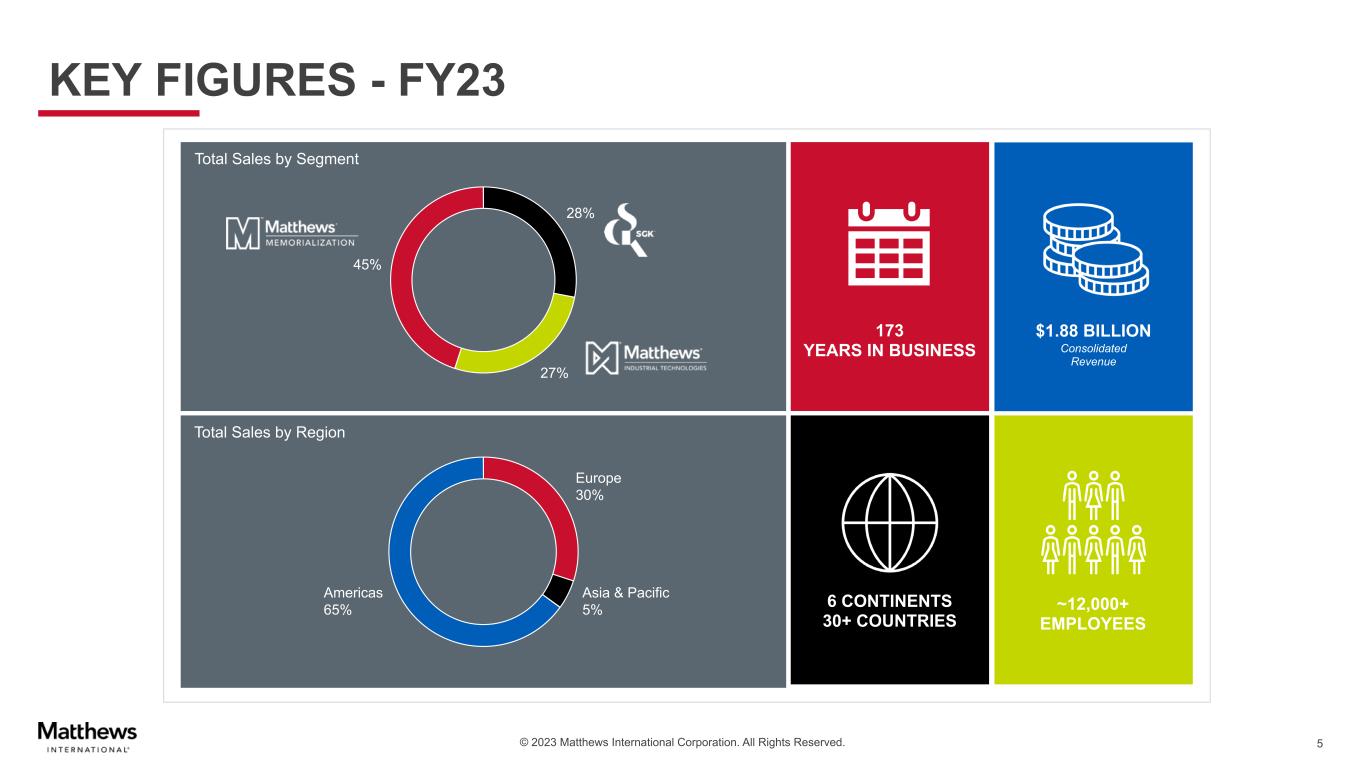
© 2023 Matthews International Corporation. All Rights Reserved. KEY FIGURES - FY23 5 173 YEARS IN BUSINESS $1.88 BILLION Consolidated Revenue 6 CONTINENTS 30+ COUNTRIES Total Sales by Region Total Sales by Segment ~12,000+ EMPLOYEES 28% 27% 45% Europe 30% Asia & Pacific 5% Americas 65%
© 2023 Matthews International Corporation. All Rights Reserved. INDUSTRIAL TECHNOLOGIES
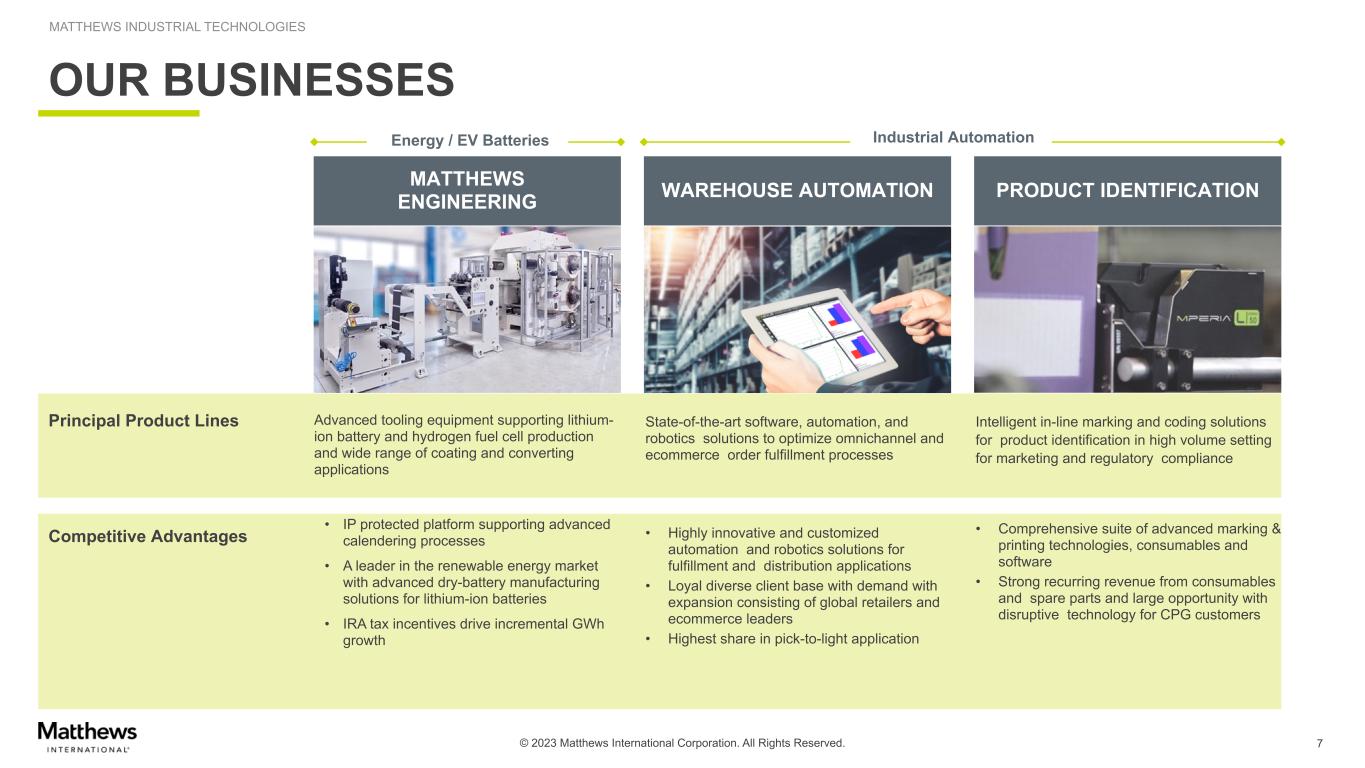
© 2023 Matthews International Corporation. All Rights Reserved. MATTHEWS INDUSTRIAL TECHNOLOGIES OUR BUSINESSES 7 MATTHEWS ENGINEERING WAREHOUSE AUTOMATION PRODUCT IDENTIFICATION Principal Product Lines Competitive Advantages • IP protected platform supporting advanced calendering processes • A leader in the renewable energy market with advanced dry-battery manufacturing solutions for lithium-ion batteries • IRA tax incentives drive incremental GWh growth Industrial AutomationEnergy / EV Batteries Advanced tooling equipment supporting lithium- ion battery and hydrogen fuel cell production and wide range of coating and converting applications State-of-the-art software, automation, and robotics solutions to optimize omnichannel and ecommerce order fulfillment processes Intelligent in-line marking and coding solutions for product identification in high volume setting for marketing and regulatory compliance • Highly innovative and customized automation and robotics solutions for fulfillment and distribution applications • Loyal diverse client base with demand with expansion consisting of global retailers and ecommerce leaders • Highest share in pick-to-light application • Comprehensive suite of advanced marking & printing technologies, consumables and software • Strong recurring revenue from consumables and spare parts and large opportunity with disruptive technology for CPG customers
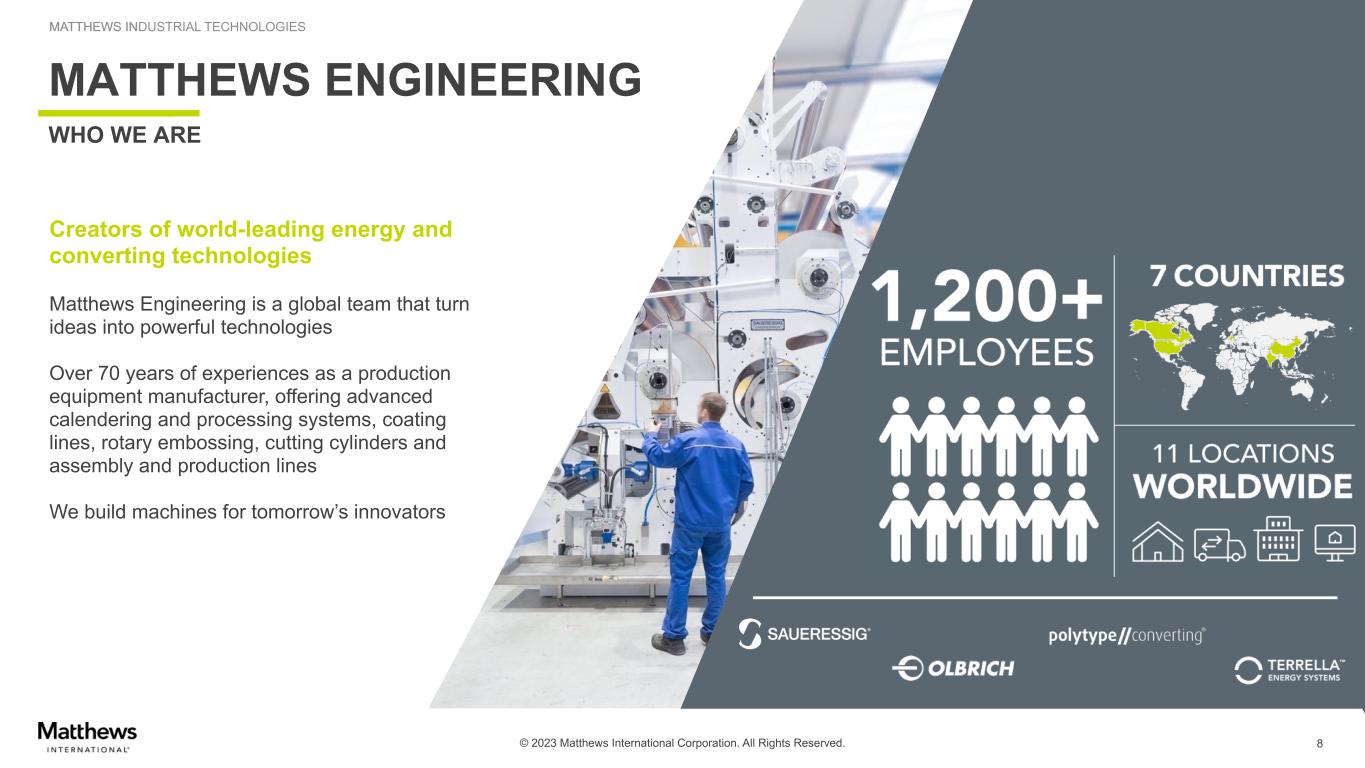
© 2023 Matthews International Corporation. All Rights Reserved. MATTHEWS INDUSTRIAL TECHNOLOGIES MATTHEWS ENGINEERING WHO WE ARE 8 Creators of world-leading energy and converting technologies Matthews Engineering is a global team that turn ideas into powerful technologies Over 70 years of experiences as a production equipment manufacturer, offering advanced calendering and processing systems, coating lines, rotary embossing, cutting cylinders and assembly and production lines We build machines for tomorrow’s innovators
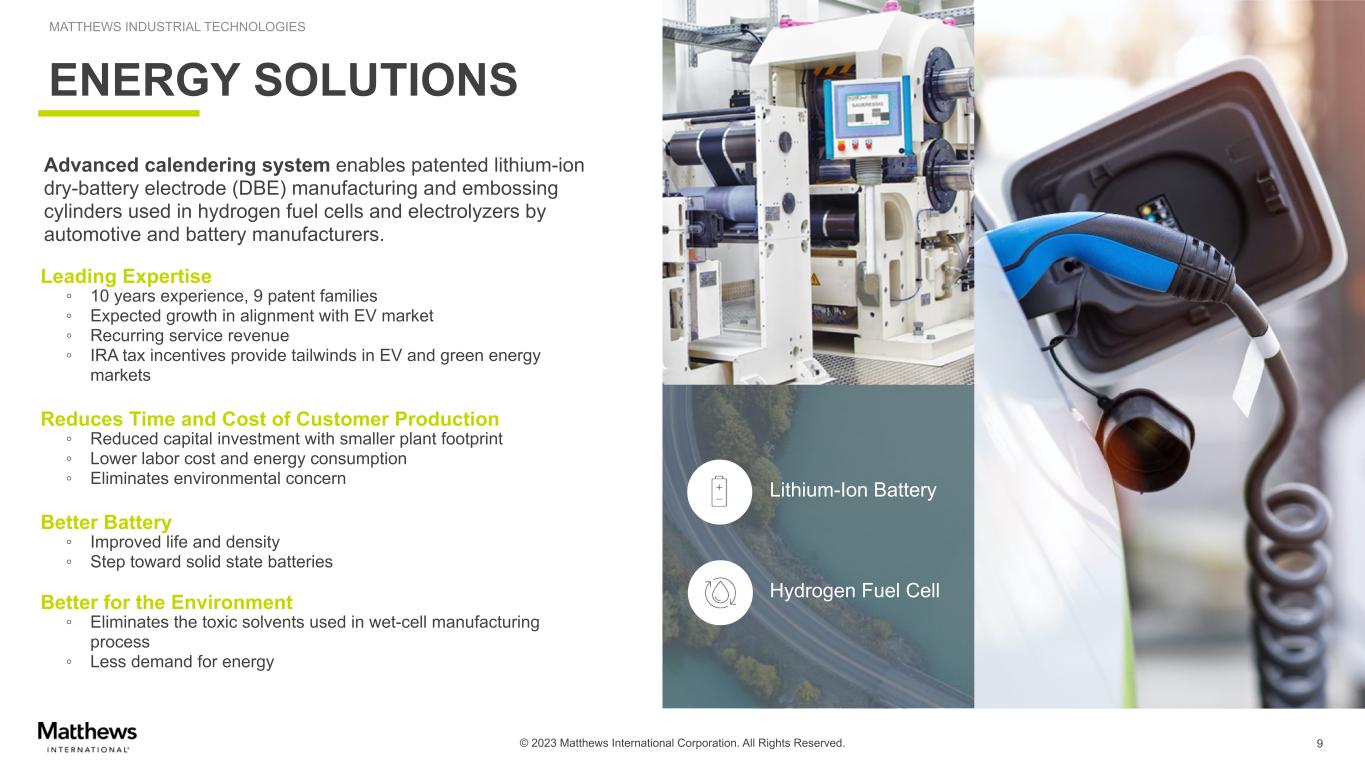
© 2023 Matthews International Corporation. All Rights Reserved. MATTHEWS INDUSTRIAL TECHNOLOGIES ENERGY SOLUTIONS 9 Advanced calendering system enables patented lithium-ion dry-battery electrode (DBE) manufacturing and embossing cylinders used in hydrogen fuel cells and electrolyzers by automotive and battery manufacturers. Lithium-Ion Battery Hydrogen Fuel Cell Leading Expertise ◦ 10 years experience, 9 patent families ◦ Expected growth in alignment with EV market ◦ Recurring service revenue ◦ IRA tax incentives provide tailwinds in EV and green energy markets Reduces Time and Cost of Customer Production ◦ Reduced capital investment with smaller plant footprint ◦ Lower labor cost and energy consumption ◦ Eliminates environmental concern Better Battery ◦ Improved life and density ◦ Step toward solid state batteries Better for the Environment ◦ Eliminates the toxic solvents used in wet-cell manufacturing process ◦ Less demand for energy
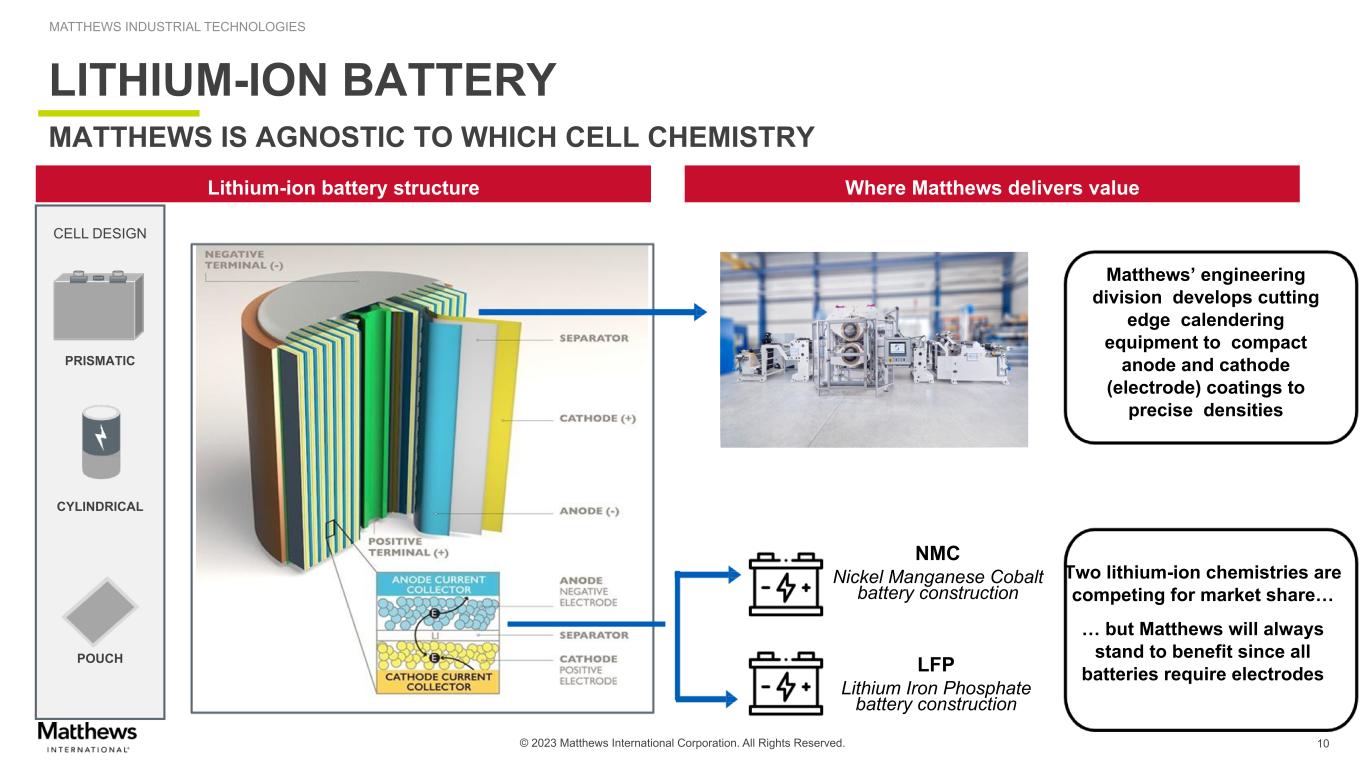
© 2023 Matthews International Corporation. All Rights Reserved. MATTHEWS INDUSTRIAL TECHNOLOGIES LITHIUM-ION BATTERY CELL DESIGN PRISMATIC CYLINDRICAL POUCH MATTHEWS IS AGNOSTIC TO WHICH CELL CHEMISTRY 10 Lithium-ion battery structure Where Matthews delivers value Matthews’ engineering division develops cutting edge calendering equipment to compact anode and cathode (electrode) coatings to precise densities NMC Nickel Manganese Cobalt battery construction Two lithium-ion chemistries are competing for market share… … but Matthews will always stand to benefit since all batteries require electrodesLFP Lithium Iron Phosphate battery construction 10
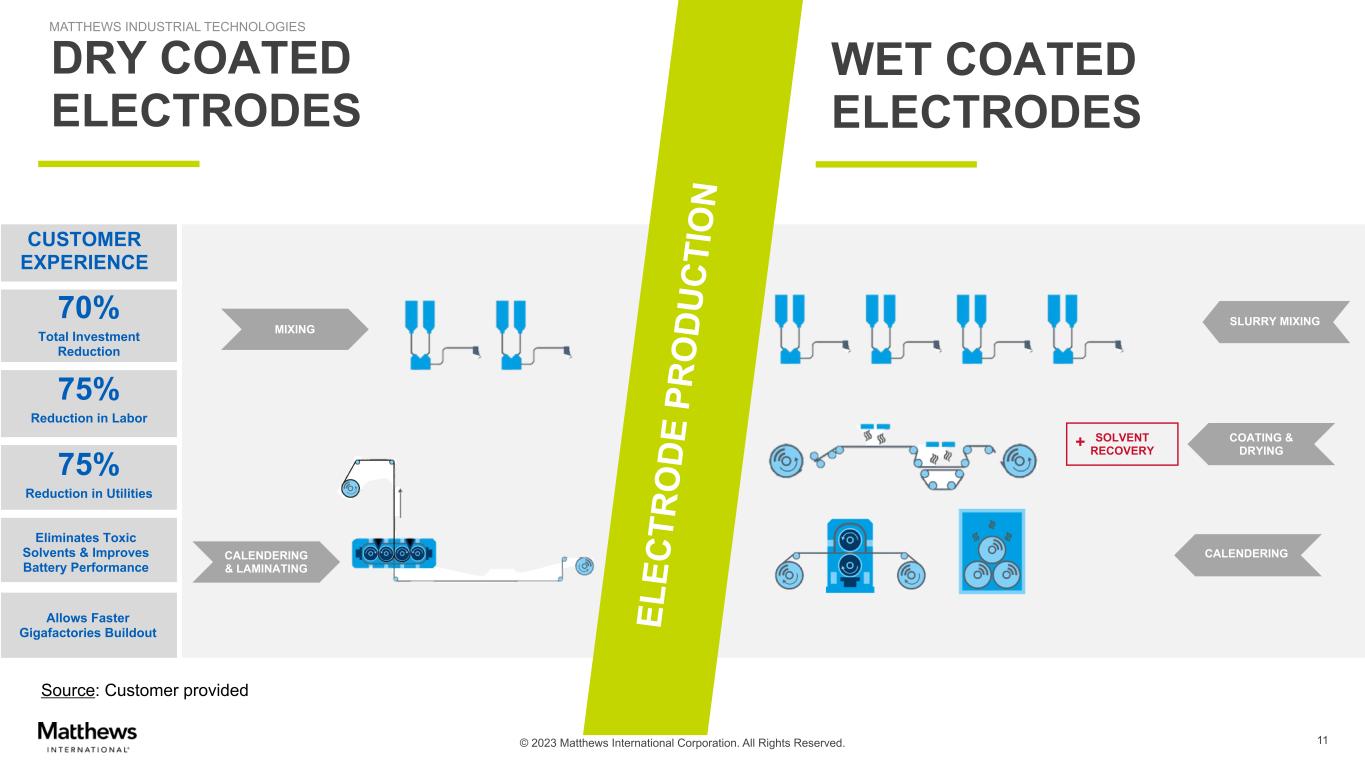
© 2023 Matthews International Corporation. All Rights Reserved. SOLVENT RECOVERY+ 11 MIXING CALENDERING & LAMINATING EL EC TR O D E PR O D U C TI O N DRY COATED ELECTRODES WET COATED ELECTRODES MATTHEWS INDUSTRIAL TECHNOLOGIES 75% Reduction in Utilities Eliminates Toxic Solvents & Improves Battery Performance 75% Reduction in Labor 70% Total Investment Reduction Allows Faster Gigafactories Buildout Source: Customer provided CUSTOMER EXPERIENCE SLURRY MIXING COATING & DRYING CALENDERING
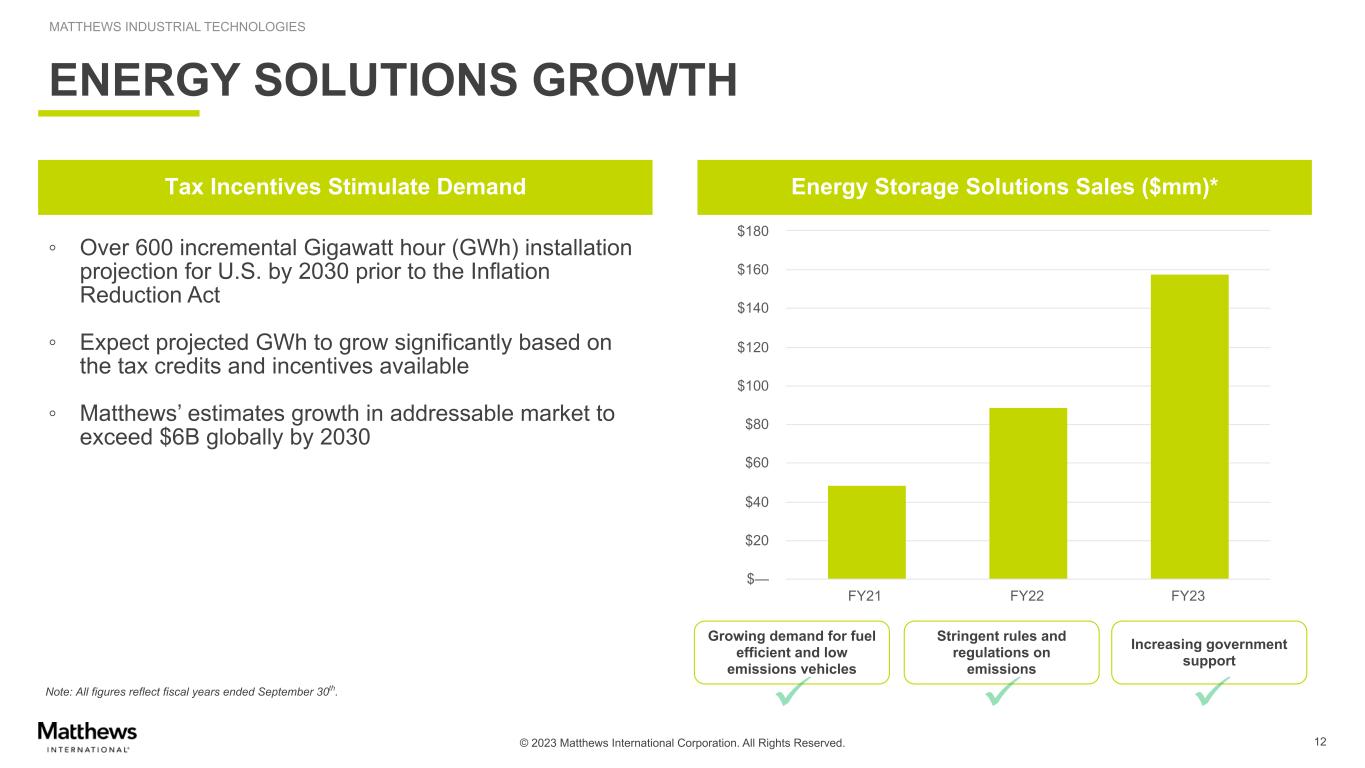
© 2023 Matthews International Corporation. All Rights Reserved. MATTHEWS INDUSTRIAL TECHNOLOGIES 12 Note: All figures reflect fiscal years ended September 30th. ENERGY SOLUTIONS GROWTH Energy Storage Solutions Sales ($mm)* Growing demand for fuel efficient and low emissions vehicles Increasing government support Stringent rules and regulations on emissions Tax Incentives Stimulate Demand ◦ Over 600 incremental Gigawatt hour (GWh) installation projection for U.S. by 2030 prior to the Inflation Reduction Act ◦ Expect projected GWh to grow significantly based on the tax credits and incentives available ◦ Matthews’ estimates growth in addressable market to exceed $6B globally by 2030 FY21 FY22 FY23 $— $20 $40 $60 $80 $100 $120 $140 $160 $180
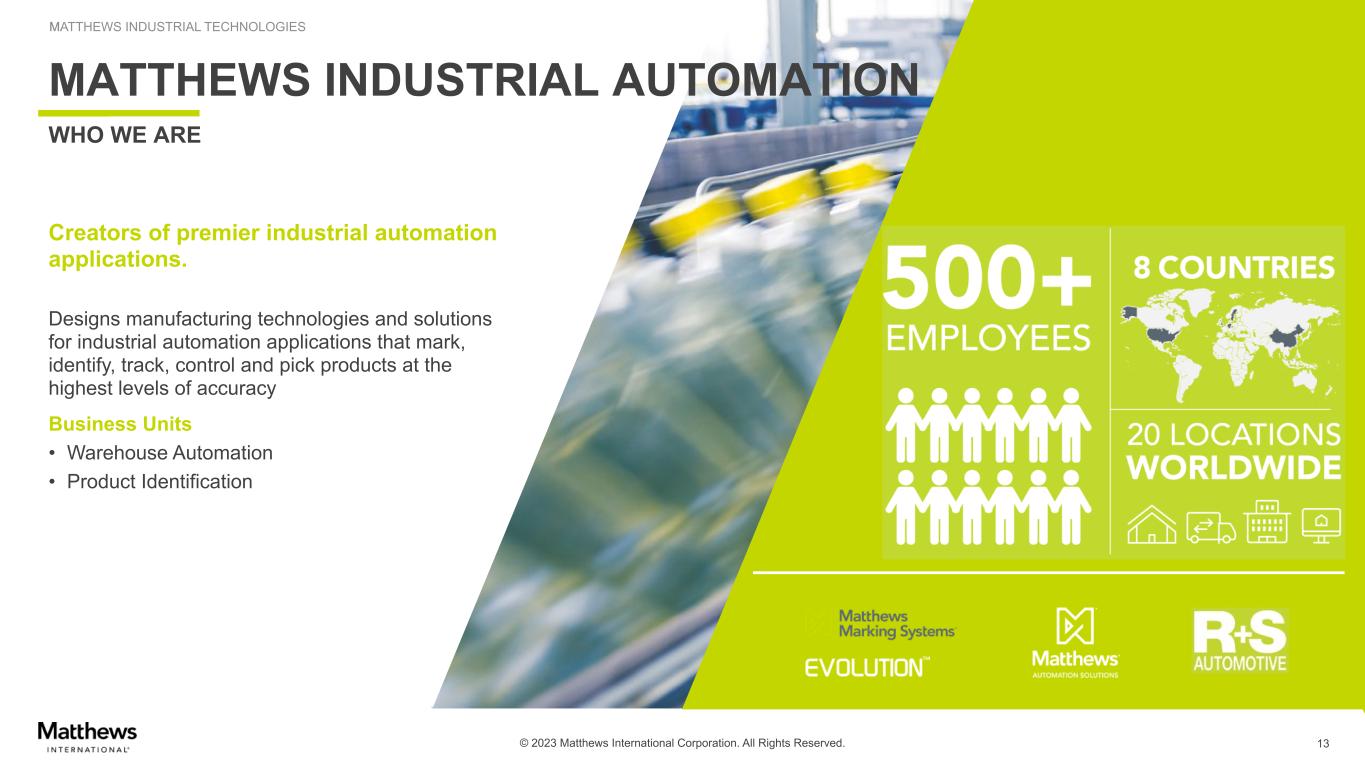
© 2023 Matthews International Corporation. All Rights Reserved. MATTHEWS INDUSTRIAL TECHNOLOGIES Creators of premier industrial automation applications. Designs manufacturing technologies and solutions for industrial automation applications that mark, identify, track, control and pick products at the highest levels of accuracy Business Units • Warehouse Automation • Product Identification MATTHEWS INDUSTRIAL AUTOMATION WHO WE ARE 13
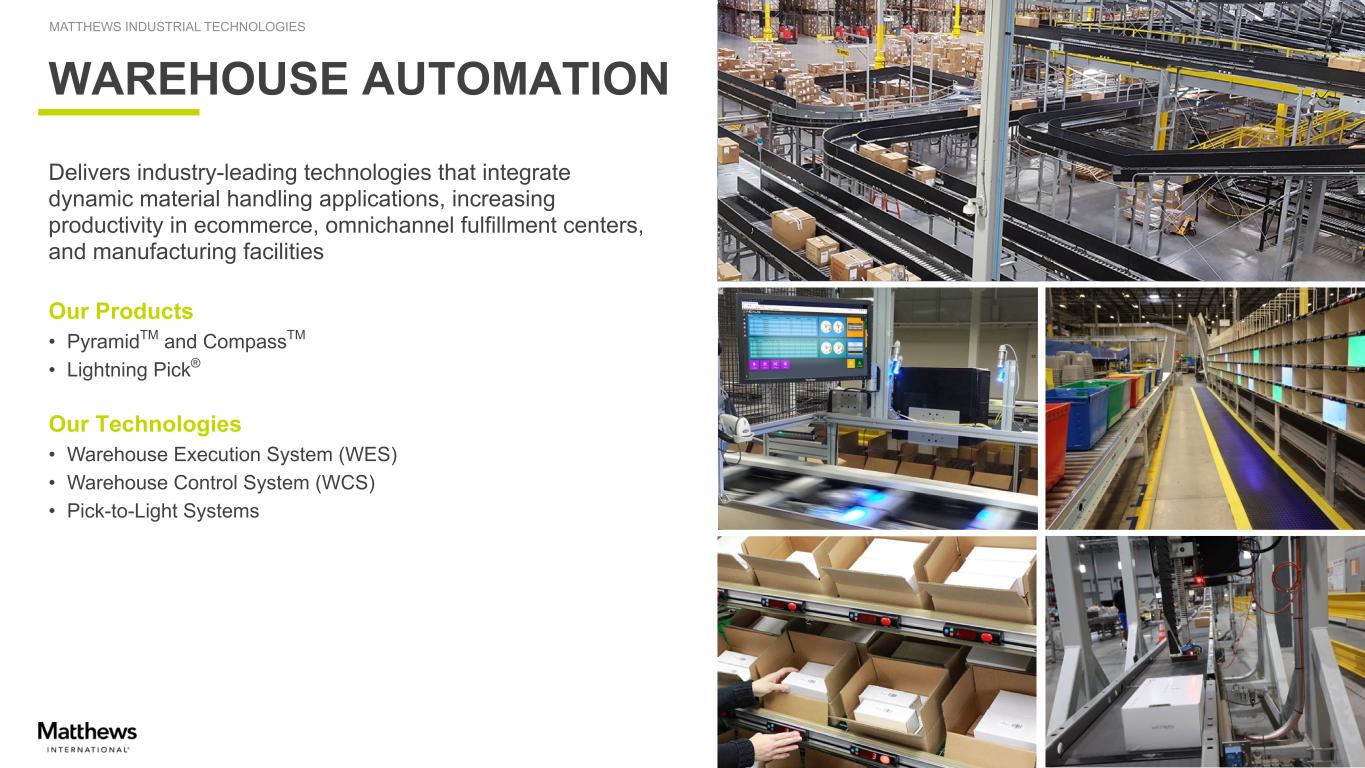
© 2023 Matthews International Corporation. All Rights Reserved. MATTHEWS INDUSTRIAL TECHNOLOGIES Delivers industry-leading technologies that integrate dynamic material handling applications, increasing productivity in ecommerce, omnichannel fulfillment centers, and manufacturing facilities Our Products • PyramidTM and CompassTM • Lightning Pick® Our Technologies • Warehouse Execution System (WES) • Warehouse Control System (WCS) • Pick-to-Light Systems WAREHOUSE AUTOMATION
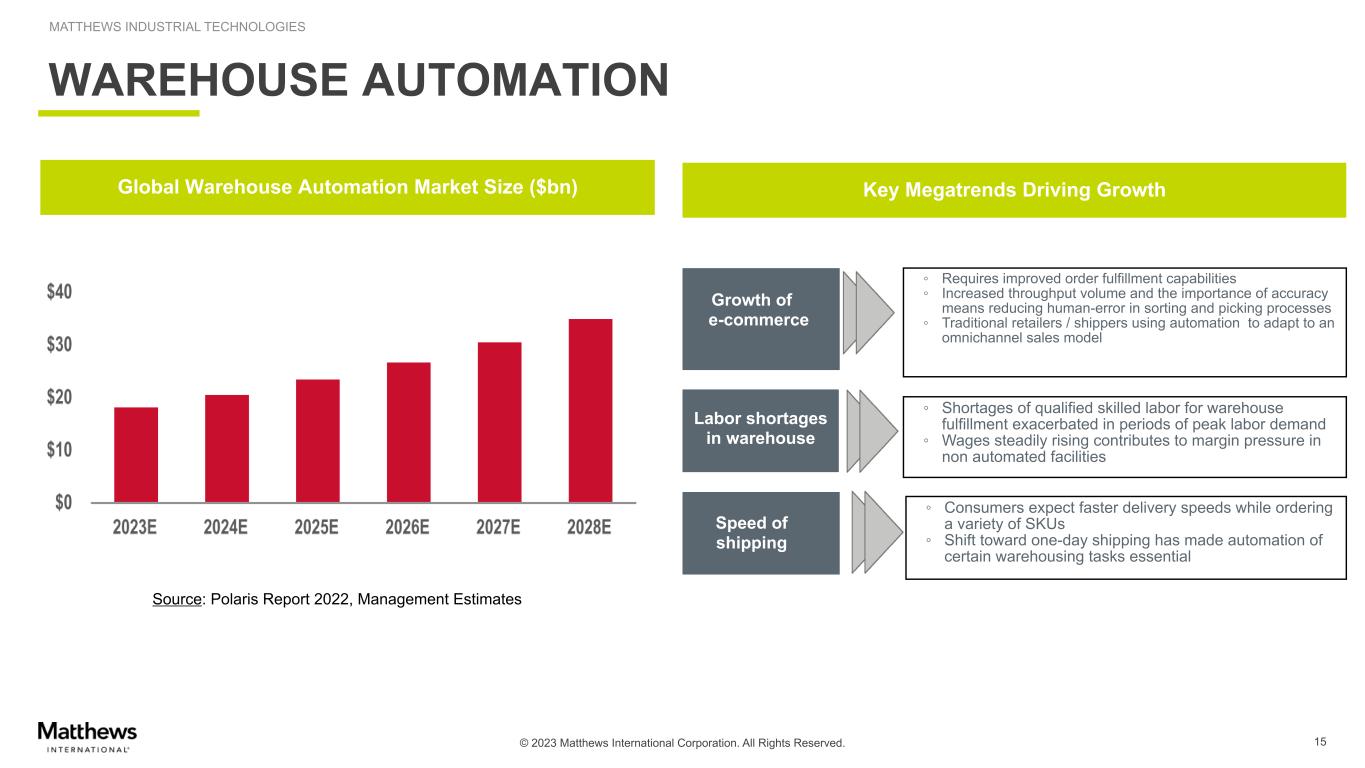
© 2023 Matthews International Corporation. All Rights Reserved. MATTHEWS INDUSTRIAL TECHNOLOGIES 15 WAREHOUSE AUTOMATION Global Warehouse Automation Market Size ($bn) Key Megatrends Driving Growth Speed of shipping Growth of e-commerce Labor shortages in warehouse ◦ Consumers expect faster delivery speeds while ordering a variety of SKUs ◦ Shift toward one-day shipping has made automation of certain warehousing tasks essential ◦ Requires improved order fulfillment capabilities ◦ Increased throughput volume and the importance of accuracy means reducing human-error in sorting and picking processes ◦ Traditional retailers / shippers using automation to adapt to an omnichannel sales model ◦ Shortages of qualified skilled labor for warehouse fulfillment exacerbated in periods of peak labor demand ◦ Wages steadily rising contributes to margin pressure in non automated facilities Source: Polaris Report 2022, Management Estimates
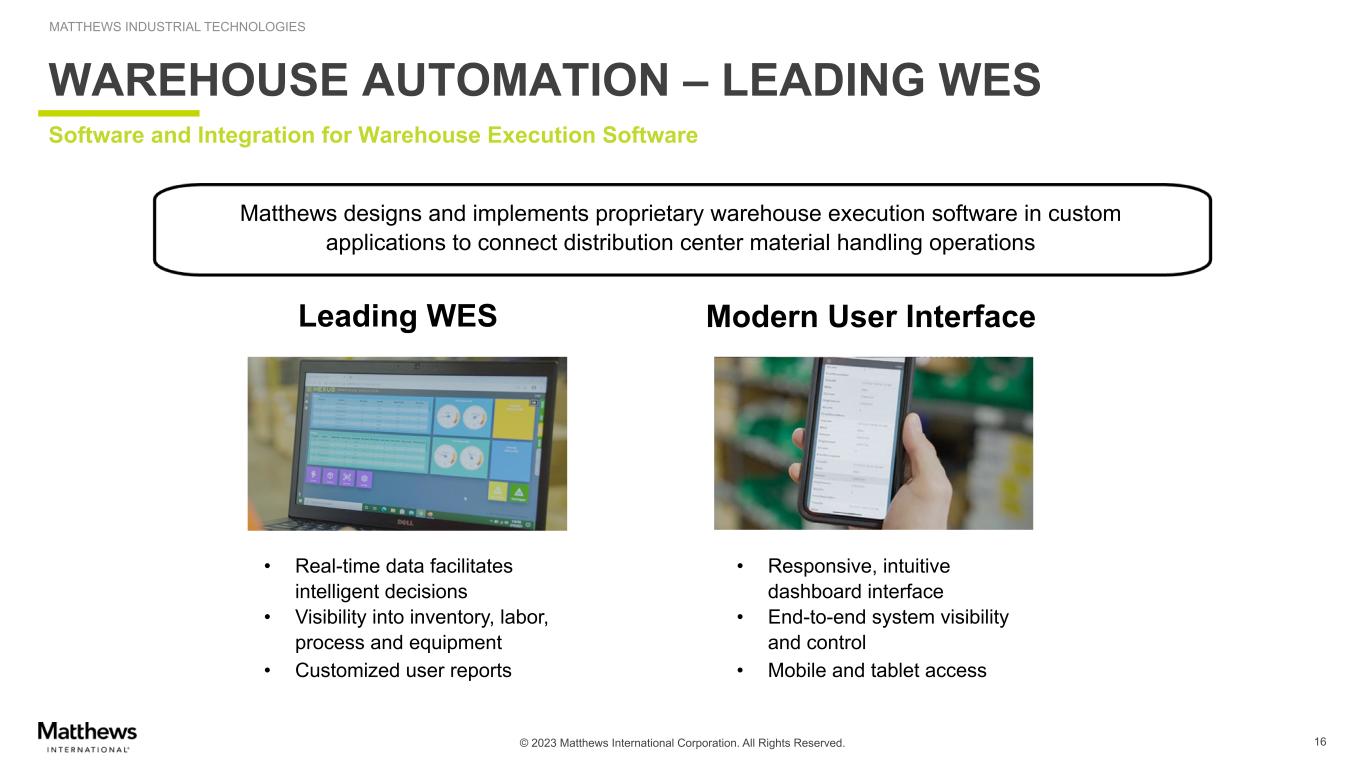
© 2023 Matthews International Corporation. All Rights Reserved. MATTHEWS INDUSTRIAL TECHNOLOGIES 16 WAREHOUSE AUTOMATION – LEADING WES Software and Integration for Warehouse Execution Software Leading WES Matthews designs and implements proprietary warehouse execution software in custom applications to connect distribution center material handling operations Modern User Interface • Responsive, intuitive dashboard interface • End-to-end system visibility and control • Mobile and tablet access • Real-time data facilitates intelligent decisions • Visibility into inventory, labor, process and equipment • Customized user reports
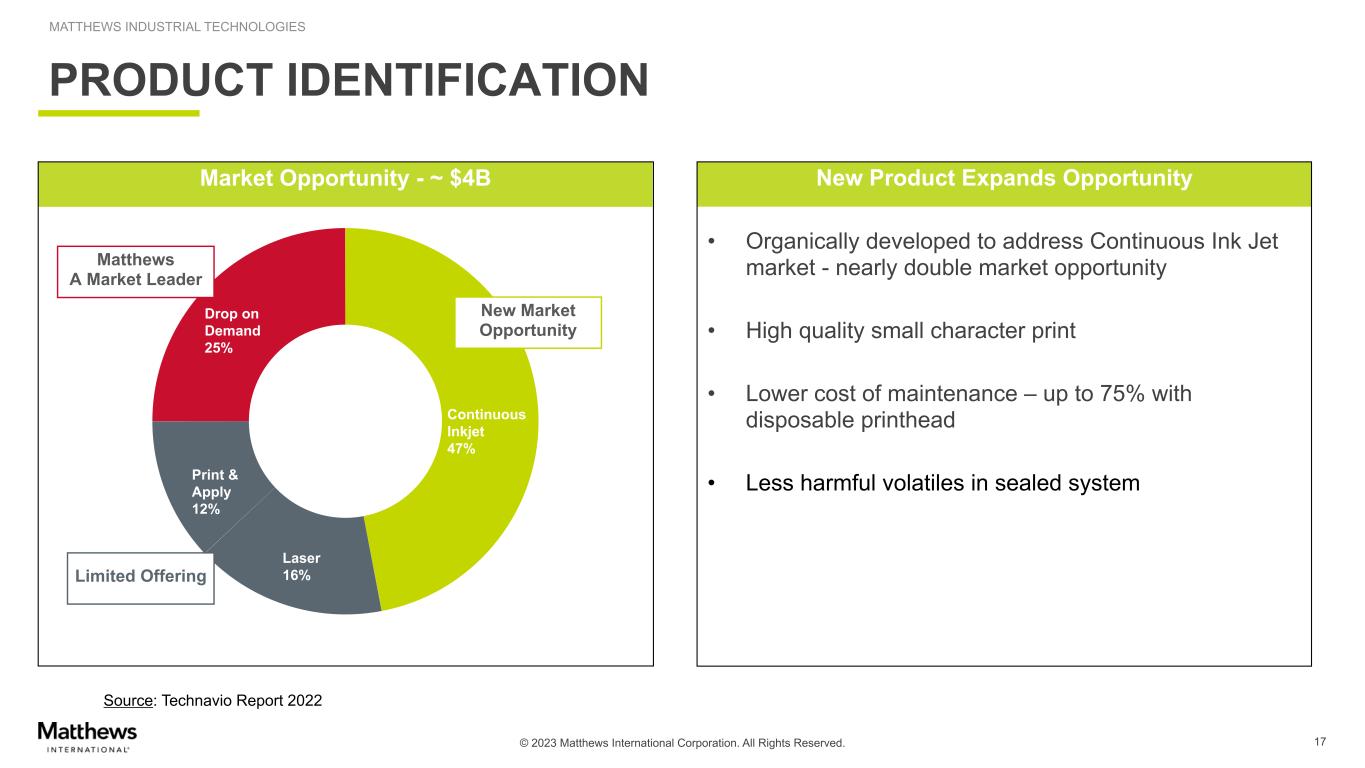
© 2023 Matthews International Corporation. All Rights Reserved. MATTHEWS INDUSTRIAL TECHNOLOGIES 17 MARKET OPPORTUNITY PRODUCT IDENTIFICATION Market Opportunity - ~ $4B Source: Technavio Report 2022 New Product xpands Opportunity • Organically developed to address Continuous Ink Jet market - nearly double market opportunity • High quality small character print • Lower cost of maintenance – up to 75% with disposable printhead • Less harmful volatiles in sealed system Continuous Inkjet 47% Laser 16% Print & Apply 12% Drop on Demand 25% Matthews A Market Leader New Market Opportunity Limited Offering
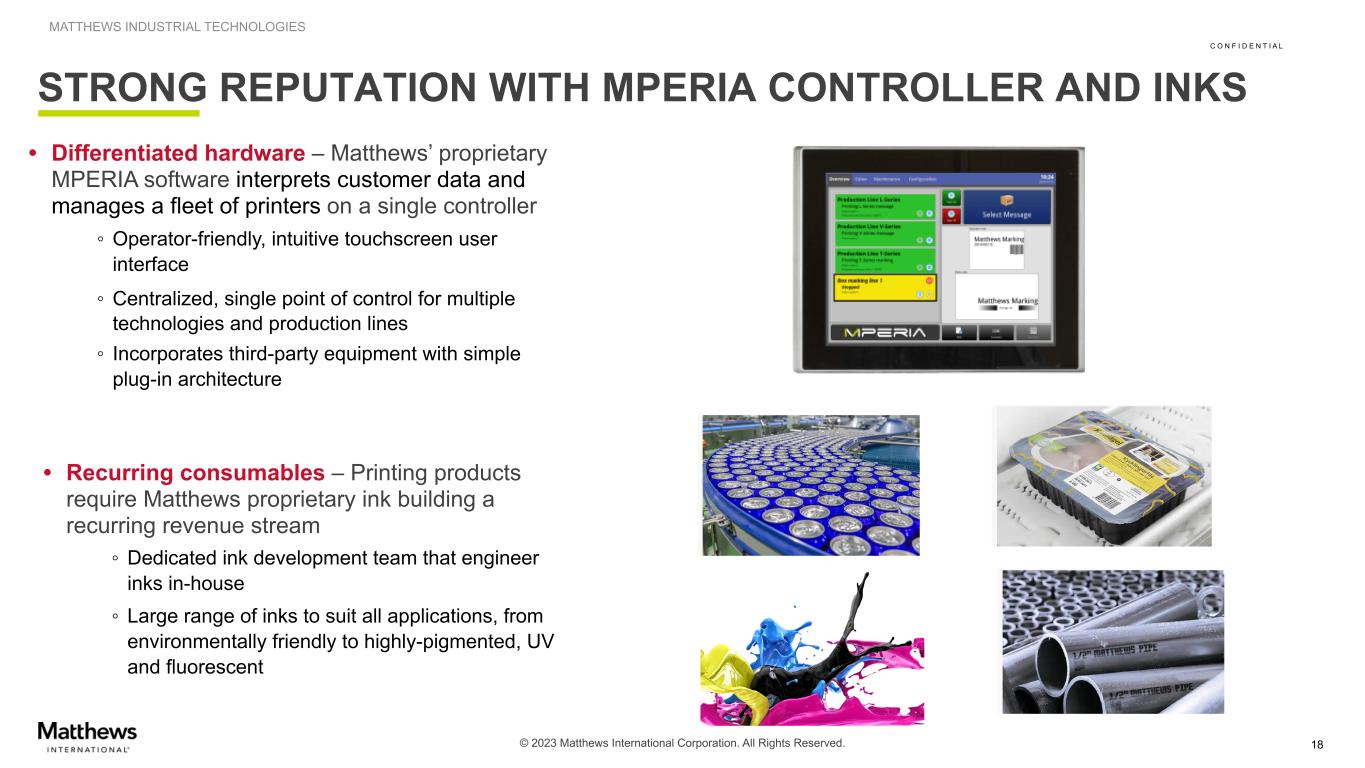
© 2023 Matthews International Corporation. All Rights Reserved. MATTHEWS INDUSTRIAL TECHNOLOGIES C O N F I D E N T I A L STRONG REPUTATION WITH MPERIA CONTROLLER AND INKS 18 • Recurring consumables – Printing products require Matthews proprietary ink building a recurring revenue stream ◦ Dedicated ink development team that engineer inks in-house ◦ Large range of inks to suit all applications, from environmentally friendly to highly-pigmented, UV and fluorescent • Differentiated hardware – Matthews’ proprietary MPERIA software interprets customer data and manages a fleet of printers on a single controller ◦ Operator-friendly, intuitive touchscreen user interface ◦ Centralized, single point of control for multiple technologies and production lines ◦ Incorporates third-party equipment with simple plug-in architecture
© 2023 Matthews International Corporation. All Rights Reserved. MATTHEWS MEMORIALIZATION
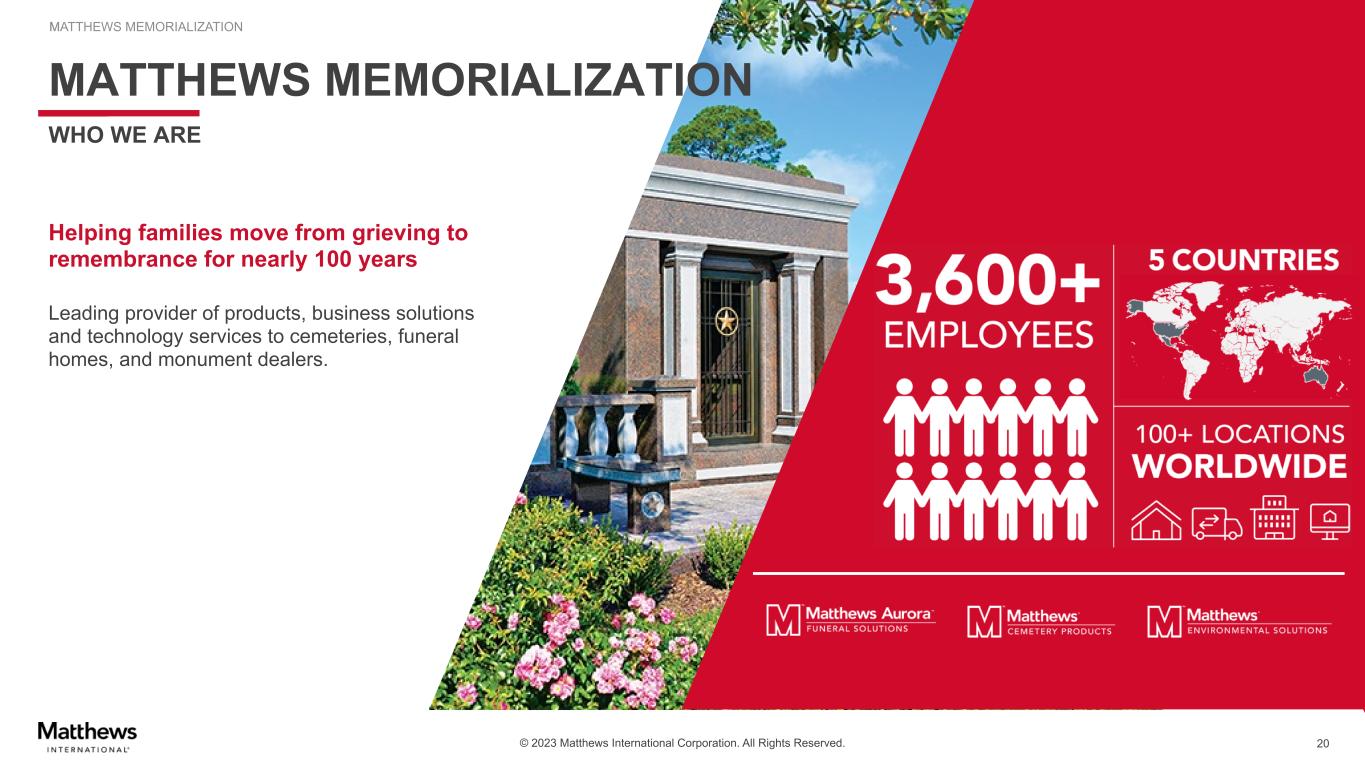
© 2023 Matthews International Corporation. All Rights Reserved. MATTHEWS MEMORIALIZATION Helping families move from grieving to remembrance for nearly 100 years Leading provider of products, business solutions and technology services to cemeteries, funeral homes, and monument dealers. MATTHEWS MEMORIALIZATION WHO WE ARE 20
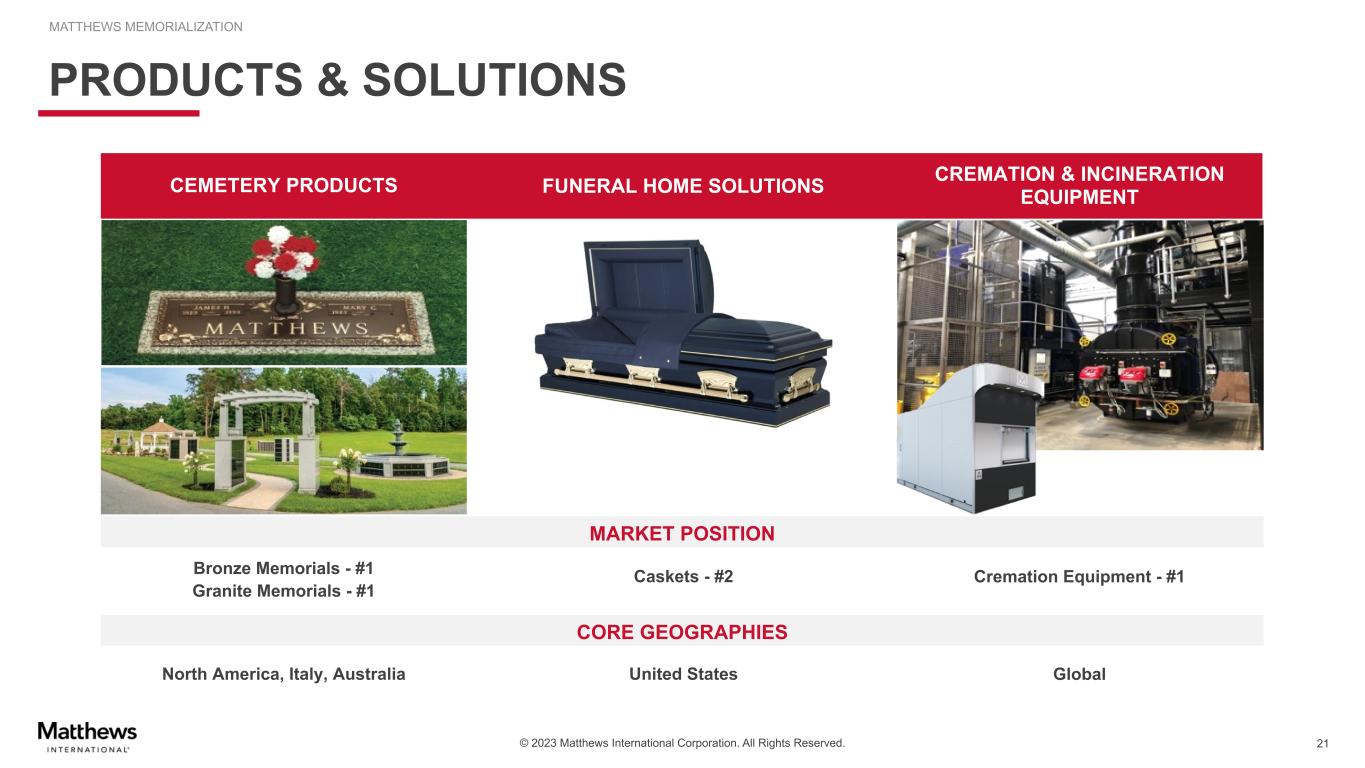
© 2023 Matthews International Corporation. All Rights Reserved. MATTHEWS MEMORIALIZATION 21 PRODUCTS & SOLUTIONS CEMETERY PRODUCTS FUNERAL HOME SOLUTIONS CREMATION & INCINERATION EQUIPMENT MARKET POSITION CORE GEOGRAPHIES North America, Italy, Australia United States Global Bronze Memorials - #1 Granite Memorials - #1 Caskets - #2 Cremation Equipment - #1
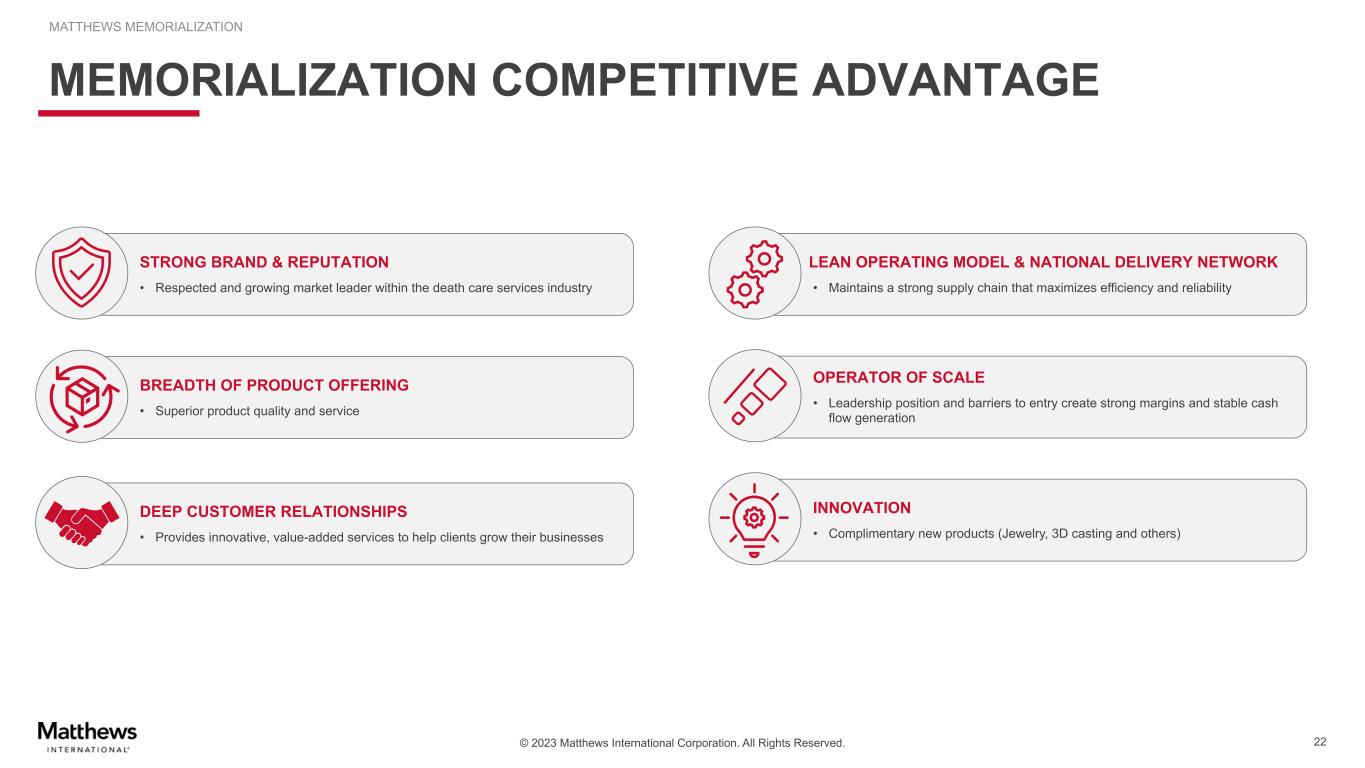
© 2023 Matthews International Corporation. All Rights Reserved. MATTHEWS MEMORIALIZATION 22 MEMORIALIZATION COMPETITIVE ADVANTAGE OPERATOR OF SCALE • Leadership position and barriers to entry create strong margins and stable cash flow generation STRONG BRAND & REPUTATION • Respected and growing market leader within the death care services industry DEEP CUSTOMER RELATIONSHIPS • Provides innovative, value-added services to help clients grow their businesses BREADTH OF PRODUCT OFFERING • Superior product quality and service LEAN OPERATING MODEL & NATIONAL DELIVERY NETWORK • Maintains a strong supply chain that maximizes efficiency and reliability INNOVATION • Complimentary new products (Jewelry, 3D casting and others)
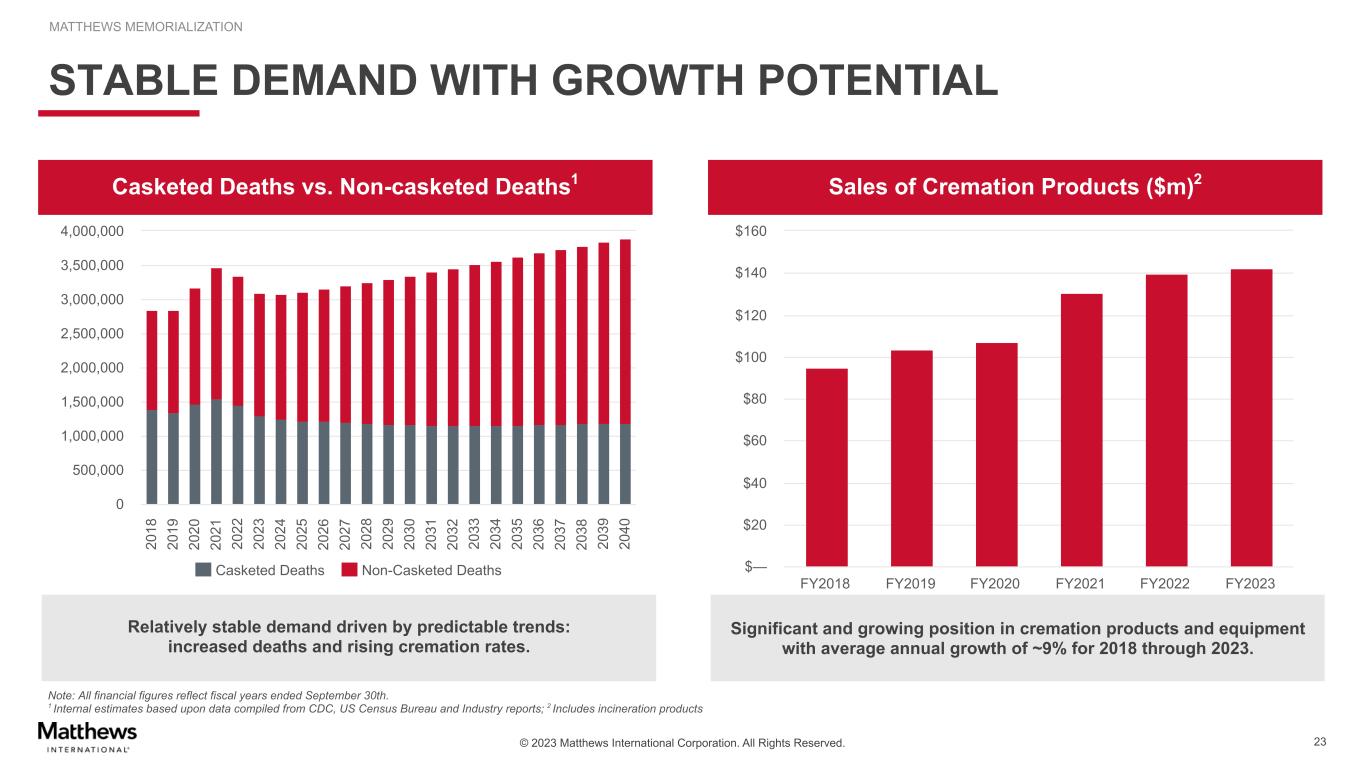
© 2023 Matthews International Corporation. All Rights Reserved. MATTHEWS MEMORIALIZATION 23 STABLE DEMAND WITH GROWTH POTENTIAL Casketed Deaths vs. Non-casketed Deaths1 Sales of Cremation Products ($m)2 Relatively stable demand driven by predictable trends: increased deaths and rising cremation rates. Significant and growing position in cremation products and equipment with average annual growth of ~9% for 2018 through 2023. Note: All financial figures reflect fiscal years ended September 30th. 1 Internal estimates based upon data compiled from CDC, US Census Bureau and Industry reports; 2 Includes incineration products Casketed Deaths Non-Casketed Deaths 20 18 20 19 20 20 20 21 20 22 20 23 20 24 20 25 20 26 20 27 20 28 20 29 20 30 20 31 20 32 20 33 20 34 20 35 20 36 20 37 20 38 20 39 20 40 0 500,000 1,000,000 1,500,000 2,000,000 2,500,000 3,000,000 3,500,000 4,000,000 FY2018 FY2019 FY2020 FY2021 FY2022 FY2023 $— $20 $40 $60 $80 $100 $120 $140 $160
© 2023 Matthews International Corporation. All Rights Reserved. SGK BRAND SOLUTIONS
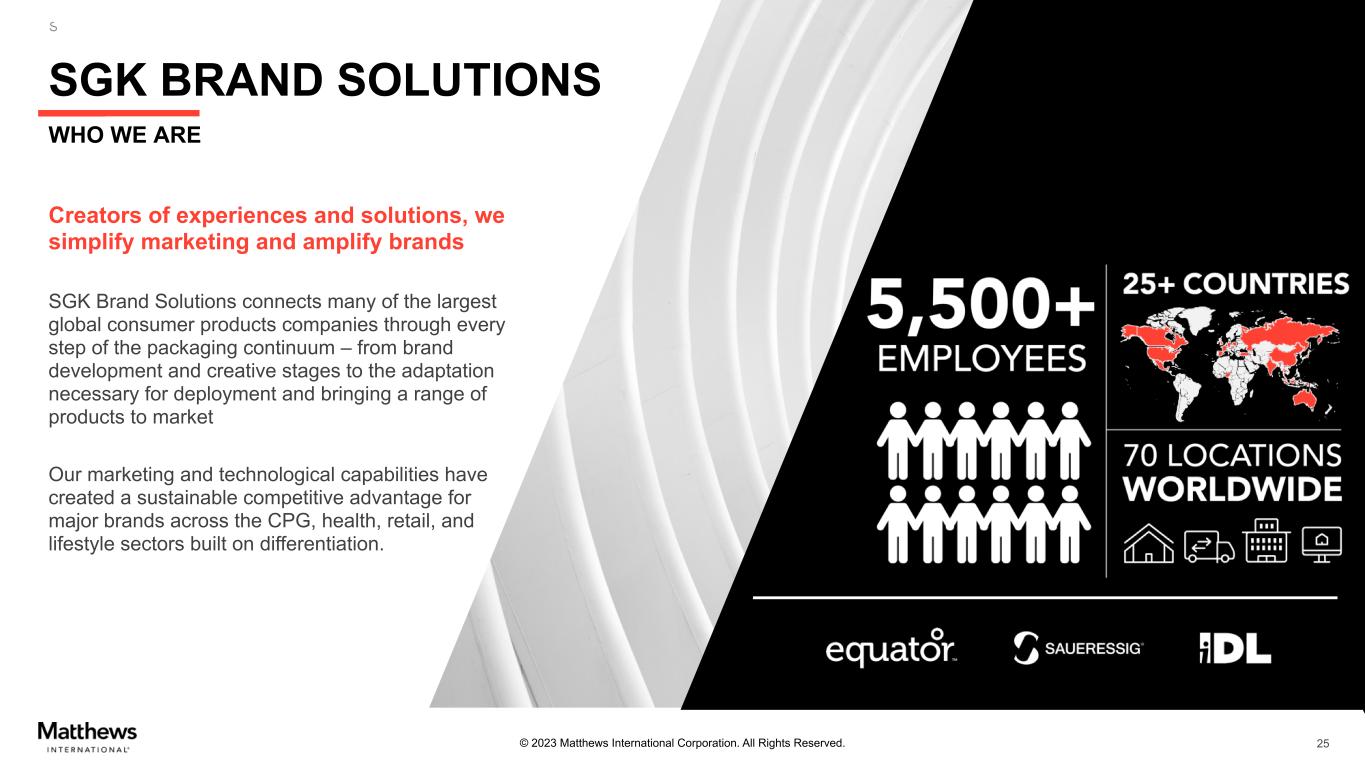
© 2023 Matthews International Corporation. All Rights Reserved. SGK BRAND SOLUTIONS Creators of experiences and solutions, we simplify marketing and amplify brands SGK Brand Solutions connects many of the largest global consumer products companies through every step of the packaging continuum – from brand development and creative stages to the adaptation necessary for deployment and bringing a range of products to market Our marketing and technological capabilities have created a sustainable competitive advantage for major brands across the CPG, health, retail, and lifestyle sectors built on differentiation. SGK BRAND SOLUTIONS WHO WE ARE 25
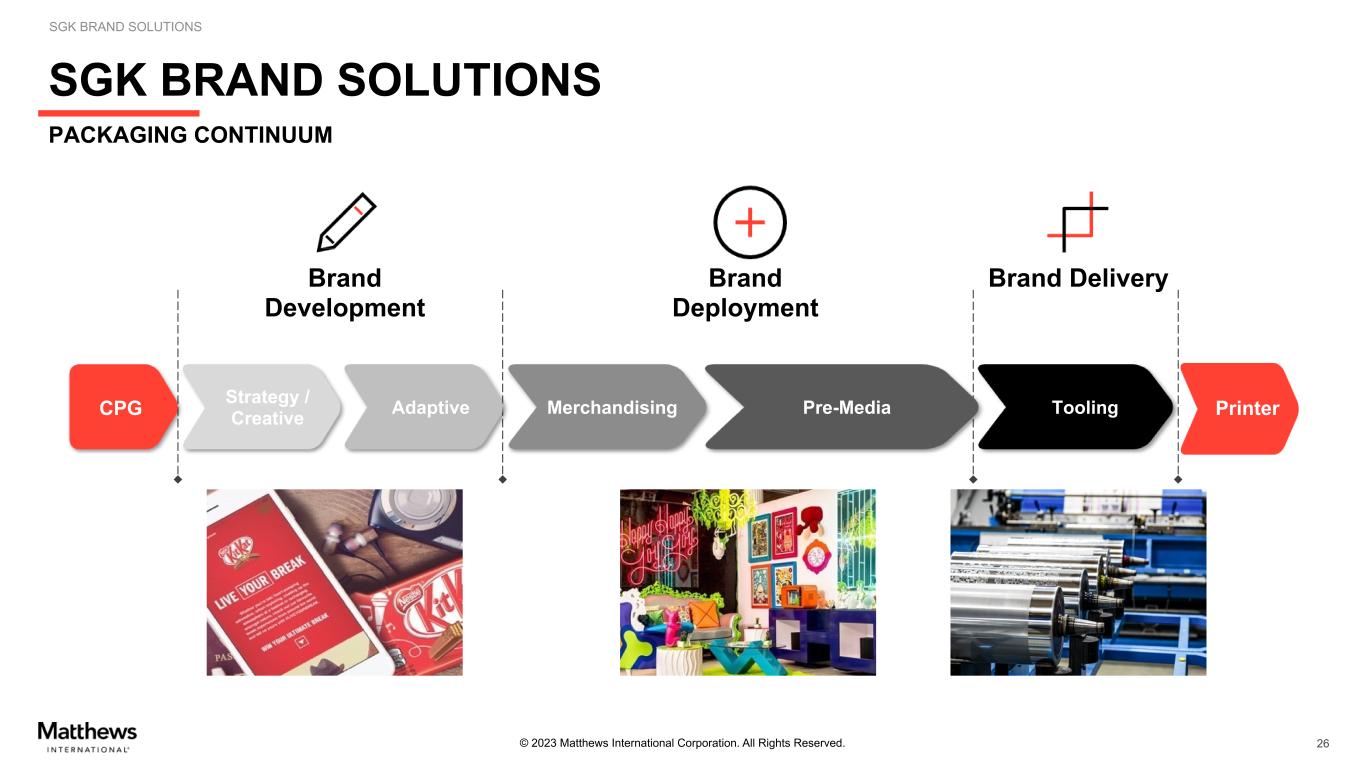
© 2023 Matthews International Corporation. All Rights Reserved. SGK BRAND SOLUTIONS SGK BRAND SOLUTIONS PACKAGING CONTINUUM 26 Brand Development Assemb le TeamStrategy / Creative Adaptive Merchandising Pre-Media Tooling PrinterCPG Brand Deployment Brand Delivery
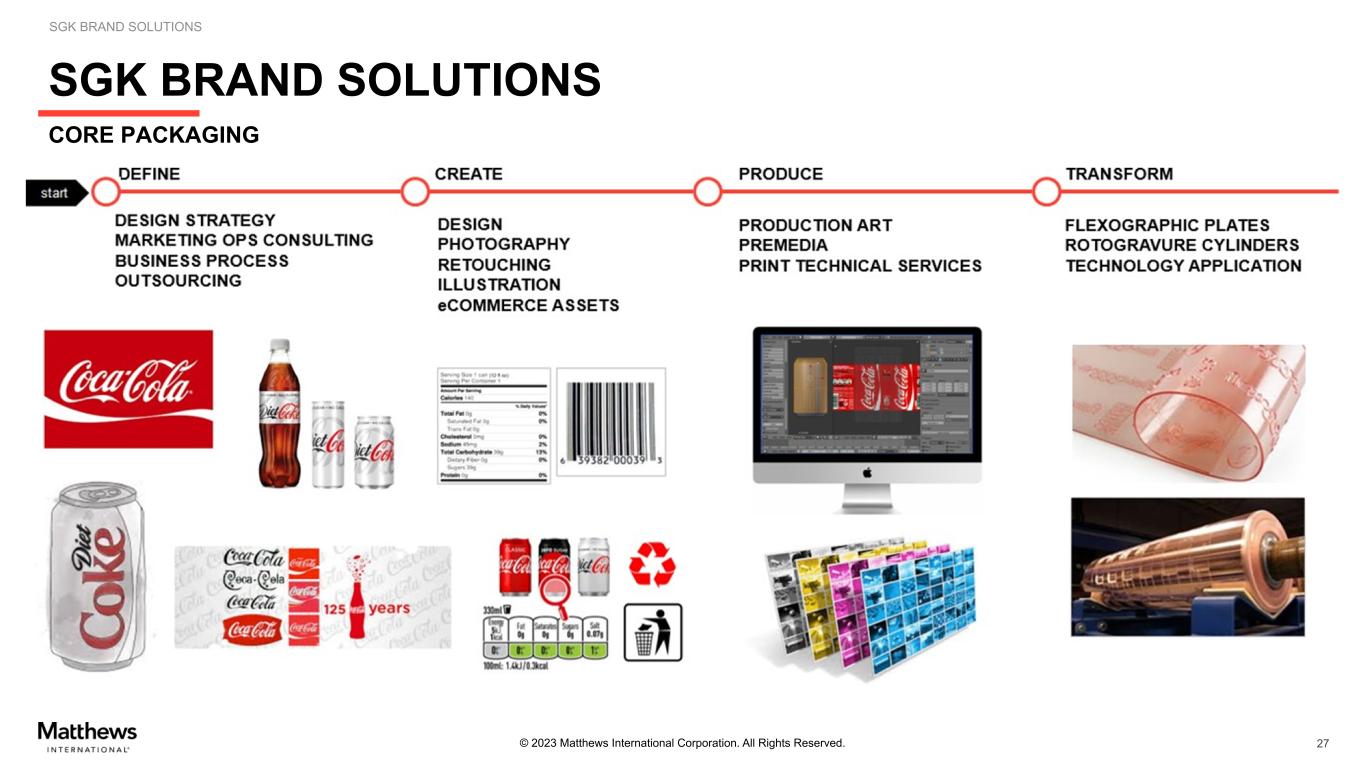
© 2023 Matthews International Corporation. All Rights Reserved. SGK BRAND SOLUTIONS SGK BRAND SOLUTIONS 27 CORE PACKAGING
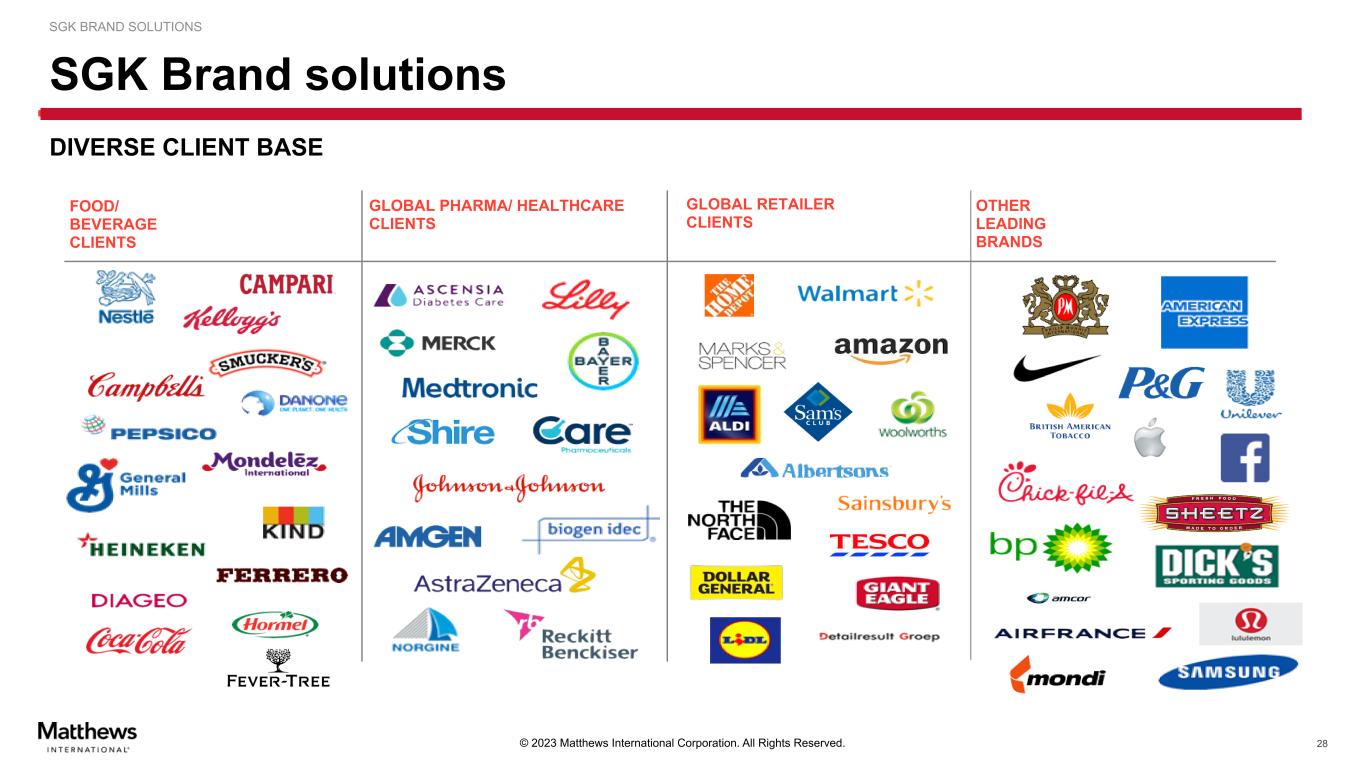
© 2023 Matthews International Corporation. All Rights Reserved. SGK BRAND SOLUTIONS SGK Brand solutions 28 DIVERSE CLIENT BASE FOOD/ BEVERAGE CLIENTS GLOBAL PHARMA/ HEALTHCARE CLIENTS GLOBAL RETAILER CLIENTS OTHER LEADING BRANDS
© 2023 Matthews International Corporation. All Rights Reserved. 29 INVESTMENT HIGHLIGHTS AND FINANCIAL OVERVIEW
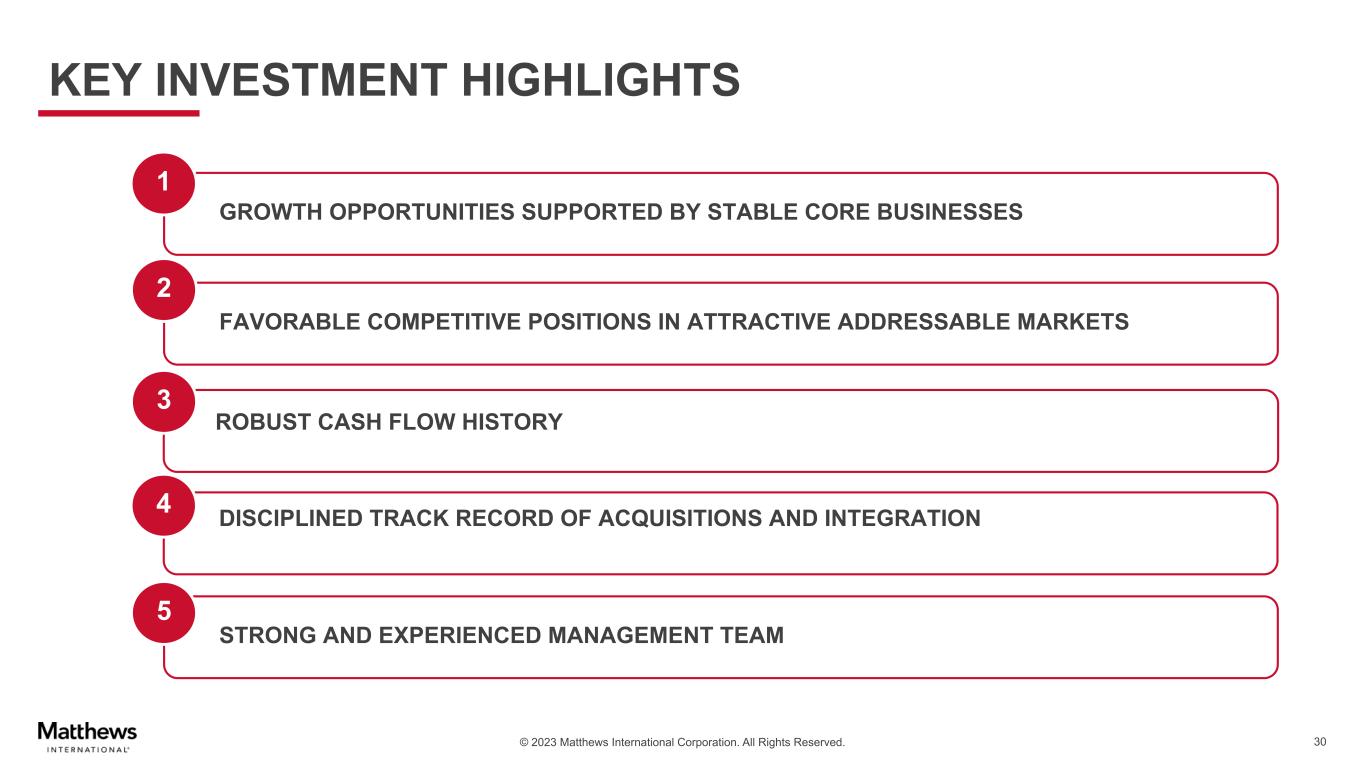
© 2023 Matthews International Corporation. All Rights Reserved. 30 GROWTH OPPORTUNITIES SUPPORTED BY STABLE CORE BUSINESSES 1 FAVORABLE COMPETITIVE POSITIONS IN ATTRACTIVE ADDRESSABLE MARKETS 2 DISCIPLINED TRACK RECORD OF ACQUISITIONS AND INTEGRATION4 STRONG AND EXPERIENCED MANAGEMENT TEAM 5 3 KEY INVESTMENT HIGHLIGHTS ROBUST CASH FLOW HISTORY
© 2023 Matthews International Corporation. All Rights Reserved. 31 Financial Overview
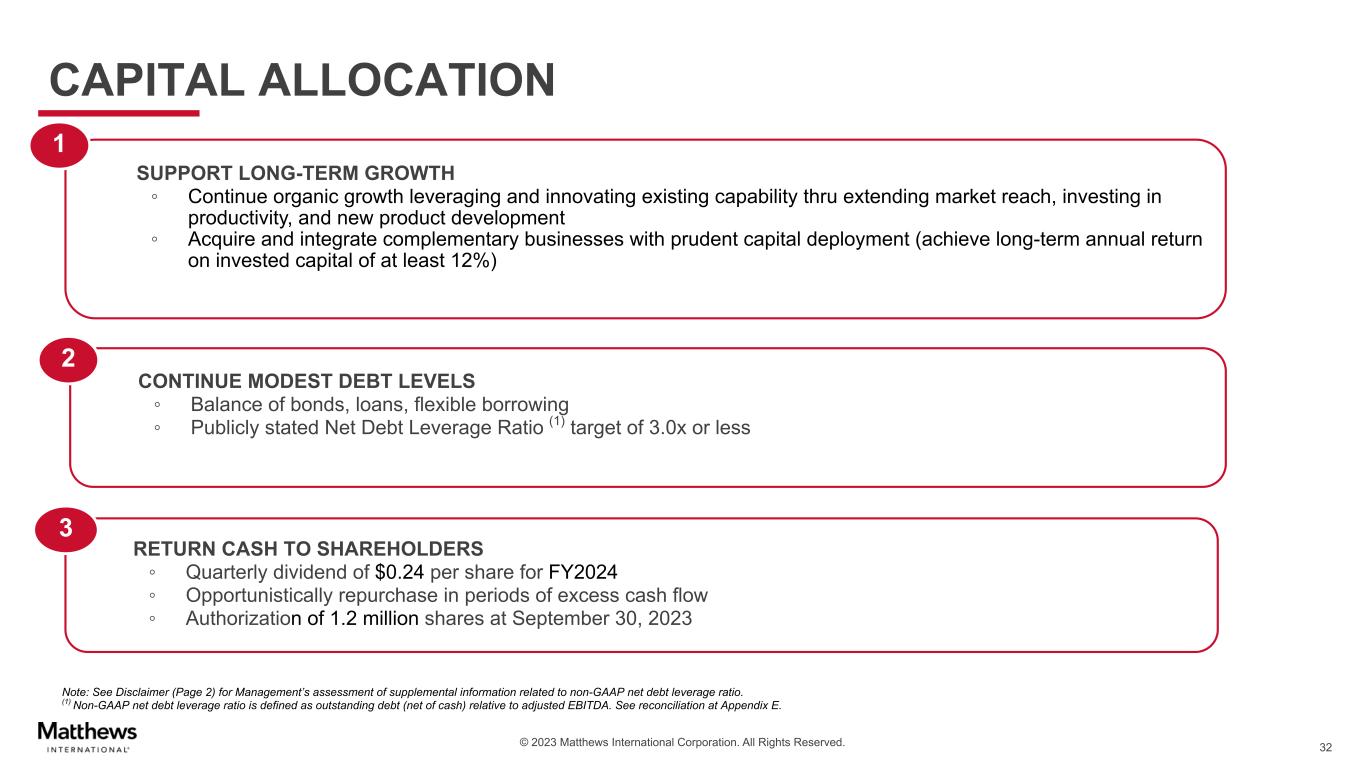
© 2023 Matthews International Corporation. All Rights Reserved. Note: See Disclaimer (Page 2) for Management’s assessment of supplemental information related to non-GAAP net debt leverage ratio. (1) Non-GAAP net debt leverage ratio is defined as outstanding debt (net of cash) relative to adjusted EBITDA. See reconciliation at Appendix E. CAPITAL ALLOCATION SUPPORT LONG-TERM GROWTH ◦ Continue organic growth leveraging and innovating existing capability thru extending market reach, investing in productivity, and new product development ◦ Acquire and integrate complementary businesses with prudent capital deployment (achieve long-term annual return on invested capital of at least 12%) 1 CONTINUE MODEST DEBT LEVELS ◦ Balance of bonds, loans, flexible borrowing ◦ Publicly stated Net Debt Leverage Ratio (1) target of 3.0x or less 2 RETURN CASH TO SHAREHOLDERS ◦ Quarterly dividend of $0.24 per share for FY2024 ◦ Opportunistically repurchase in periods of excess cash flow ◦ Authorization of 1.2 million shares at September 30, 2023 3 32
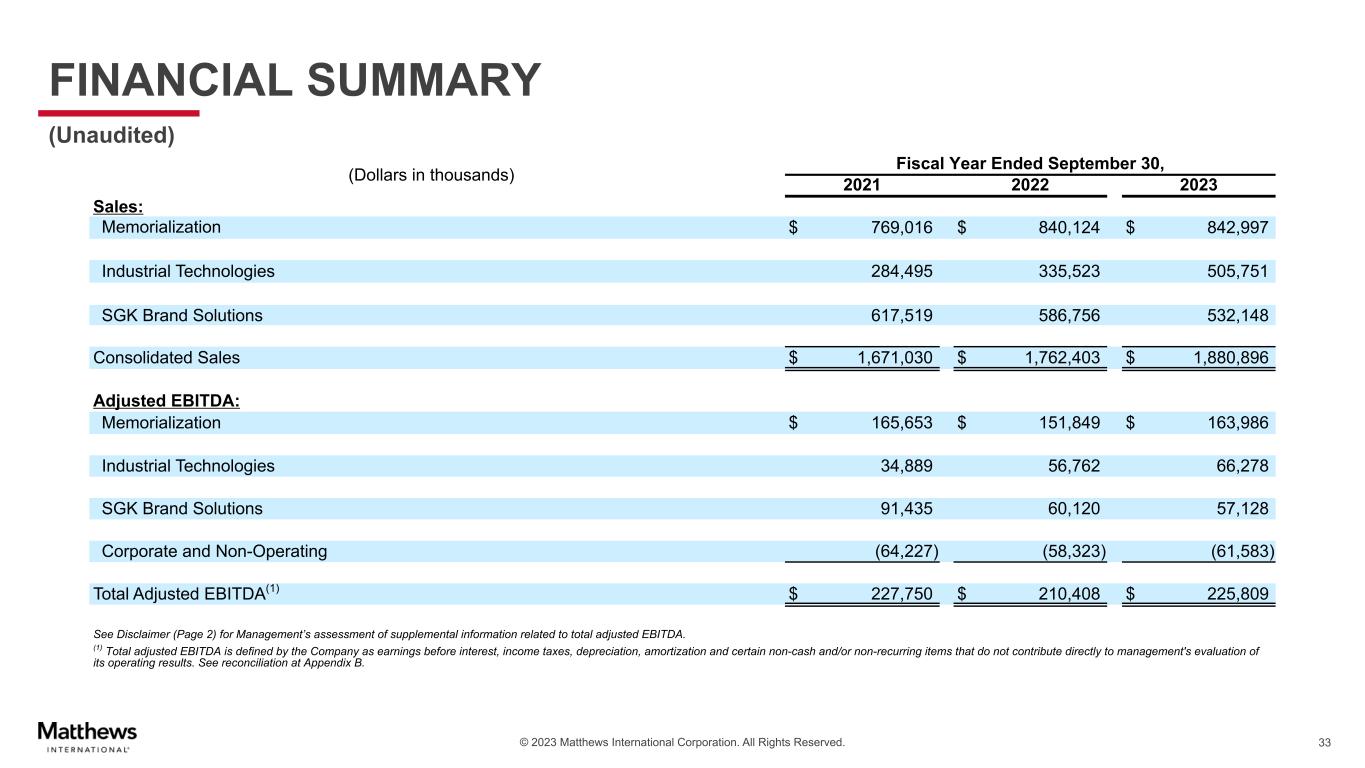
© 2023 Matthews International Corporation. All Rights Reserved. 33 FINANCIAL SUMMARY (Unaudited) (Dollars in thousands) Fiscal Year Ended September 30, 2021 2022 2023 Sales: Memorialization $ 769,016 $ 840,124 $ 842,997 Industrial Technologies 284,495 335,523 505,751 SGK Brand Solutions 617,519 586,756 532,148 Consolidated Sales $ 1,671,030 $ 1,762,403 $ 1,880,896 Adjusted EBITDA: Memorialization $ 165,653 $ 151,849 $ 163,986 Industrial Technologies 34,889 56,762 66,278 SGK Brand Solutions 91,435 60,120 57,128 Corporate and Non-Operating (64,227) (58,323) (61,583) Total Adjusted EBITDA(1) $ 227,750 $ 210,408 $ 225,809 See Disclaimer (Page 2) for Management’s assessment of supplemental information related to total adjusted EBITDA. (1) Total adjusted EBITDA is defined by the Company as earnings before interest, income taxes, depreciation, amortization and certain non-cash and/or non-recurring items that do not contribute directly to management's evaluation of its operating results. See reconciliation at Appendix B.
© 2023 Matthews International Corporation. All Rights Reserved. 34 ESG Overview
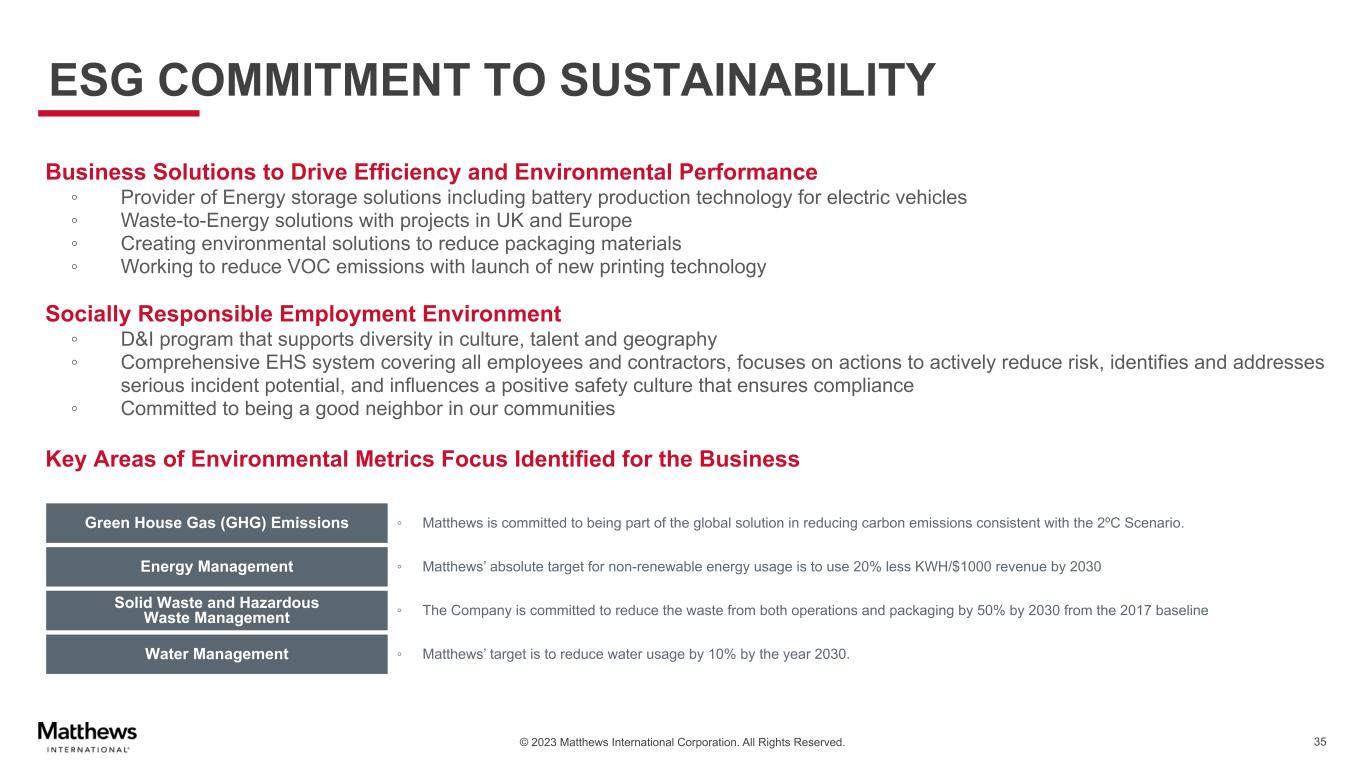
© 2023 Matthews International Corporation. All Rights Reserved. 35 Business Solutions to Drive Efficiency and Environmental Performance ◦ Provider of Energy storage solutions including battery production technology for electric vehicles ◦ Waste-to-Energy solutions with projects in UK and Europe ◦ Creating environmental solutions to reduce packaging materials ◦ Working to reduce VOC emissions with launch of new printing technology Socially Responsible Employment Environment ◦ D&I program that supports diversity in culture, talent and geography ◦ Comprehensive EHS system covering all employees and contractors, focuses on actions to actively reduce risk, identifies and addresses serious incident potential, and influences a positive safety culture that ensures compliance ◦ Committed to being a good neighbor in our communities Key Areas of Environmental Metrics Focus Identified for the Business Green House Gas (GHG) Emissions ◦ Matthews is committed to being part of the global solution in reducing carbon emissions consistent with the 2ºC Scenario. Energy Management ◦ Matthews’ absolute target for non-renewable energy usage is to use 20% less KWH/$1000 revenue by 2030 Solid Waste and Hazardous Waste Management ◦ The Company is committed to reduce the waste from both operations and packaging by 50% by 2030 from the 2017 baseline Water Management ◦ Matthews’ target is to reduce water usage by 10% by the year 2030. ESG COMMITMENT TO SUSTAINABILITY
© 2023 Matthews International Corporation. All Rights Reserved. 36 Appendix
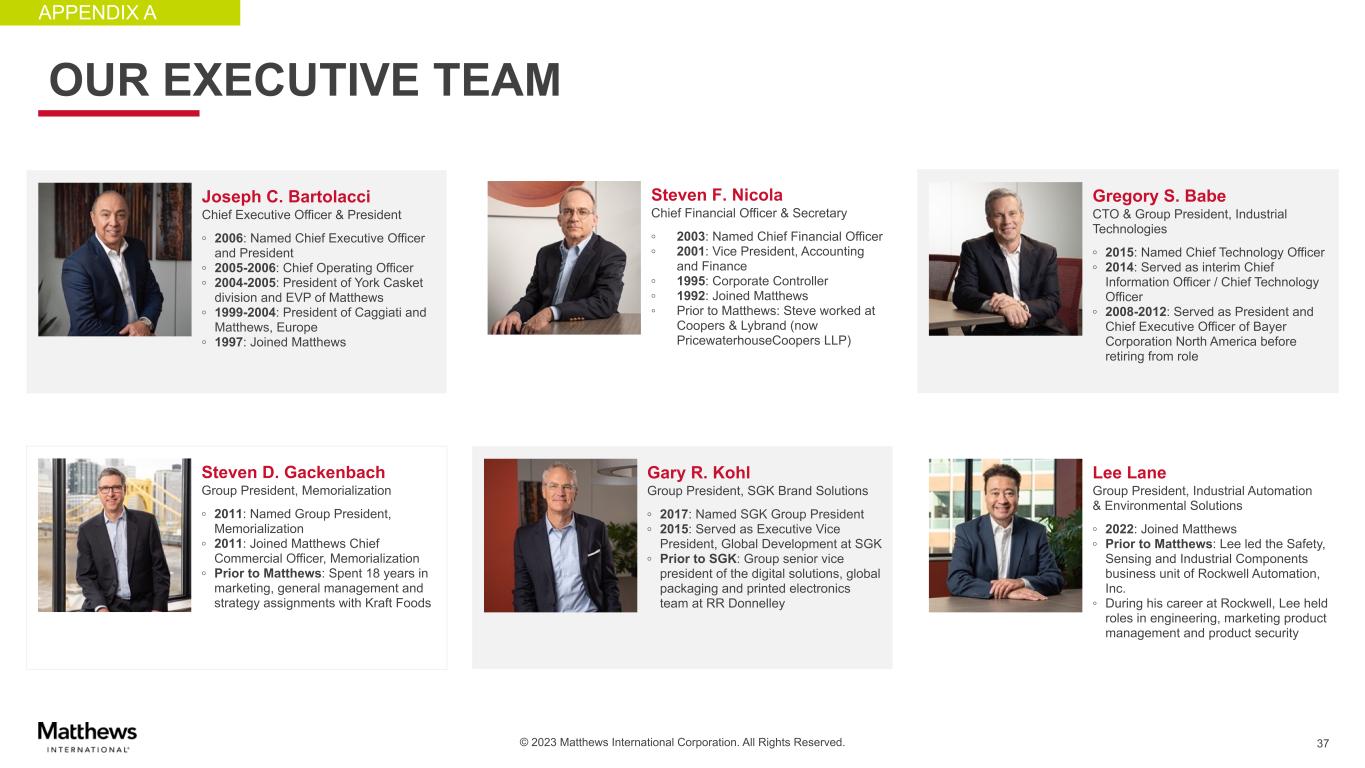
© 2023 Matthews International Corporation. All Rights Reserved. Steven F. Nicola Chief Financial Officer & Secretary ◦ 2003: Named Chief Financial Officer ◦ 2001: Vice President, Accounting and Finance ◦ 1995: Corporate Controller ◦ 1992: Joined Matthews ◦ Prior to Matthews: Steve worked at Coopers & Lybrand (now PricewaterhouseCoopers LLP) 37 Joseph C. Bartolacci Chief Executive Officer & President ◦ 2006: Named Chief Executive Officer and President ◦ 2005-2006: Chief Operating Officer ◦ 2004-2005: President of York Casket division and EVP of Matthews ◦ 1999-2004: President of Caggiati and Matthews, Europe ◦ 1997: Joined Matthews OUR EXECUTIVE TEAM Steven D. Gackenbach Group President, Memorialization ◦ 2011: Named Group President, Memorialization ◦ 2011: Joined Matthews Chief Commercial Officer, Memorialization ◦ Prior to Matthews: Spent 18 years in marketing, general management and strategy assignments with Kraft Foods Gary R. Kohl Group President, SGK Brand Solutions ◦ 2017: Named SGK Group President ◦ 2015: Served as Executive Vice President, Global Development at SGK ◦ Prior to SGK: Group senior vice president of the digital solutions, global packaging and printed electronics team at RR Donnelley Lee Lane Group President, Industrial Automation & Environmental Solutions ◦ 2022: Joined Matthews ◦ Prior to Matthews: Lee led the Safety, Sensing and Industrial Components business unit of Rockwell Automation, Inc. ◦ During his career at Rockwell, Lee held roles in engineering, marketing product management and product security Gregory S. Babe CTO & Group President, Industrial Technologies ◦ 2015: Named Chief Technology Officer ◦ 2014: Served as interim Chief Information Officer / Chief Technology Officer ◦ 2008-2012: Served as President and Chief Executive Officer of Bayer Corporation North America before retiring from role APPENDIX A
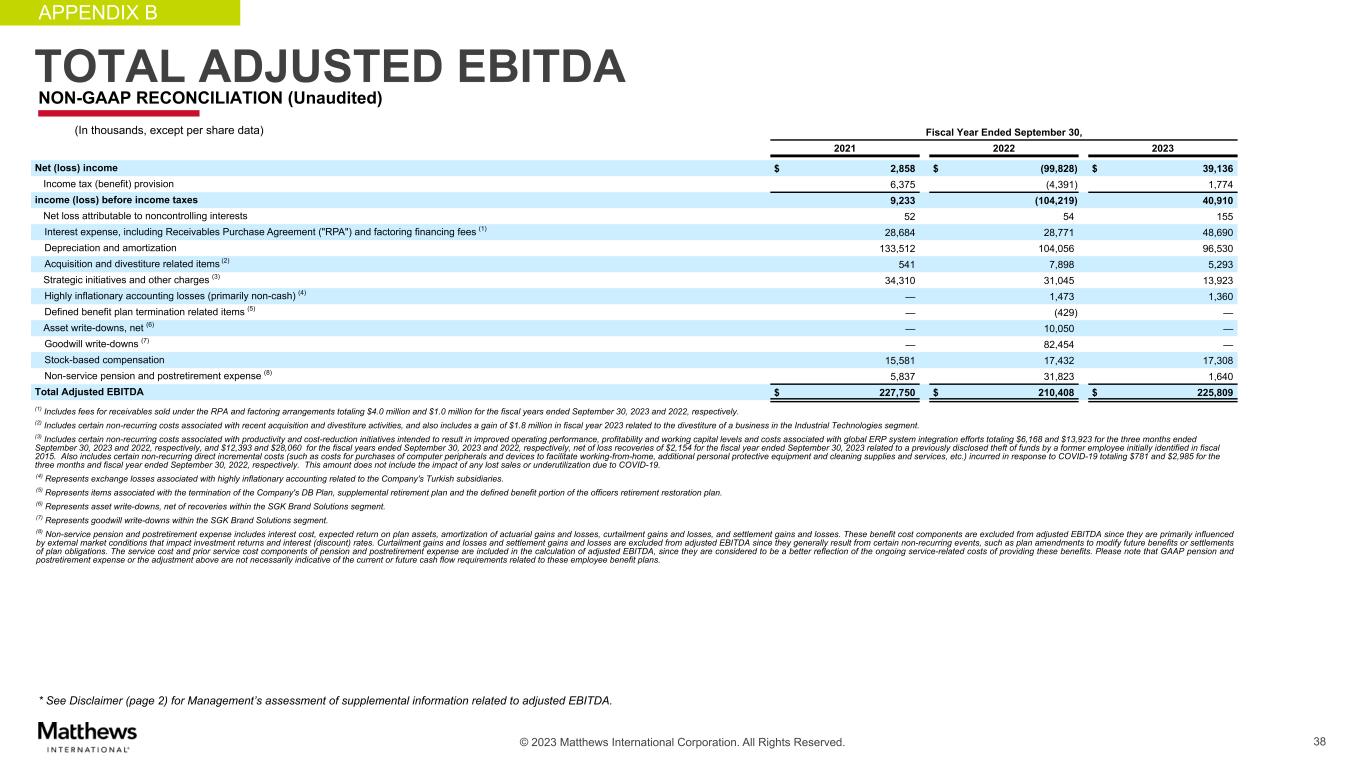
© 2023 Matthews International Corporation. All Rights Reserved. NON-GAAP RECONCILIATION (Unaudited) 38 APPENDIX B T T L ADJUSTED EBITDA Fiscal Year Ended September 30, 2021 2022 2023 Net (loss) income $ 2,858 $ (99,828) $ 39,136 Income tax (benefit) provision 6,375 (4,391) 1,774 income (loss) before income taxes 9,233 (104,219) 40,910 Net loss attributable to noncontrolling interests 52 54 155 Interest expense, including Receivables Purchase Agreement ("RPA") and factoring financing fees (1) 28,684 28,771 48,690 Depreciation and amortization 133,512 104,056 96,530 Acquisition and divestiture related items (2) 541 7,898 5,293 Strategic initiatives and other charges (3) 34,310 31,045 13,923 Highly inflationary accounting losses (primarily non-cash) (4) — 1,473 1,360 Defined benefit plan termination related items (5) — (429) — Asset write-downs, net (6) — 10,050 — Goodwill write-downs (7) — 82,454 — Stock-based compensation 15,581 17,432 17,308 Non-service pension and postretirement expense (8) 5,837 31,823 1,640 Total Adjusted EBITDA $ 227,750 $ 210,408 $ 225,809 (1) Includes fees for receivables sold under the RPA and factoring arrangements totaling $4.0 million and $1.0 million for the fiscal years ended September 30, 2023 and 2022, respectively. (2) Includes certain non-recurring costs associated with recent acquisition and divestiture activities, and also includes a gain of $1.8 million in fiscal year 2023 related to the divestiture of a business in the Industrial Technologies segment. (3) Includes certain non-recurring costs associated with productivity and cost-reduction initiatives intended to result in improved operating performance, profitability and working capital levels and costs associated with global ERP system integration efforts totaling $6,168 and $13,923 for the three months ended September 30, 2023 and 2022, respectively, and $12,393 and $28,060 for the fiscal years ended September 30, 2023 and 2022, respectively, net of loss recoveries of $2,154 for the fiscal year ended September 30, 2023 related to a previously disclosed theft of funds by a former employee initially identified in fiscal 2015. Also includes certain non-recurring direct incremental costs (such as costs for purchases of computer peripherals and devices to facilitate working-from-home, additional personal protective equipment and cleaning supplies and services, etc.) incurred in response to COVID-19 totaling $781 and $2,985 for the three months and fiscal year ended September 30, 2022, respectively. This amount does not include the impact of any lost sales or underutilization due to COVID-19. (4) Represents exchange losses associated with highly inflationary accounting related to the Company's Turkish subsidiaries. (5) Represents items associated with the termination of the Company's DB Plan, supplemental retirement plan and the defined benefit portion of the officers retirement restoration plan. (6) Represents asset write-downs, net of recoveries within the SGK Brand Solutions segment. (7) Represents goodwill write-downs within the SGK Brand Solutions segment. (8) Non-service pension and postretirement expense includes interest cost, expected return on plan assets, amortization of actuarial gains and losses, curtailment gains and losses, and settlement gains and losses. These benefit cost components are excluded from adjusted EBITDA since they are primarily influenced by external market conditions that impact investment returns and interest (discount) rates. Curtailment gains and losses and settlement gains and losses are excluded from adjusted EBITDA since they generally result from certain non-recurring events, such as plan amendments to modify future benefits or settlements of plan obligations. The service cost and prior service cost components of pension and postretirement expense are included in the calculation of adjusted EBITDA, since they are considered to be a better reflection of the ongoing service-related costs of providing these benefits. Please note that GAAP pension and postretirement expense or the adjustment above are not necessarily indicative of the current or future cash flow requirements related to these employee benefit plans. * See Disclaimer (page 2) for Management’s assessment of supplemental information related to adjusted EBITDA. NON-GAAP RECONCILIATION (Unaudited) (In thousands, except per share data)
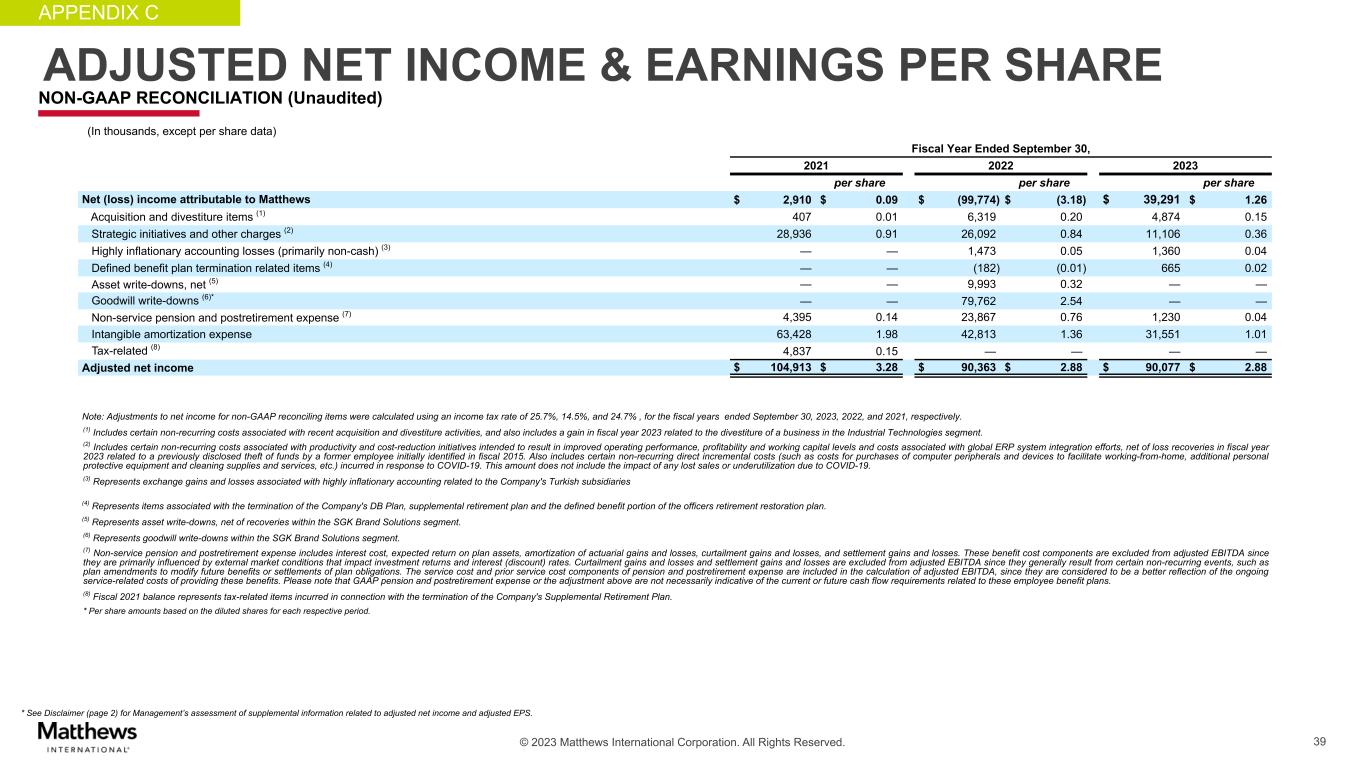
© 2023 Matthews International Corporation. All Rights Reserved. 39 APPENDIX C ADJUSTED NET INCOME & EARNINGS PER SHARE NON-GAAP RECONCILIATION (Unaudited) Fiscal Year Ended September 30, 2021 2022 2023 per share per share per share Net (loss) income attributable to Matthews $ 2,910 $ 0.09 $ (99,774) $ (3.18) $ 39,291 $ 1.26 Acquisition and divestiture items (1) 407 0.01 6,319 0.20 4,874 0.15 Strategic initiatives and other charges (2) 28,936 0.91 26,092 0.84 11,106 0.36 Highly inflationary accounting losses (primarily non-cash) (3) — — 1,473 0.05 1,360 0.04 Defined benefit plan termination related items (4) — — (182) (0.01) 665 0.02 Asset write-downs, net (5) — — 9,993 0.32 — — Goodwill write-downs (6)* — — 79,762 2.54 — — Non-service pension and postretirement expense (7) 4,395 0.14 23,867 0.76 1,230 0.04 Intangible amortization expense 63,428 1.98 42,813 1.36 31,551 1.01 Tax-related (8) 4,837 0.15 — — — — Adjusted net income $ 104,913 $ 3.28 $ 90,363 $ 2.88 $ 90,077 $ 2.88 Note: Adjustments to net income for non-GAAP reconciling items were calculated using an income tax rate of 25.7%, 14.5%, and 24.7% , for the fiscal years ended September 30, 2023, 2022, and 2021, respectively. (1) Includes certain non-recurring costs associated with recent acquisition and divestiture activities, and also includes a gain in fiscal year 2023 related to the divestiture of a business in the Industrial Technologies segment. (2) Includes certain non-recurring costs associated with productivity and cost-reduction initiatives intended to result in improved operating performance, profitability and working capital levels and costs associated with global ERP system integration efforts, net of loss recoveries in fiscal year 2023 related to a previously disclosed theft of funds by a former employee initially identified in fiscal 2015. Also includes certain non-recurring direct incremental costs (such as costs for purchases of computer peripherals and devices to facilitate working-from-home, additional personal protective equipment and cleaning supplies and services, etc.) incurred in response to COVID-19. This amount does not include the impact of any lost sales or underutilization due to COVID-19. (3) Represents exchange gains and losses associated with highly inflationary accounting related to the Company's Turkish subsidiaries (4) Represents items associated with the termination of the Company's DB Plan, supplemental retirement plan and the defined benefit portion of the officers retirement restoration plan. (5) Represents asset write-downs, net of recoveries within the SGK Brand Solutions segment. (6) Represents goodwill write-downs within the SGK Brand Solutions segment. (7) Non-service pension and postretirement expense includes interest cost, expected return on plan assets, amortization of actuarial gains and losses, curtailment gains and losses, and settlement gains and losses. These benefit cost components are excluded from adjusted EBITDA since they are primarily influenced by external market conditions that impact investment returns and interest (discount) rates. Curtailment gains and losses and settlement gains and losses are excluded from adjusted EBITDA since they generally result from certain non-recurring events, such as plan amendments to modify future benefits or settlements of plan obligations. The service cost and prior service cost components of pension and postretirement expense are included in the calculation of adjusted EBITDA, since they are considered to be a better reflection of the ongoing service-related costs of providing these benefits. Please note that GAAP pension and postretirement expense or the adjustment above are not necessarily indicative of the current or future cash flow requirements related to these employee benefit plans. (8) Fiscal 2021 balance represents tax-related items incurred in connection with the termination of the Company's Supplemental Retirement Plan. * Per share amounts based on the diluted shares for each respective period. * See Disclaimer (page 2) for Management’s assessment of supplemental information related to adjusted net income and adjusted EPS. (In thousands, except per share data)
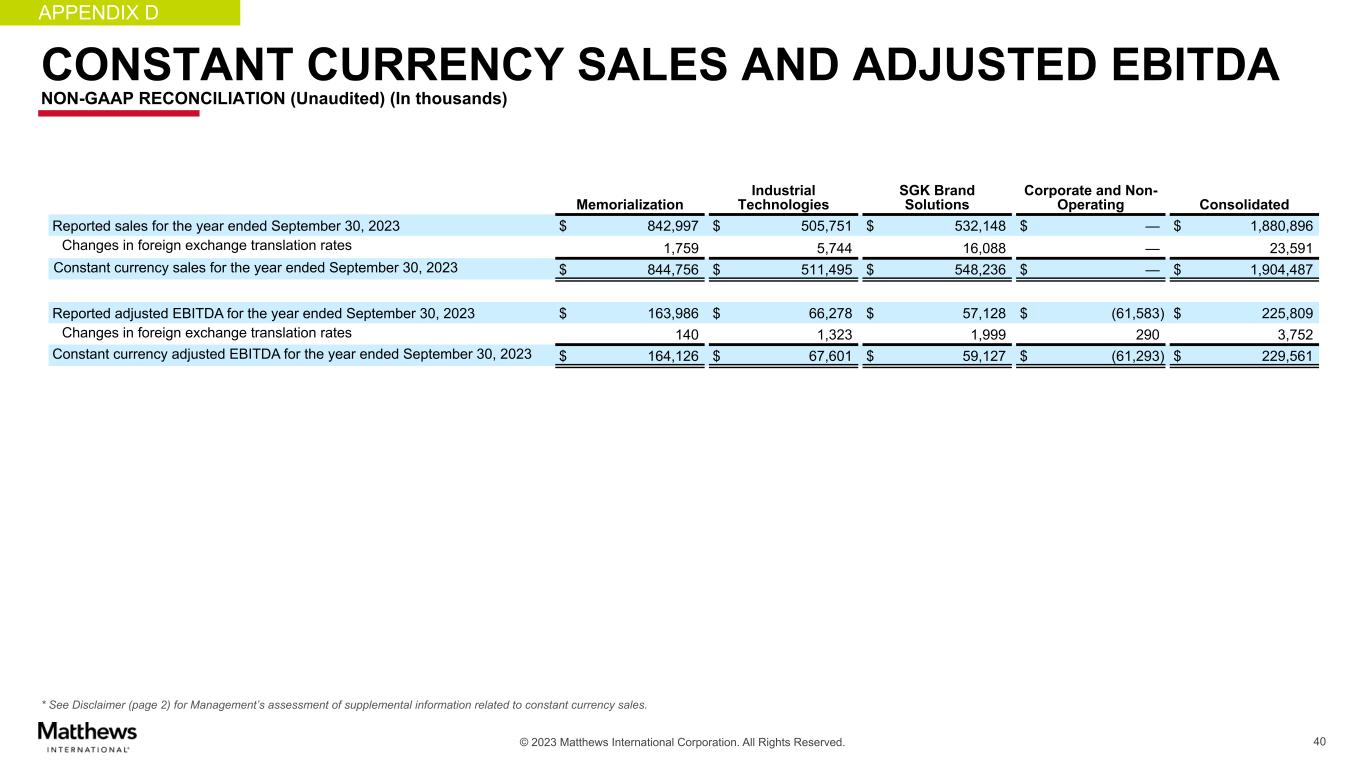
© 2023 Matthews International Corporation. All Rights Reserved. * See Disclaimer (page 2) for Management’s assessment of supplemental information related to constant currency sales. 40 CONSTANT CURRENCY SALES AND ADJUSTED EBITDA NON-GAAP RECONCILIATION (Unaudited) (In thousands) Memorialization Industrial Technologies SGK Brand Solutions Corporate and Non- Operating Consolidated Reported sales for the year ended September 30, 2023 $ 842,997 $ 505,751 $ 532,148 $ — $ 1,880,896 Changes in foreign exchange translation rates 1,759 5,744 16,088 — 23,591 Constant currency sales for the year ended September 30, 2023 $ 844,756 $ 511,495 $ 548,236 $ — $ 1,904,487 Reported adjusted EBITDA for the year ended September 30, 2023 $ 163,986 $ 66,278 $ 57,128 $ (61,583) $ 225,809 Changes in foreign exchange translation rates 140 1,323 1,999 290 3,752 Constant currency adjusted EBITDA for the year ended September 30, 2023 $ 164,126 $ 67,601 $ 59,127 $ (61,293) $ 229,561 APPENDIX D 40
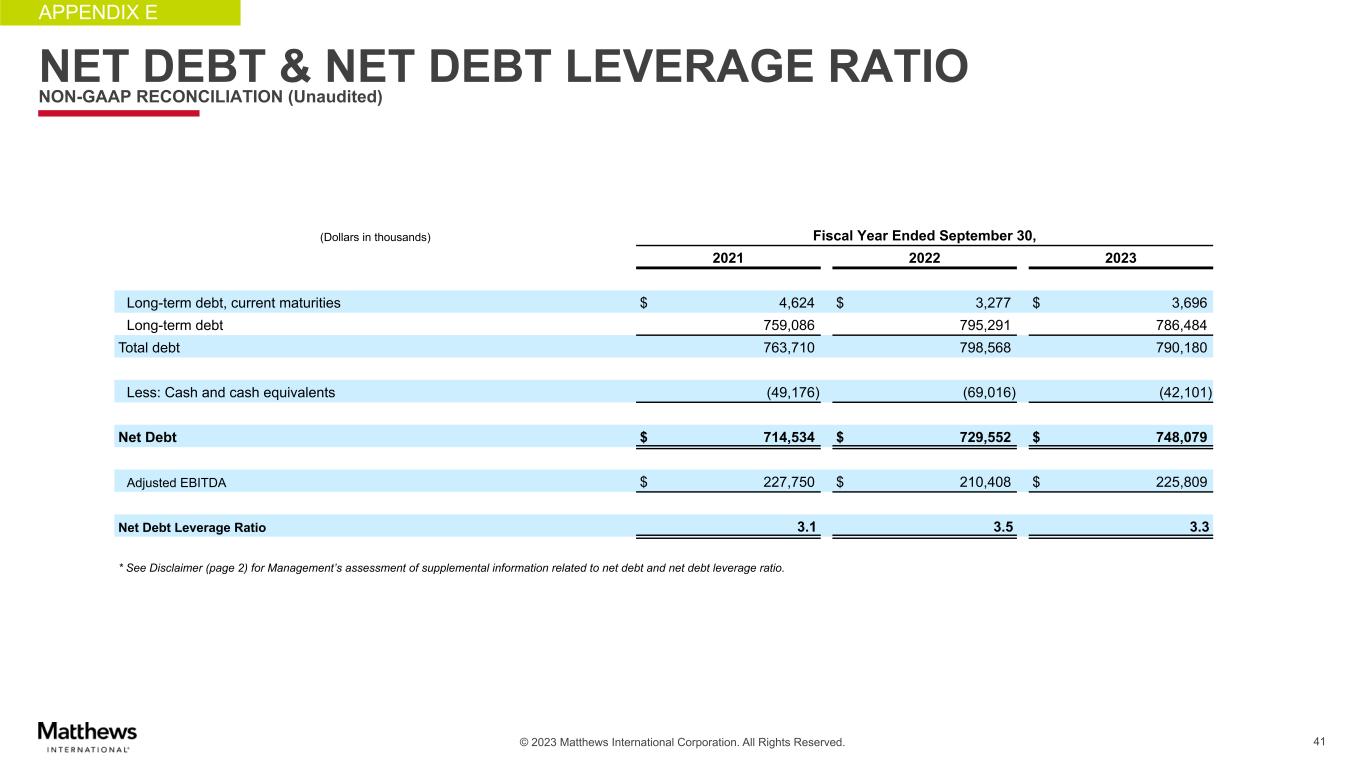
© 2023 Matthews International Corporation. All Rights Reserved. 41 APPENDIX E NET DEBT & NET DEBT LEVERAGE RATIO NON-GAAP RECONCILIATION (Unaudited) (Dollars in thousands) Fiscal Year Ended September 30, 2021 2022 2023 Long-term debt, current maturities $ 4,624 $ 3,277 $ 3,696 Long-term debt 759,086 795,291 786,484 Total debt 763,710 798,568 790,180 Less: Cash and cash equivalents (49,176) (69,016) (42,101) Net Debt $ 714,534 $ 729,552 $ 748,079 Adjusted EBITDA $ 227,750 $ 210,408 $ 225,809 Net Debt Leverage Ratio 3.1 3.5 3.3 * See Disclaimer (page 2) for Management’s assessment of supplemental information related to net debt and net debt leverage ratio.
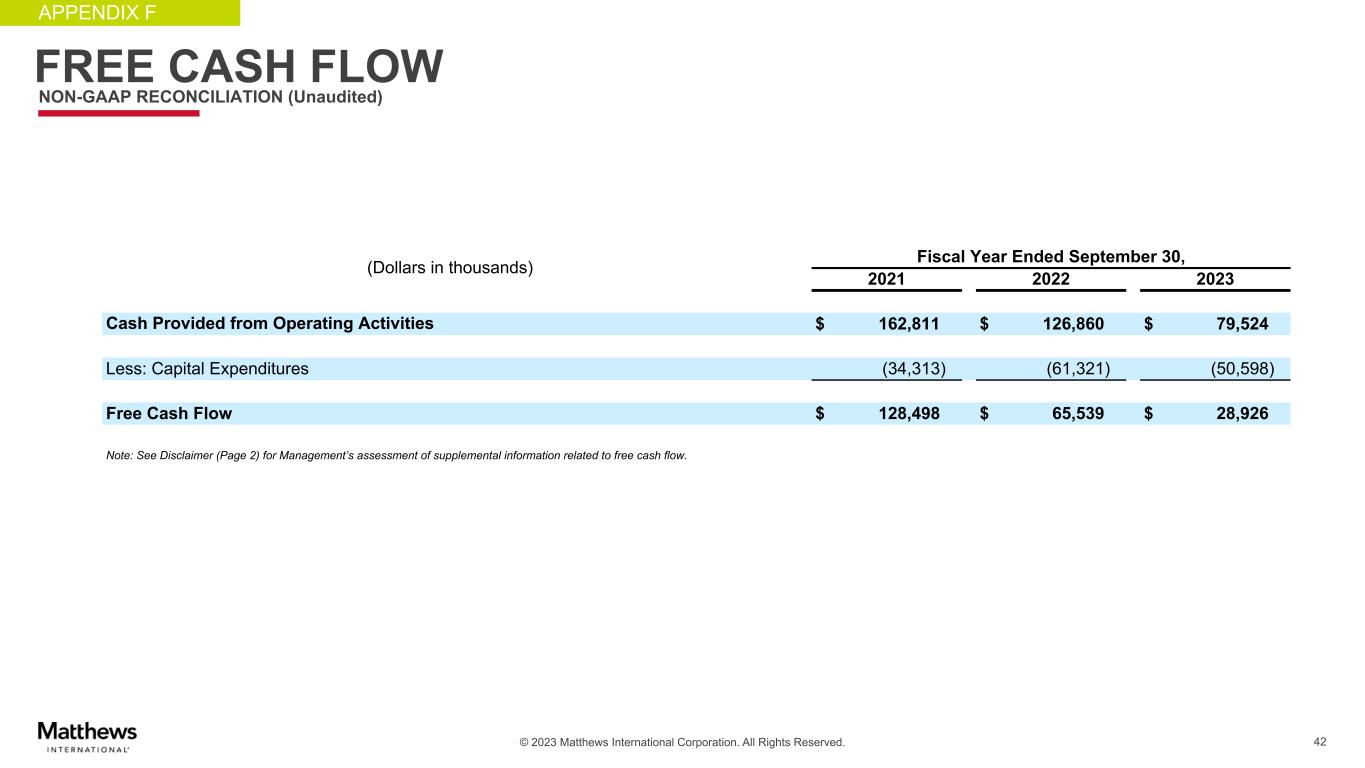
© 2023 Matthews International Corporation. All Rights Reserved. 42 APPENDIX F FREE CASH FLOW NON-GAAP RECONCILIATION (Unaudited) (Dollars in thousands) Fiscal Year Ended September 30, 2021 2022 2023 Cash Provided from Operating Activities $ 162,811 $ 126,860 $ 79,524 Less: Capital Expenditures (34,313) (61,321) (50,598) Free Cash Flow $ 128,498 $ 65,539 $ 28,926 Note: See Disclaimer (Page 2) for Management’s assessment of supplemental information related to free cash flow.
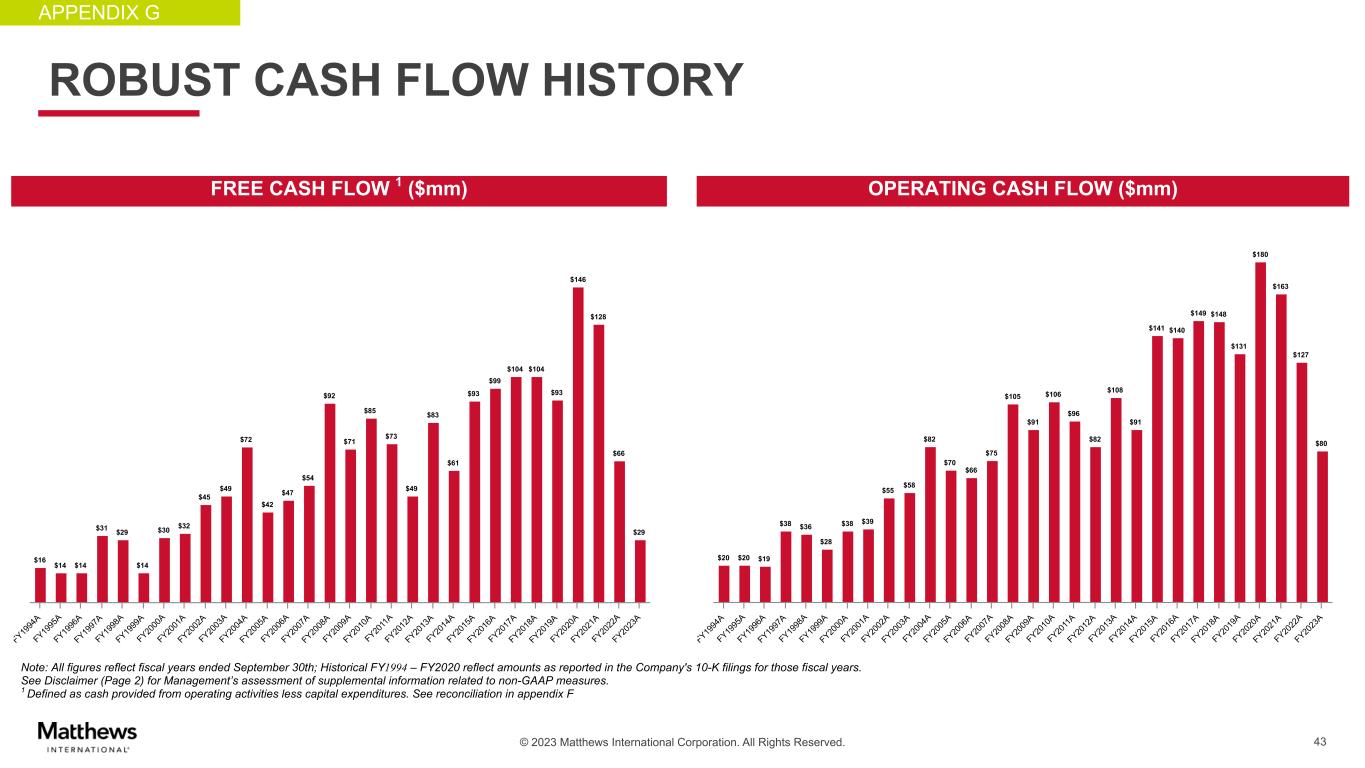
© 2023 Matthews International Corporation. All Rights Reserved. 43 Note: All figures reflect fiscal years ended September 30th; Historical FY1994 – FY2020 reflect amounts as reported in the Company's 10-K filings for those fiscal years. See Disclaimer (Page 2) for Management’s assessment of supplemental information related to non-GAAP measures. 1 Defined as cash provided from operating activities less capital expenditures. See reconciliation in appendix F OPERATING CASH FLOW ($mm)FREE CASH FLOW 1 ($mm) ROBUST CASH FLOW HISTORY APPENDIX G $16 $14 $14 $31 $29 $14 $30 $32 $45 $49 $72 $42 $47 $54 $92 $71 $85 $73 $49 $83 $61 $93 $99 $104 $104 $93 $146 $128 $66 $29 FY19 94 A FY19 95 A FY19 96 A FY19 97 A FY19 98 A FY19 99 A FY20 00 A FY20 01 A FY20 02 A FY20 03 A FY20 04 A FY20 05 A FY20 06 A FY20 07 A FY20 08 A FY20 09 A FY20 10 A FY20 11 A FY20 12 A FY20 13 A FY20 14 A FY20 15 A FY20 16 A FY20 17 A FY20 18 A FY20 19 A FY20 20 A FY20 21 A FY20 22 A FY20 23 A $20 $20 $19 $38 $36 $28 $38 $39 $55 $58 $82 $70 $66 $75 $105 $91 $106 $96 $82 $108 $91 $141 $140 $149 $148 $131 $180 $163 $127 $80 FY19 94 A FY19 95 A FY19 96 A FY19 97 A FY19 98 A FY19 99 A FY20 00 A FY20 01 A FY20 02 A FY20 03 A FY20 04 A FY20 05 A FY20 06 A FY20 07 A FY20 08 A FY20 09 A FY20 10 A FY20 11 A FY20 12 A FY20 13 A FY20 14 A FY20 15 A FY20 16 A FY20 17 A FY20 18 A FY20 19 A FY20 20 A FY20 21 A FY20 22 A FY20 23 A