
DECEMBER 2021 INVESTOR PRESENTATON FISCAL YEAR 2021 BUSINESS AND FINANCIAL HIGHLIGHTS; CHANGES TO REPORTING SEGMENTS www.matw.com | Nasdaq: MATW Exhibit 99.1
DISCLAIMER Any forward-looking statements contained in this presentation are included pursuant to the “safe harbor” provisions of the Private Securities Litigation Reform Act of 1995. Such forward-looking statements involve known and unknown risks and uncertainties that may cause the Company’s actual results in future periods to be materially different from management’s expectations. Although the Company believes that the expectations reflected in such forward-looking statements are reasonable, no assurance can be given that such expectations will prove correct. Factors that could cause the Company's results to differ materially from the results discussed in such forward-looking statements principally include changes in domestic or international economic conditions, changes in foreign currency exchange rates, changes in the cost of materials used in the manufacture of the Company's products, changes in mortality and cremation rates, changes in product demand or pricing as a result of consolidation in the industries in which the Company operates or other factors such as supply chain disruptions, labor shortages or labor cost increases, changes in product demand or pricing as a result of domestic or international competitive pressures, ability to achieve cost-reduction objectives, unknown risks in connection with the Company's acquisitions, cybersecurity concerns, labor shortages or labor cost increases, effectiveness of the Company's internal controls, compliance with domestic and foreign laws and regulations, technological factors beyond the Company's control, impact of pandemics or similar outbreaks, such as coronavirus disease 2019 ("COVID-19") or other disruptions to our industries, customers or supply chains, and other factors described in the Company’s Annual Report on Form 10-K and other periodic filings with the U.S. Securities and Exchange Commission (“SEC”). The information contained in this presentation, including any financial data, is made as of September 30, 2021 unless otherwise noted. The Company does not, and is not obligated to, update this information after the date of such information. Included in this report are measures of financial performance that are not defined by generally accepted accounting principles in the United States (“GAAP”). The Company uses non-GAAP financial measures to assist in comparing its performance on a consistent basis for purposes of business decision-making by removing the impact of certain items that management believes do not directly reflect the Company’s core operations including acquisition costs, ERP integration costs, strategic initiative and other charges (which includes non-recurring charges related to operational initiatives and exit activities), stock-based compensation, the non-service portion of pension and postretirement expense, legal matter reserves, non-recurring/incremental COVID-19 costs, and joint venture depreciation, amortization, interest expenses and other charges. Management believes that presenting non-GAAP financial measures is useful to investors because it (i) provides investors with meaningful supplemental information regarding financial performance by excluding certain items that management believes do not directly reflect the Company’s core operations, (ii) permits investors to view performance using the same tools that management uses to budget, forecast, make operating and strategic decisions, and evaluate historical performance, and (iii) otherwise provides supplemental information that may be useful to investors in evaluating the Company’s results. The Company believes that the presentation of these non-GAAP financial measures, when considered together with the corresponding GAAP financial measures and the reconciliations to those measures, provided herein, provides investors with an additional understanding of the factors and trends affecting the Company’s business that could not be obtained absent these disclosures. The Company believes that adjusted EBITDA provides relevant and useful information, which is used by the Company’s management in assessing the performance of its business. Adjusted EBITDA is defined by the Company as earnings before interest, income taxes, depreciation, amortization and certain non-cash and/or non-recurring items that do not contribute directly to management’s evaluation of its operating results. These items include stock-based compensation, the non-service portion of pension and postretirement expense, acquisition costs, ERP integration costs, and strategic initiatives and other charges. Adjusted EBITDA provides the Company with an understanding of earnings before the impact of investing and financing charges and income taxes, and the effects of certain acquisition and ERP integration costs, and other items that do not reflect the ordinary earnings of the Company’s operations. This measure may be useful to an investor in evaluating operating performance. It is also useful as a financial measure for lenders and is used by the Company’s management to measure business performance. In this presentation, the Company has also presented adjusted EBITDA margin, which the Company believes may help investors assess its business by providing the margin that adjusted EBITDA represents to sales. Adjusted EBITDA and adjusted EBITDA margin are not measures of the Company's financial performance under GAAP and should not be considered as alternatives to net income or other performance measures derived in accordance with GAAP, or as alternatives to cash flow from operating activities as a measure of the Company's liquidity. The Company's definitions of adjusted EBITDA and adjusted EBITDA margin may not be comparable to similarly titled measures used by other companies. The Company has also presented net debt and a net debt leverage ratio, which is referred to herein as “financial leverage”, and believes each measure provides relevant and useful information, which is widely used by analysts and investors as well as by our management. These measures provide management with insight on the indebtedness of the Company, net of cash and cash equivalents and relative to adjusted EBITDA. These measures allow management, as well as analysts and investors, to assess the Company’s leverage. Lastly, the Company has presented free cash flow and free cash flow conversion as supplemental measures of cash flow that are not required by, or presented in accordance with, GAAP. Management believes that these measures provide relevant and useful information, which is widely used by analysts and investors as well as by our management. These measures provide management with insight on the cash generated by operations, excluding capital expenditures and the efficiency of such free cash flow. These measures allow management, as well as analysts and investors, to assess the Company’s ability to pursue growth and investment opportunities designed to increase shareholder value.
BUSINESS OVERVIEW
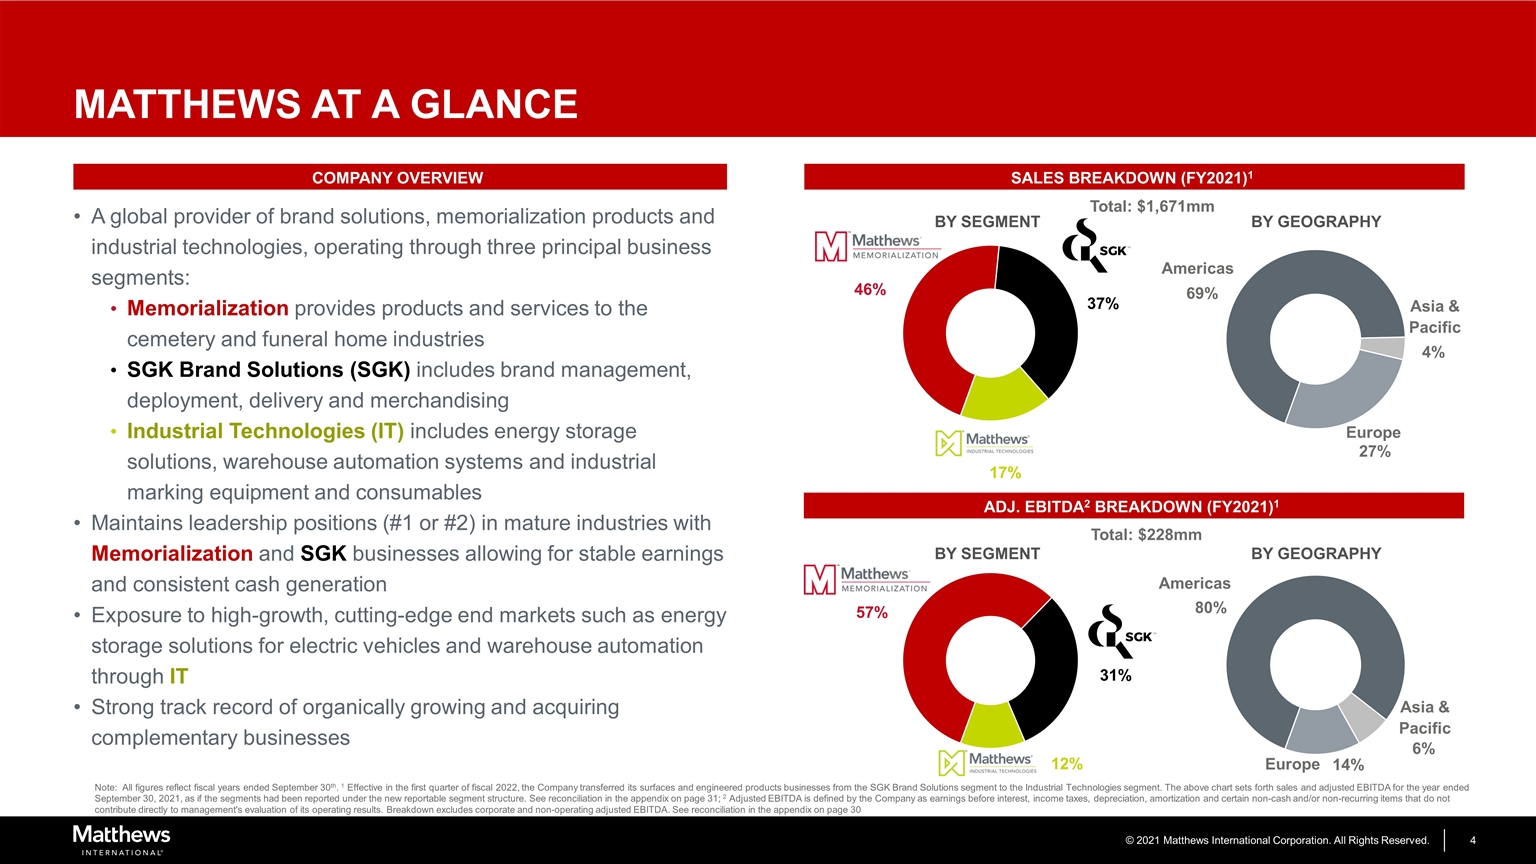
Note: All figures reflect fiscal years ended September 30th. 1 Effective in the first quarter of fiscal 2022, the Company transferred its surfaces and engineered products businesses from the SGK Brand Solutions segment to the Industrial Technologies segment. The above chart sets forth sales and adjusted EBITDA for the year ended September 30, 2021, as if the segments had been reported under the new reportable segment structure. See reconciliation in the appendix on page 31; 2 Adjusted EBITDA is defined by the Company as earnings before interest, income taxes, depreciation, amortization and certain non-cash and/or non-recurring items that do not contribute directly to management's evaluation of its operating results. Breakdown excludes corporate and non-operating adjusted EBITDA. See reconciliation in the appendix on page 30 Americas Europe Asia & Pacific BY GEOGRAPHY MATTHEWS AT A GLANCE A global provider of brand solutions, memorialization products and industrial technologies, operating through three principal business segments: Memorialization provides products and services to the cemetery and funeral home industries SGK Brand Solutions (SGK) includes brand management, deployment, delivery and merchandising Industrial Technologies (IT) includes energy storage solutions, warehouse automation systems and industrial marking equipment and consumables Maintains leadership positions (#1 or #2) in mature industries with Memorialization and SGK businesses allowing for stable earnings and consistent cash generation Exposure to high-growth, cutting-edge end markets such as energy storage solutions for electric vehicles and warehouse automation through IT Strong track record of organically growing and acquiring complementary businesses SALES BREAKDOWN (FY2021)1 BY SEGMENT COMPANY OVERVIEW ADJ. EBITDA2 BREAKDOWN (FY2021)1 Americas Europe Asia & Pacific BY GEOGRAPHY BY SEGMENT Total: $1,671mm Total: $228mm
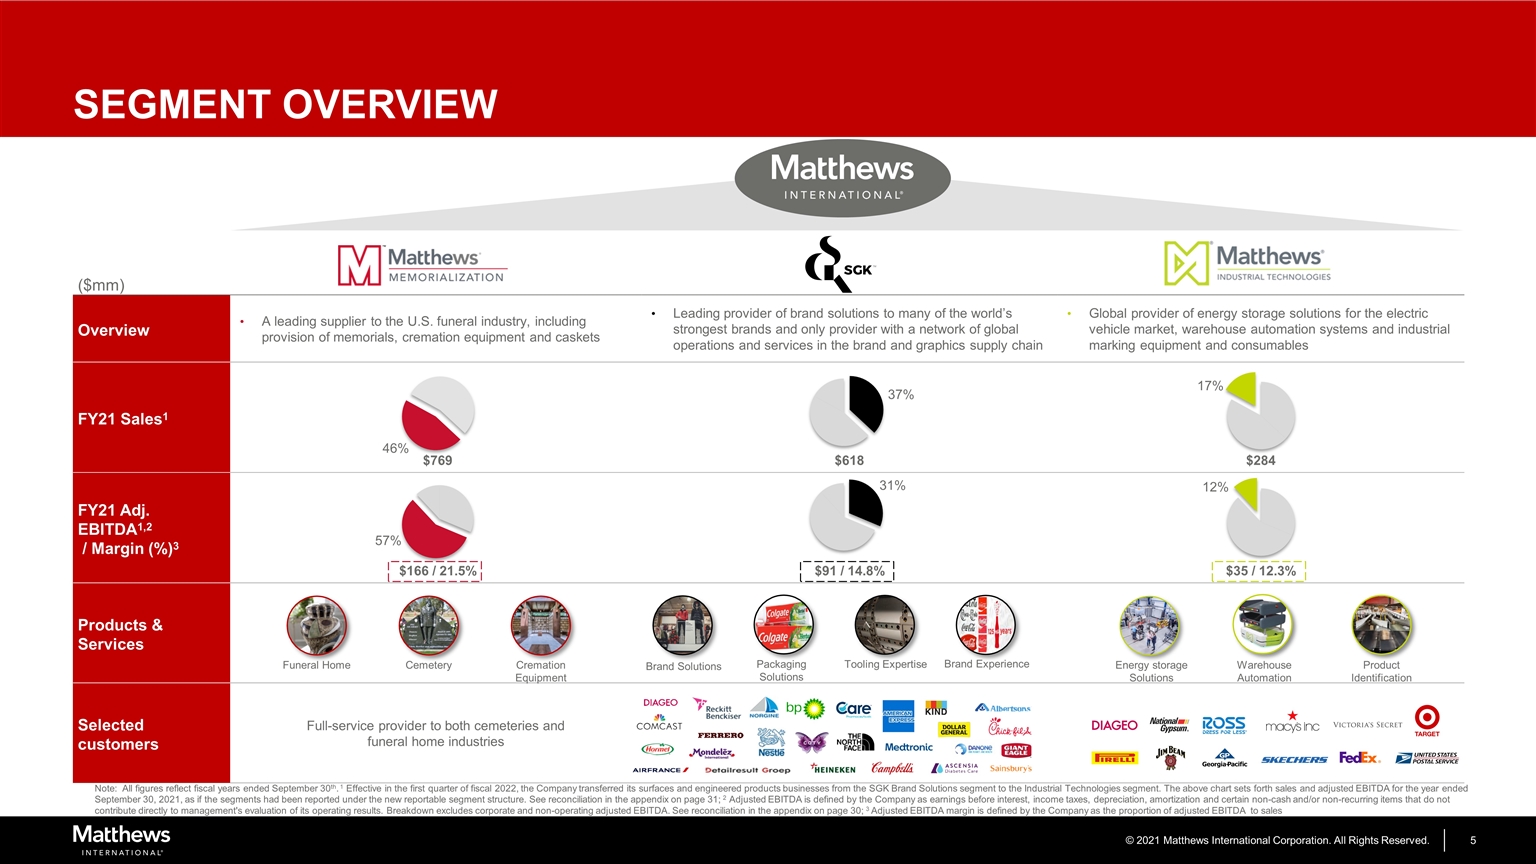
($mm) Overview A leading supplier to the U.S. funeral industry, including provision of memorials, cremation equipment and caskets Leading provider of brand solutions to many of the world’s strongest brands and only provider with a network of global operations and services in the brand and graphics supply chain Global provider of energy storage solutions for the electric vehicle market, warehouse automation systems and industrial marking equipment and consumables FY21 Sales1 $769 $618 $284 FY21 Adj. EBITDA1,2 / Margin (%)3 $166 / 21.5% $91 / 14.8% $35 / 12.3% Products & Services Selected customers Full-service provider to both cemeteries and funeral home industries SEGMENT OVERVIEW Warehouse Automation Product Identification Brand Solutions Packaging Solutions Tooling Expertise Brand Experience Funeral Home Cemetery Cremation Equipment Energy storage Solutions Note: All figures reflect fiscal years ended September 30th. 1 Effective in the first quarter of fiscal 2022, the Company transferred its surfaces and engineered products businesses from the SGK Brand Solutions segment to the Industrial Technologies segment. The above chart sets forth sales and adjusted EBITDA for the year ended September 30, 2021, as if the segments had been reported under the new reportable segment structure. See reconciliation in the appendix on page 31; 2 Adjusted EBITDA is defined by the Company as earnings before interest, income taxes, depreciation, amortization and certain non-cash and/or non-recurring items that do not contribute directly to management's evaluation of its operating results. Breakdown excludes corporate and non-operating adjusted EBITDA. See reconciliation in the appendix on page 30; 3 Adjusted EBITDA margin is defined by the Company as the proportion of adjusted EBITDA to sales
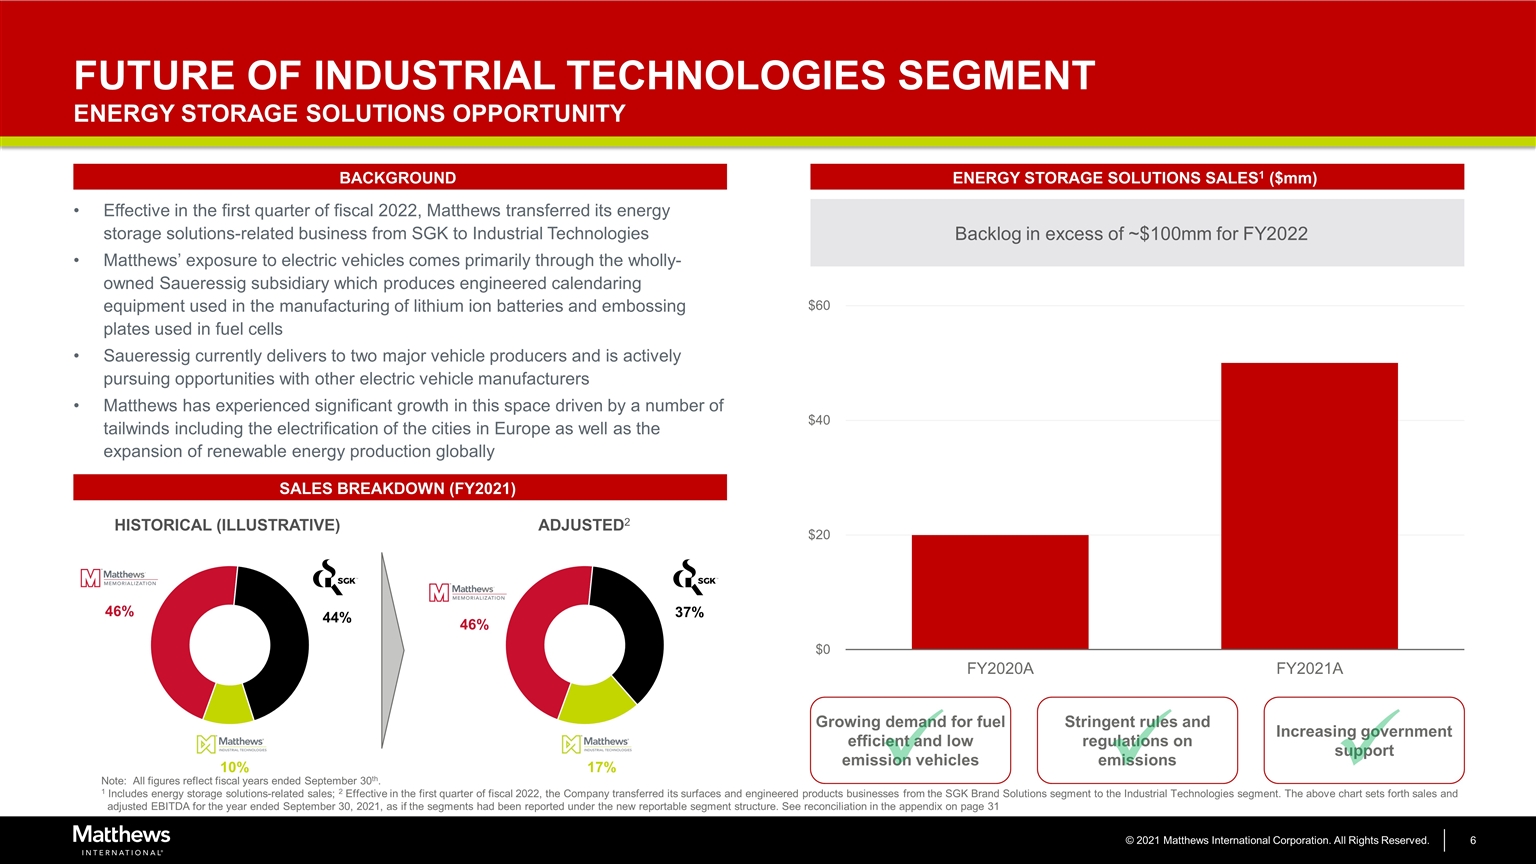
Stringent rules and regulations on emissions Growing demand for fuel efficient and low emission vehicles Increasing government support FUTURE OF INDUSTRIAL TECHNOLOGIES SEGMENT ENERGY STORAGE SOLUTIONS OPPORTUNITY Effective in the first quarter of fiscal 2022, Matthews transferred its energy storage solutions-related business from SGK to Industrial Technologies Matthews’ exposure to electric vehicles comes primarily through the wholly-owned Saueressig subsidiary which produces engineered calendaring equipment used in the manufacturing of lithium ion batteries and embossing plates used in fuel cells Saueressig currently delivers to two major vehicle producers and is actively pursuing opportunities with other electric vehicle manufacturers Matthews has experienced significant growth in this space driven by a number of tailwinds including the electrification of the cities in Europe as well as the expansion of renewable energy production globally BACKGROUND ENERGY STORAGE SOLUTIONS SALES1 ($mm) SALES BREAKDOWN (FY2021) ADJUSTED2 HISTORICAL (ILLUSTRATIVE) ü ü ü Note: All figures reflect fiscal years ended September 30th. 1 Includes energy storage solutions-related sales; 2 Effective in the first quarter of fiscal 2022, the Company transferred its surfaces and engineered products businesses from the SGK Brand Solutions segment to the Industrial Technologies segment. The above chart sets forth sales and adjusted EBITDA for the year ended September 30, 2021, as if the segments had been reported under the new reportable segment structure. See reconciliation in the appendix on page 31 Backlog in excess of ~$100mm for FY2022
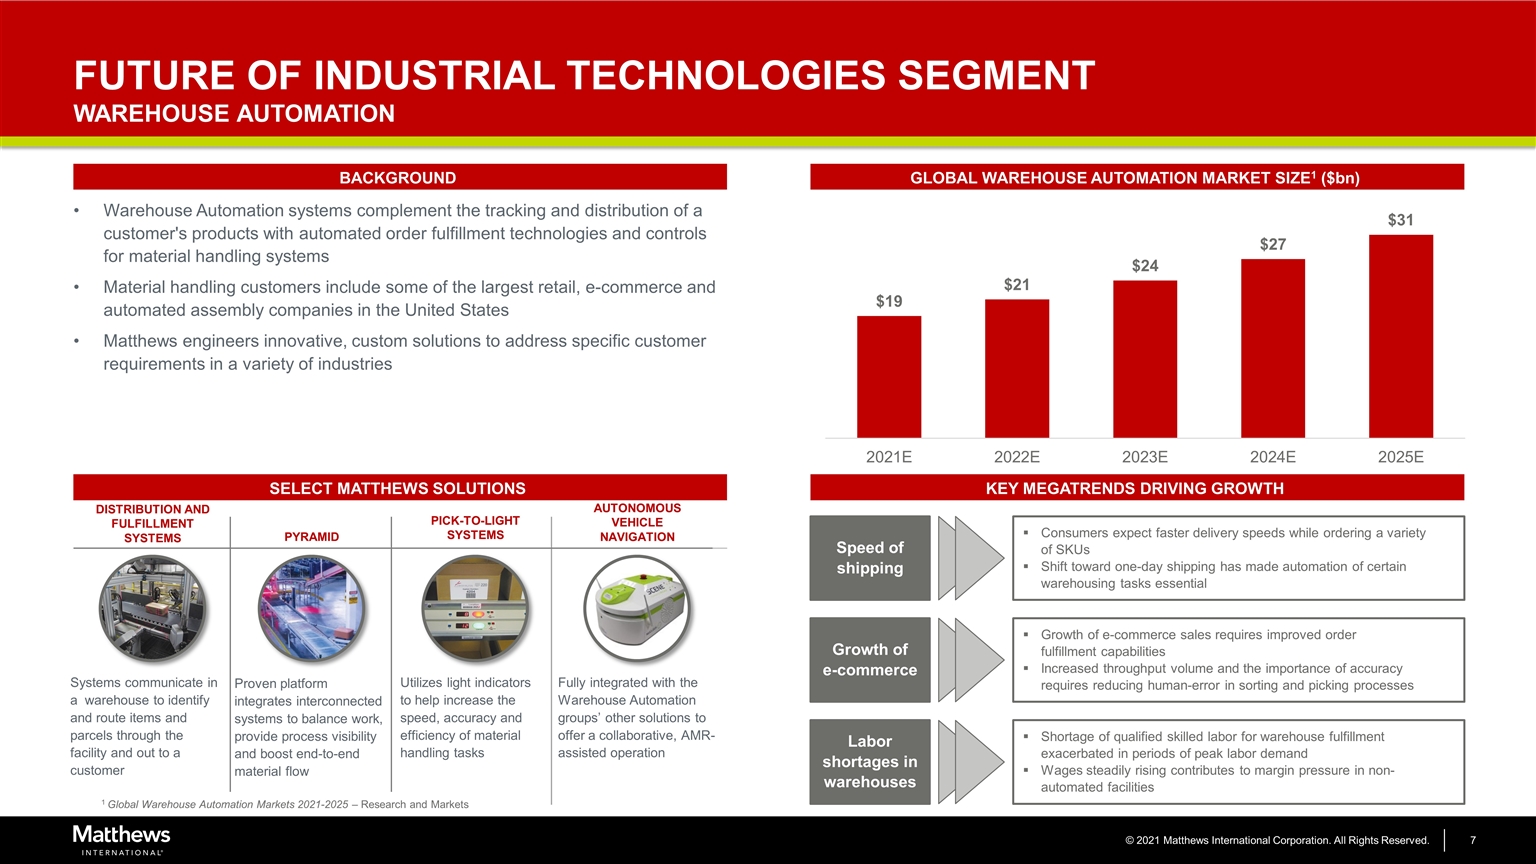
FUTURE OF INDUSTRIAL TECHNOLOGIES SEGMENT WAREHOUSE AUTOMATION Systems communicate in a warehouse to identify and route items and parcels through the facility and out to a customer DISTRIBUTION AND FULFILLMENT SYSTEMS PYRAMID PICK-TO-LIGHT SYSTEMS AUTONOMOUS VEHICLE NAVIGATION Proven platform integrates interconnected systems to balance work, provide process visibility and boost end-to-end material flow Utilizes light indicators to help increase the speed, accuracy and efficiency of material handling tasks Fully integrated with the Warehouse Automation groups’ other solutions to offer a collaborative, AMR-assisted operation GLOBAL WAREHOUSE AUTOMATION MARKET SIZE1 ($bn) BACKGROUND SELECT MATTHEWS SOLUTIONS Warehouse Automation systems complement the tracking and distribution of a customer's products with automated order fulfillment technologies and controls for material handling systems Material handling customers include some of the largest retail, e-commerce and automated assembly companies in the United States Matthews engineers innovative, custom solutions to address specific customer requirements in a variety of industries KEY MEGATRENDS DRIVING GROWTH Consumers expect faster delivery speeds while ordering a variety of SKUs Shift toward one-day shipping has made automation of certain warehousing tasks essential Speed of shipping Growth of e-commerce sales requires improved order fulfillment capabilities Increased throughput volume and the importance of accuracy requires reducing human-error in sorting and picking processes Growth of e-commerce Shortage of qualified skilled labor for warehouse fulfillment exacerbated in periods of peak labor demand Wages steadily rising contributes to margin pressure in non-automated facilities Labor shortages in warehouses 1 Global Warehouse Automation Markets 2021-2025 – Research and Markets

FUTURE OF INDUSTRIAL TECHNOLOGIES SEGMENT INKJET ORGANIC GROWTH OPPORTUNITY Product identification dates back to Matthews’ original branding irons and hand stamps from the 1850s Matthews identified a significant market opportunity to displace incumbent continuous inkjet (CIJ) technology, which is complex, generally unreliable and requires complete rebuilds every two years, with new inkjet technology Team spent ~12+ years developing a new technology that culminated in a product that is more reliable, experiences less downtime and results in approximately 75% lower cost of ownership versus legacy products BACKGROUND MARKET OPPORTUNITY1 NEW TECHNOLOGY VALUE PROPOSITION CIJ HEAD (CONTINUOUS INKJET) NEW TECHNOLOGY 75% LOWER COST OF OWNERSHIP VERSUS LEGACY PRODUCTS Continuous Inkjet 46% Laser 15% Print & Apply 11% Drop-on-Demand 28% Limited Offering Matthews A Market Leader New Market Opportunity (~$1.8bn) $3.8bn Significant market opportunity for organically developed product IMPROVED RELIABILITY REDUCED DOWNTIME 1 Total marking and coding industry per Technavio (2019)

BUSINESS UPDATE AND OPPORTUNITIES BUSINESS UPDATE GROWTH OPPORTUNITIES Strong results in FY2021 including positive growth in consolidated sales and adjusted EBITDA despite challenging operating environment Consolidated sales and adjusted EBITDA of $1.7bn and $228mm1 (13.6% margin2), respectively Continue to demonstrate resiliency of business units through COVID-19 with liquidity of approximately $457mm3 Generated strong operating cash flow, which allowed for $200mm of debt repayment since the beginning of the COVID-19 pandemic in March 2020 Settled defined benefit plans eliminating ~$140mm of pension obligations from the balance sheet by October 2022 Memorialization experiencing stable demand complemented by growth in cremation and new, innovative solutions driving margin enhancement SGK benefitting from recovery in retail in post-COVID environment and strong tailwinds from growing digital and social media channels continuing to disrupt traditional marketing approach Industrial Technologies seeing strong growth avenues: Energy storage solutions: High-growth, high-margin battery business supported by global vehicle electrification Warehouse automation: Growth in retail e-commerce and rapid fulfillment accelerated by the pandemic Inkjet: Highly disruptive opportunity with new product resulting in lower total cost of ownership for customers 1 Total adjusted EBITDA is defined by the Company as earnings before interest, income taxes, depreciation, amortization and certain non-cash and/or non-recurring items that do not contribute directly to management's evaluation of its operating results. See reconciliation in the appendix on page 30; 2 Defined as the proportion of adjusted EBITDA to sales; 3 Defined as cash of $49mm plus unused revolver capacity of $408mm as of 9/30/21
KEY CREDIT HIGHLIGHTS
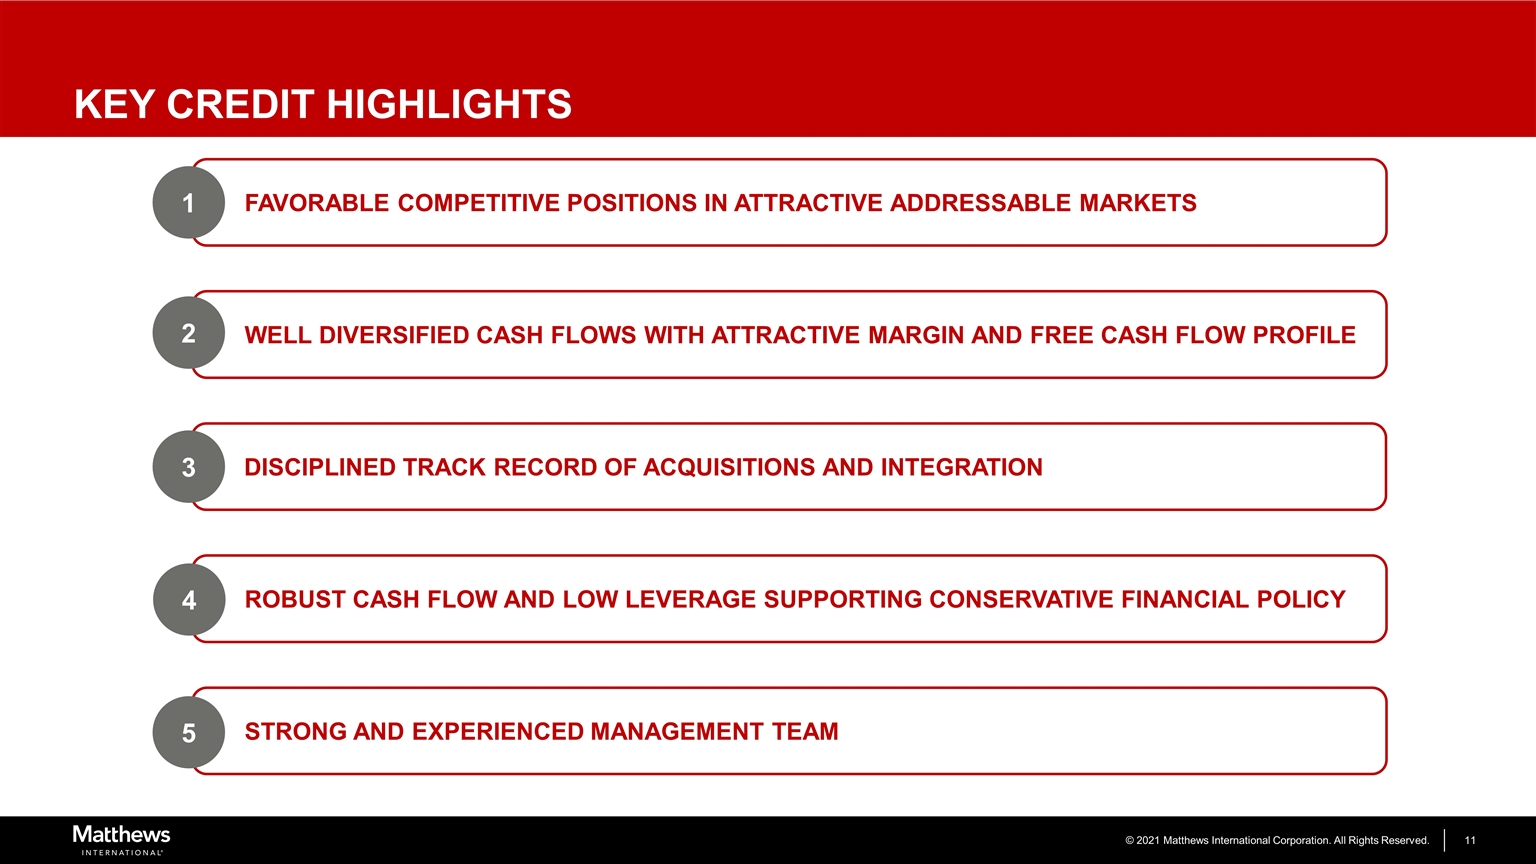
KEY CREDIT HIGHLIGHTS FAVORABLE COMPETITIVE POSITIONS IN ATTRACTIVE ADDRESSABLE MARKETS DISCIPLINED TRACK RECORD OF ACQUISITIONS AND INTEGRATION ROBUST CASH FLOW AND LOW LEVERAGE SUPPORTING CONSERVATIVE FINANCIAL POLICY Well diversified cash flows with attractive margin and Free Cash Flow profile STRONG AND EXPERIENCED MANAGEMENT TEAM 1 2 4 5 3
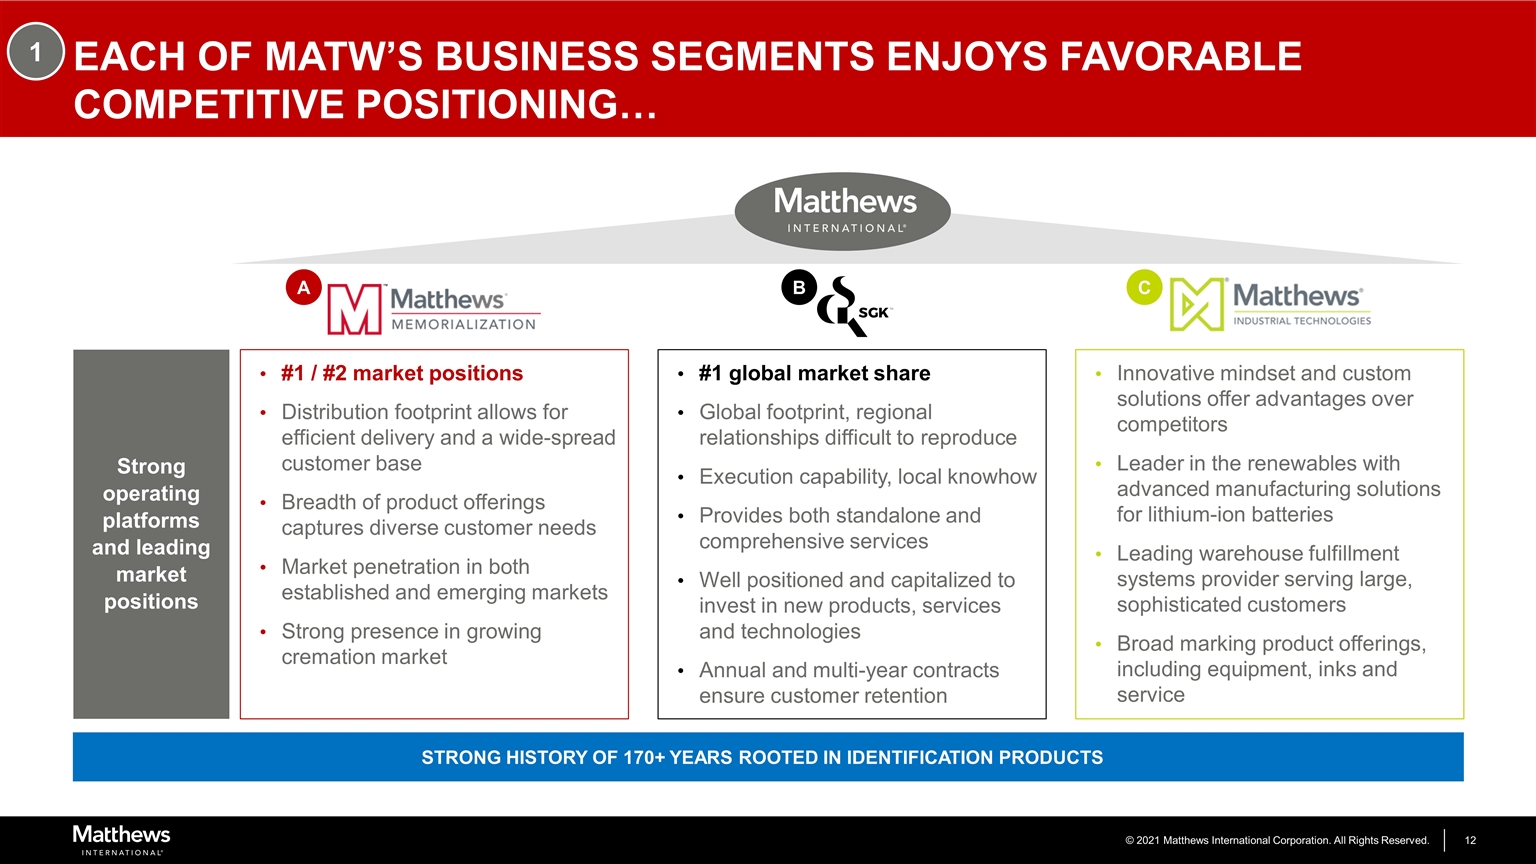
Each of MATW’s business segments enjoys favorable competitive positioning… A B C Strong operating platforms and leading market positions STRONG HISTORY OF 170+ YEARS ROOTED IN IDENTIFICATION PRODUCTS #1 / #2 market positions Distribution footprint allows for efficient delivery and a wide-spread customer base Breadth of product offerings captures diverse customer needs Market penetration in both established and emerging markets Strong presence in growing cremation market #1 global market share Global footprint, regional relationships difficult to reproduce Execution capability, local knowhow Provides both standalone and comprehensive services Well positioned and capitalized to invest in new products, services and technologies Annual and multi-year contracts ensure customer retention Innovative mindset and custom solutions offer advantages over competitors Leader in the renewables with advanced manufacturing solutions for lithium-ion batteries Leading warehouse fulfillment systems provider serving large, sophisticated customers Broad marking product offerings, including equipment, inks and service 1
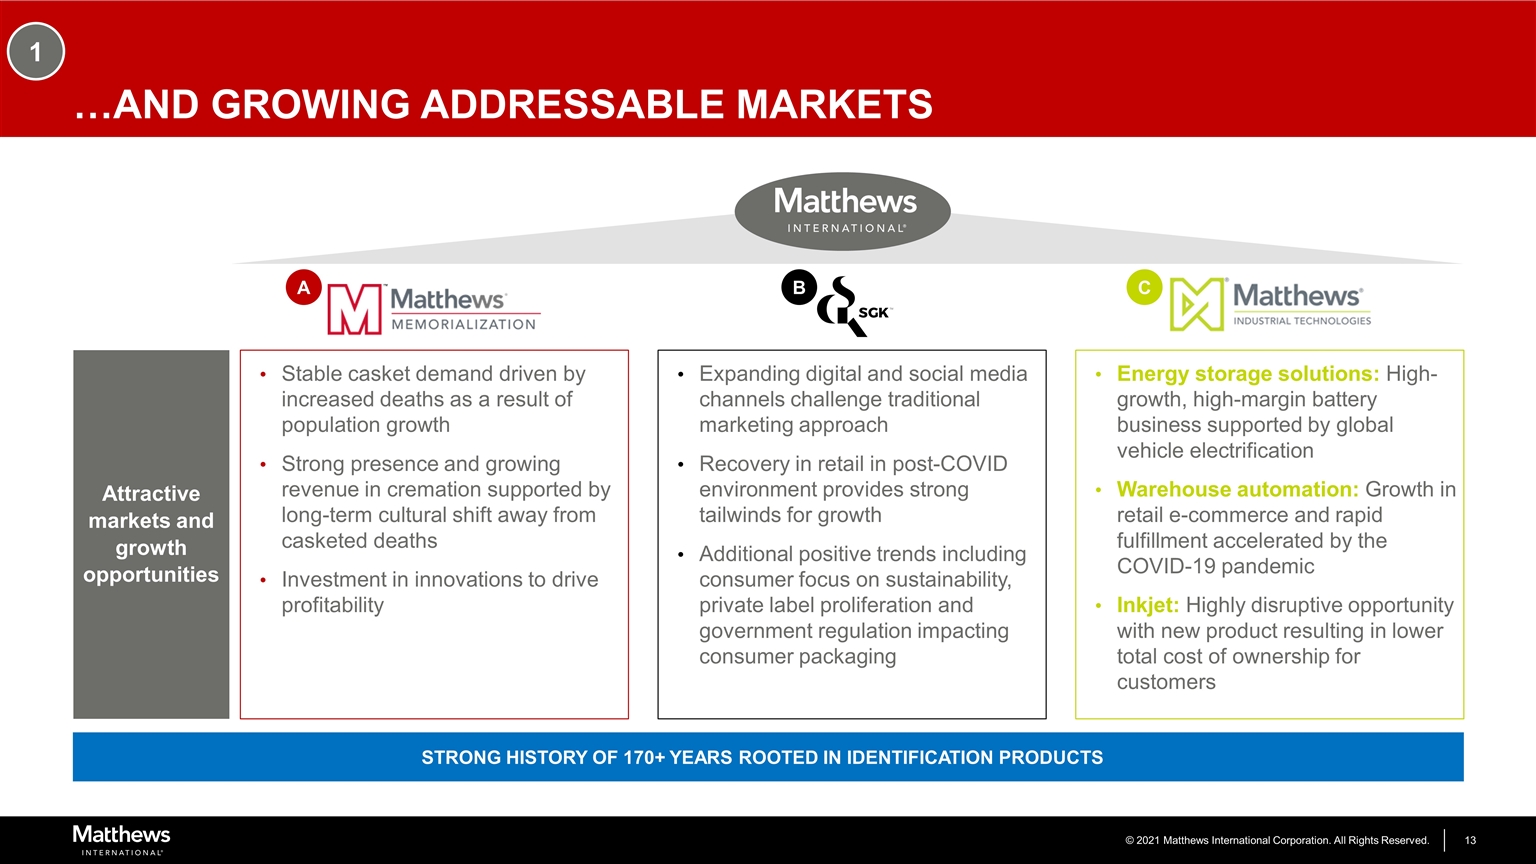
A B C Attractive markets and growth opportunities Stable casket demand driven by increased deaths as a result of population growth Strong presence and growing revenue in cremation supported by long-term cultural shift away from casketed deaths Investment in innovations to drive profitability Expanding digital and social media channels challenge traditional marketing approach Recovery in retail in post-COVID environment provides strong tailwinds for growth Additional positive trends including consumer focus on sustainability, private label proliferation and government regulation impacting consumer packaging Energy storage solutions: High-growth, high-margin battery business supported by global vehicle electrification Warehouse automation: Growth in retail e-commerce and rapid fulfillment accelerated by the COVID-19 pandemic Inkjet: Highly disruptive opportunity with new product resulting in lower total cost of ownership for customers …and growing addressable markets 1 STRONG HISTORY OF 170+ YEARS ROOTED IN IDENTIFICATION PRODUCTS
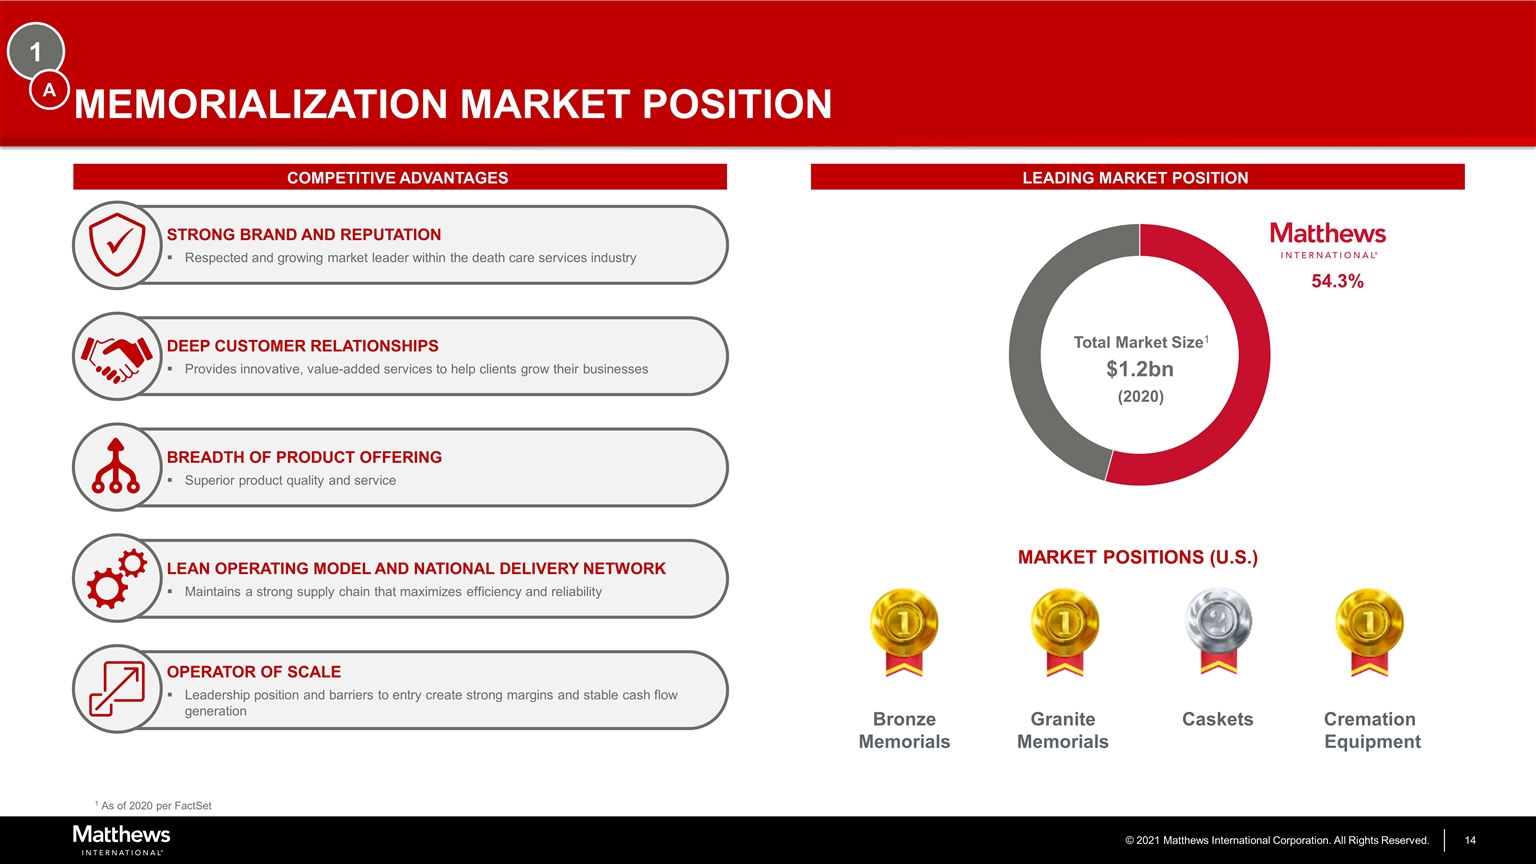
1 MEMORIALIZATION MARKET POSITION COMPETITIVE ADVANTAGES LEADING MARKET POSITION STRONG BRAND AND REPUTATION Respected and growing market leader within the death care services industry ü DEEP CUSTOMER RELATIONSHIPS Provides innovative, value-added services to help clients grow their businesses BREADTH OF PRODUCT OFFERING Superior product quality and service LEAN OPERATING MODEL AND NATIONAL DELIVERY NETWORK Maintains a strong supply chain that maximizes efficiency and reliability OPERATOR OF SCALE Leadership position and barriers to entry create strong margins and stable cash flow generation A Total Market Size1 $1.2bn MARKET POSITIONS (U.S.) Bronze Memorials Granite Memorials Caskets Cremation Equipment (2020) 1 As of 2020 per FactSet
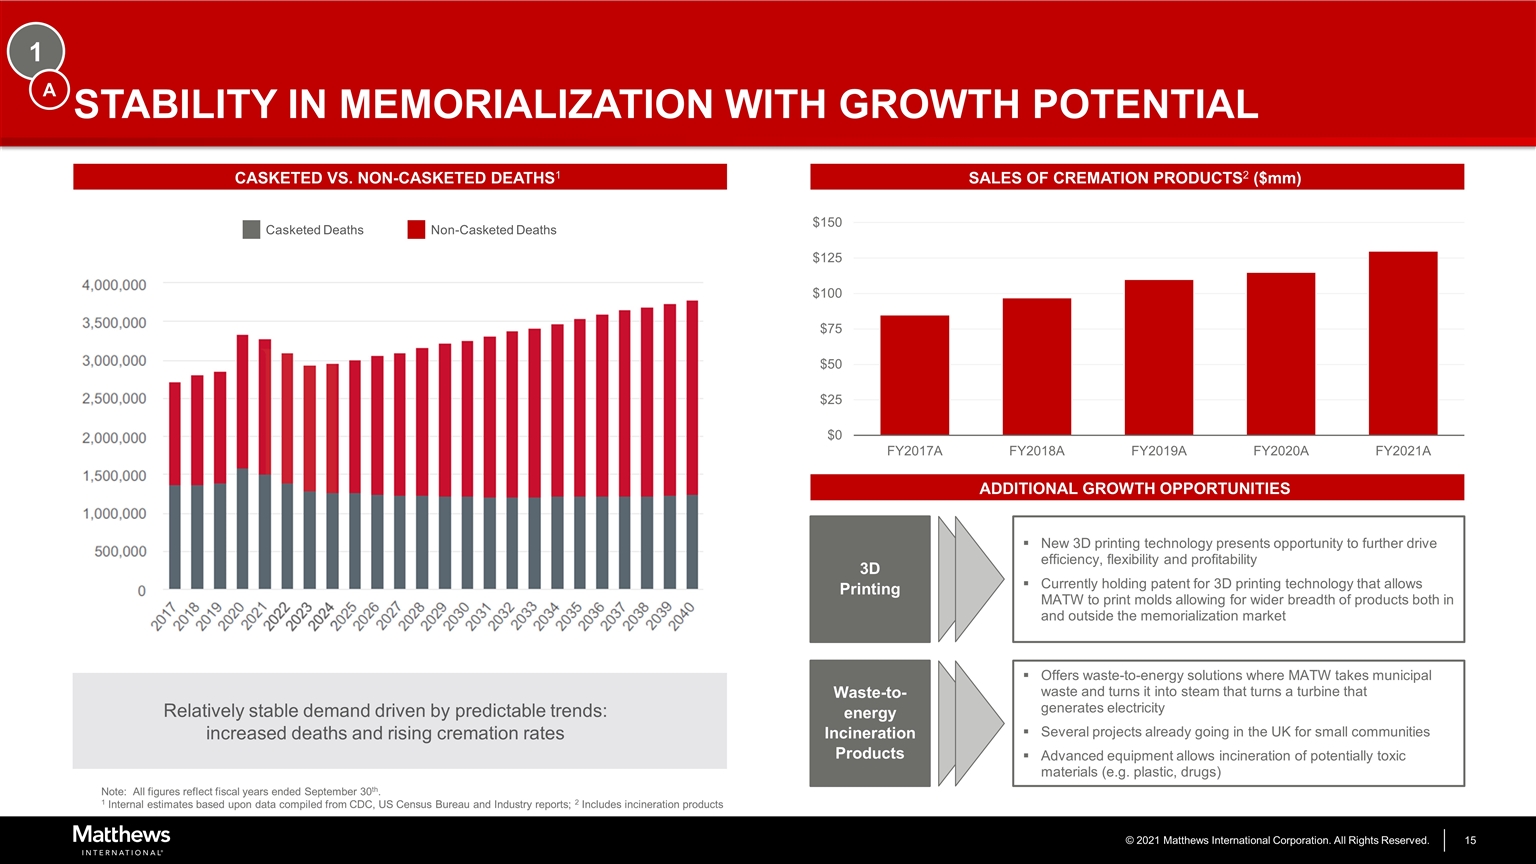
1 STABILITY IN MEMORIALIZATION WITH GROWTH POTENTIAL Relatively stable demand driven by predictable trends: increased deaths and rising cremation rates CASKETED VS. NON-CASKETED DEATHS1 SALES OF CREMATION PRODUCTS2 ($mm) A ADDITIONAL GROWTH OPPORTUNITIES New 3D printing technology presents opportunity to further drive efficiency, flexibility and profitability Currently holding patent for 3D printing technology that allows MATW to print molds allowing for wider breadth of products both in and outside the memorialization market 3D Printing Offers waste-to-energy solutions where MATW takes municipal waste and turns it into steam that turns a turbine that generates electricity Several projects already going in the UK for small communities Advanced equipment allows incineration of potentially toxic materials (e.g. plastic, drugs) Waste-to-energy Incineration Products Note: All figures reflect fiscal years ended September 30th. 1 Internal estimates based upon data compiled from CDC, US Census Bureau and Industry reports; 2 Includes incineration products Casketed Deaths Non-Casketed Deaths
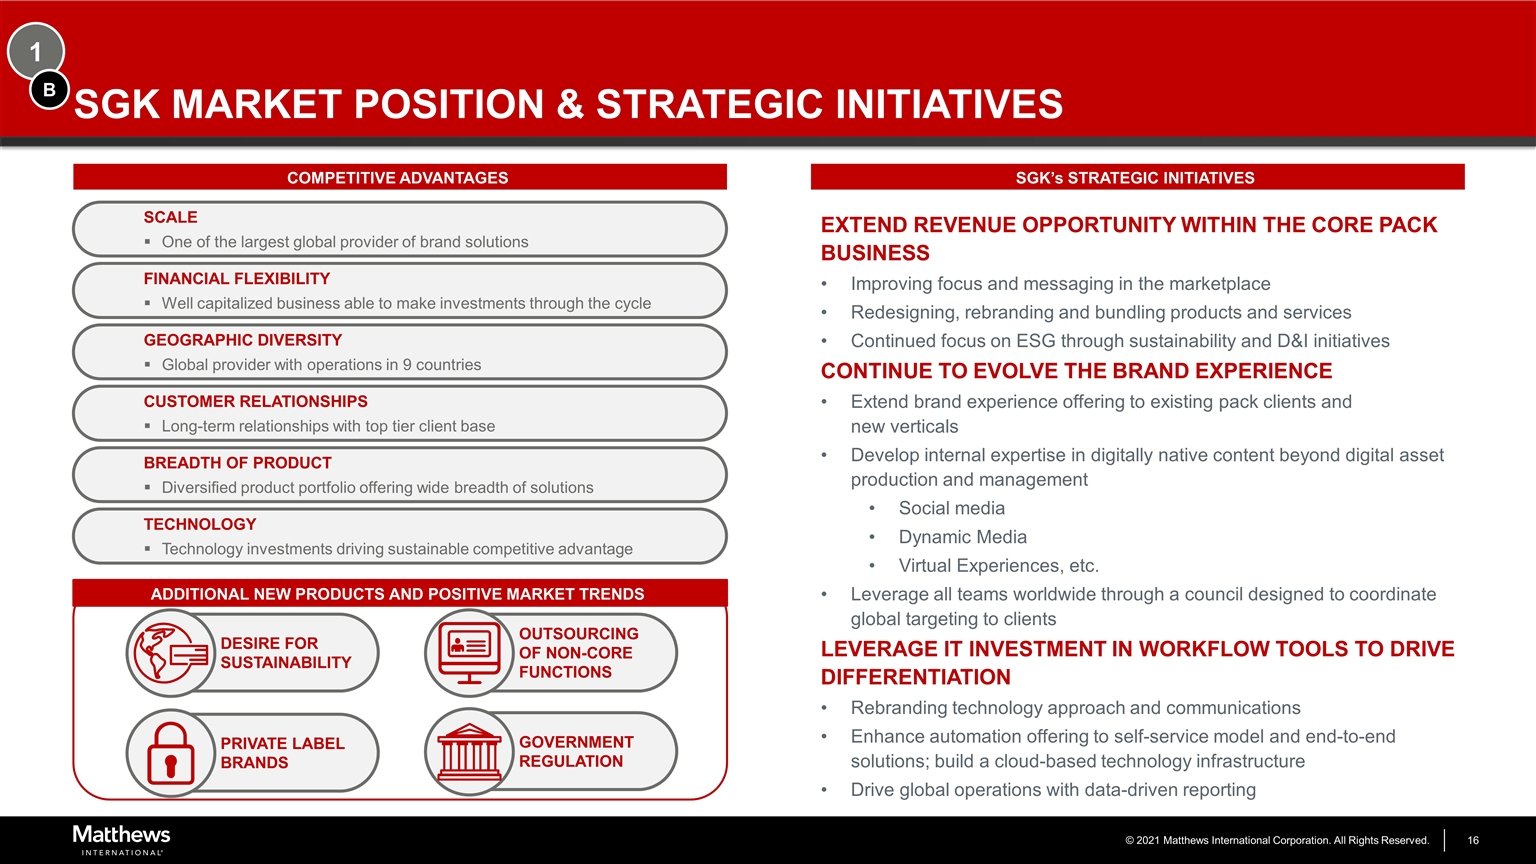
1 SGK MARKET POSITION & STRATEGIC INITIATIVES B Extend revenue opportunity within the core pack business Improving focus and messaging in the marketplace Redesigning, rebranding and bundling products and services Continued focus on ESG through sustainability and D&I initiatives Continue to evolve the Brand Experience Extend brand experience offering to existing pack clients and new verticals Develop internal expertise in digitally native content beyond digital asset production and management Social media Dynamic Media Virtual Experiences, etc. Leverage all teams worldwide through a council designed to coordinate global targeting to clients Leverage IT investment in workflow tools to drive differentiation Rebranding technology approach and communications Enhance automation offering to self-service model and end-to-end solutions; build a cloud-based technology infrastructure Drive global operations with data-driven reporting COMPETITIVE ADVANTAGES SGK’s STRATEGIC INITIATIVES Scale One of the largest global provider of brand solutions Financial flexibility Well capitalized business able to make investments through the cycle Customer relationships Long-term relationships with top tier client base Technology Technology investments driving sustainable competitive advantage Breadth of product Diversified product portfolio offering wide breadth of solutions Geographic diversity Global provider with operations in 9 countries OUTSOURCING OF NON-CORE FUNCTIONS ADDITIONAL NEW PRODUCTS AND POSITIVE MARKET TRENDS DESIRE FOR SUSTAINABILITY PRIVATE LABEL BRANDS GOVERNMENT REGULATION
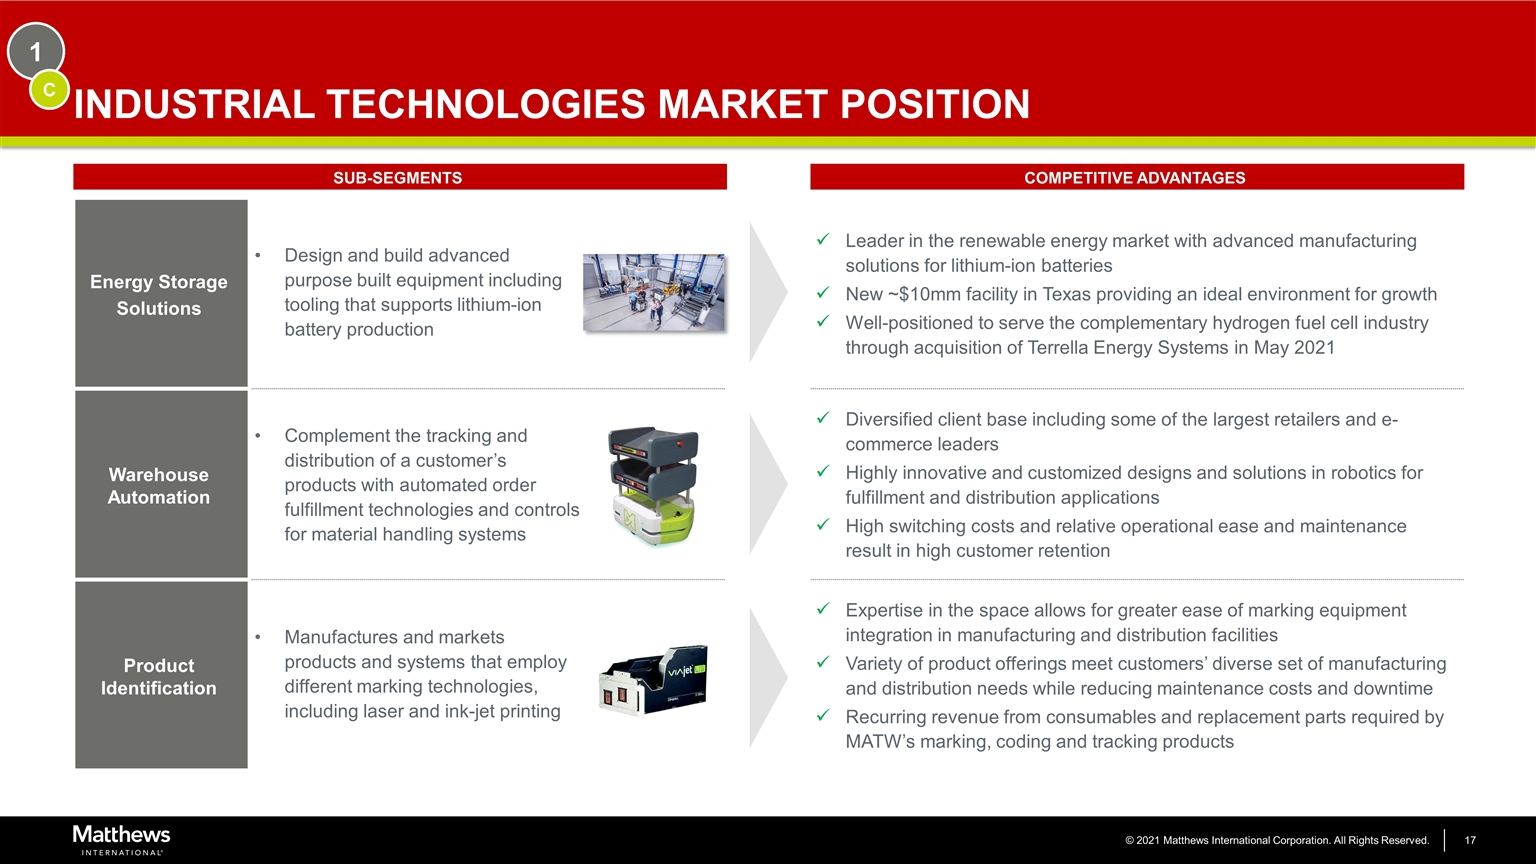
1 INDUSTRIAL TECHNOLOGIES MARKET POSITION SUB-SEGMENTS COMPETITIVE ADVANTAGES Energy Storage Solutions Design and build advanced purpose built equipment including tooling that supports lithium-ion battery production Leader in the renewable energy market with advanced manufacturing solutions for lithium-ion batteries New ~$10mm facility in Texas providing an ideal environment for growth Well-positioned to serve the complementary hydrogen fuel cell industry through acquisition of Terrella Energy Systems in May 2021 Warehouse Automation Complement the tracking and distribution of a customer’s products with automated order fulfillment technologies and controls for material handling systems Diversified client base including some of the largest retailers and e-commerce leaders Highly innovative and customized designs and solutions in robotics for fulfillment and distribution applications High switching costs and relative operational ease and maintenance result in high customer retention Product Identification Manufactures and markets products and systems that employ different marking technologies, including laser and ink-jet printing Expertise in the space allows for greater ease of marking equipment integration in manufacturing and distribution facilities Variety of product offerings meet customers’ diverse set of manufacturing and distribution needs while reducing maintenance costs and downtime Recurring revenue from consumables and replacement parts required by MATW’s marking, coding and tracking products C

WELL DIVERSIFIED CASH FLOWS WITH ATTRACTIVE MARGIN AND Free Cash Flow PROFILE 2 SALES BY SEGMENT ADJ. EBITDA ($mm)1 FREE CASH FLOW4 ($mm) ADJ. EBITDA BY SEGMENT % Adjusted EBITDA margin3 14.4% 13.6% 13.6% x% % Free Cash Flow conversion5 42.2% 71.7% 54.0% x% Note: All figures reflect fiscal years ended September 30th; Historical FY2017 – FY2018 reflects public filing figures. 1 See reconciliation in the appendix on page 30; 2 Effective in the first quarter of fiscal 2022, the Company transferred its surfaces and engineered products businesses from the SGK Brand Solutions segment to the Industrial Technologies segment. The above chart sets forth sales and adjusted EBITDA for the year ended September 30, 2021, as if the segments had been reported under the new reportable segment structure. See reconciliation in the appendix on page 31; 3 Adjusted EBITDA margin is defined as the proportion of adjusted EBITDA to sales; 4 Free Cash Flow calculated as cash provided from operating activities less capital expenditures. See reconciliation in the appendix on page 32; 5 Free Cash Flow conversion defined as Free Cash Flow / Adj. EBITDA FY2021A2 FY2021A2 15.9% 15.7% FY2017A FY2017A 40.9% 43.7%
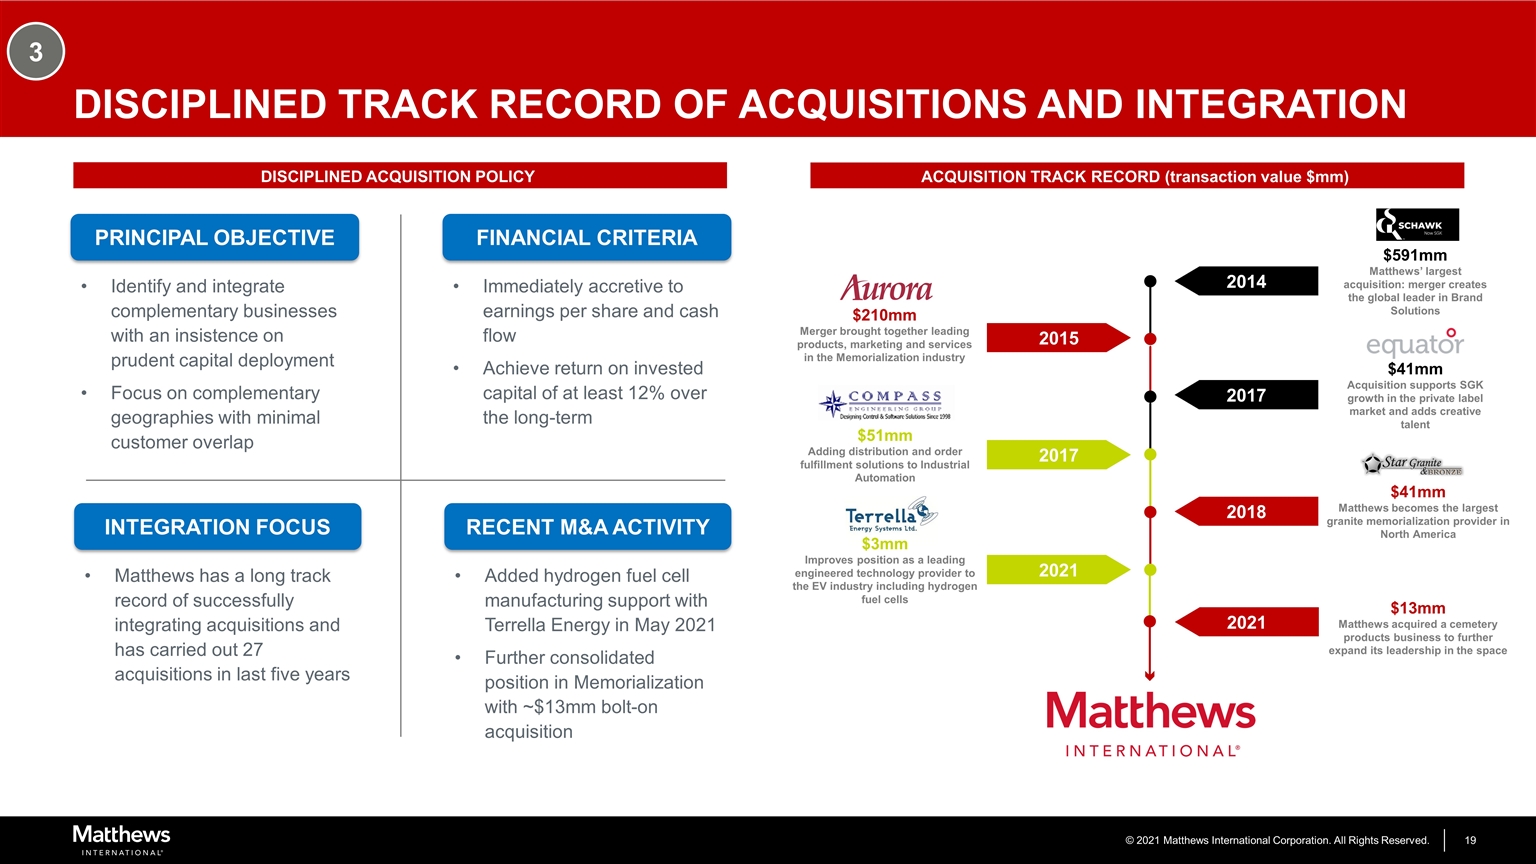
DISCIPLINED TRACK RECORD OF ACQUISITIONS AND INTEGRATION 3 Principal objective Identify and integrate complementary businesses with an insistence on prudent capital deployment Focus on complementary geographies with minimal customer overlap Financial criteria Immediately accretive to earnings per share and cash flow Achieve return on invested capital of at least 12% over the long-term Integration focus Matthews has a long track record of successfully integrating acquisitions and has carried out 27 acquisitions in last five years RECENT M&A ACTIVITY Added hydrogen fuel cell manufacturing support with Terrella Energy in May 2021 Further consolidated position in Memorialization with ~$13mm bolt-on acquisition 2017 2018 $41mm Matthews becomes the largest granite memorialization provider in North America 2021 $3mm Improves position as a leading engineered technology provider to the EV industry including hydrogen fuel cells $41mm Acquisition supports SGK growth in the private label market and adds creative talent 2017 $51mm Adding distribution and order fulfillment solutions to Industrial Automation 2014 $591mm Matthews’ largest acquisition: merger creates the global leader in Brand Solutions 2015 $210mm Merger brought together leading products, marketing and services in the Memorialization industry ACQUISITION TRACK RECORD (transaction value $mm) DISCIPLINED ACQUISITION POLICY 2021 $13mm Matthews acquired a cemetery products business to further expand its leadership in the space
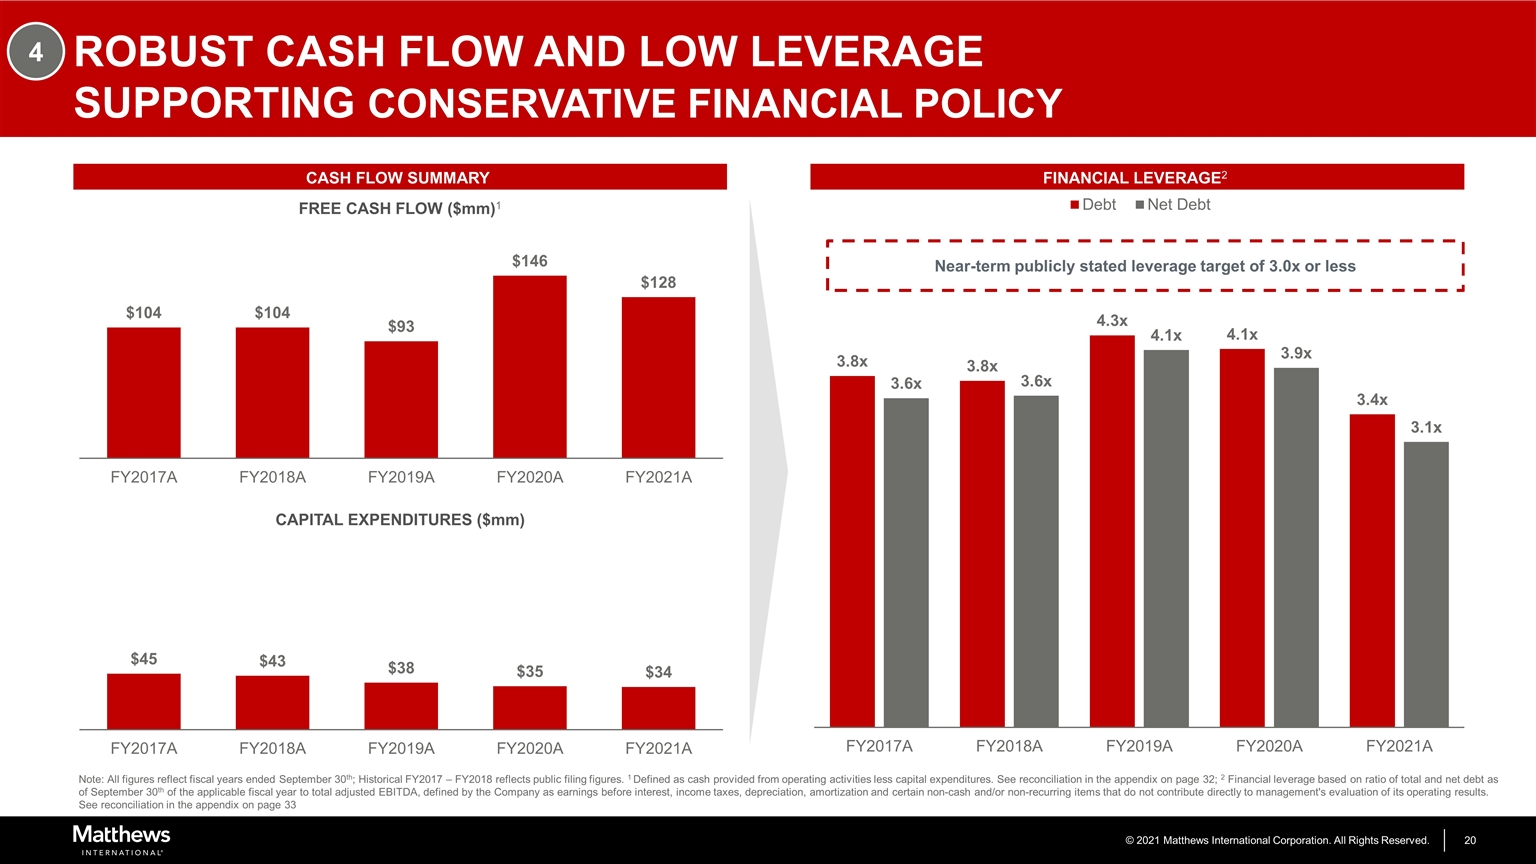
ROBUST CASH FLOW AND LOW LEVERAGE SUPPORTING CONSERVATIVE FINANCIAL POLICY 4 CASH FLOW SUMMARY FINANCIAL LEVERAGE2 FREE CASH FLOW ($mm)1 CAPITAL EXPENDITURES ($mm) Note: All figures reflect fiscal years ended September 30th; Historical FY2017 – FY2018 reflects public filing figures. 1 Defined as cash provided from operating activities less capital expenditures. See reconciliation in the appendix on page 32; 2 Financial leverage based on ratio of total and net debt as of September 30th of the applicable fiscal year to total adjusted EBITDA, defined by the Company as earnings before interest, income taxes, depreciation, amortization and certain non-cash and/or non-recurring items that do not contribute directly to management's evaluation of its operating results. See reconciliation in the appendix on page 33

STRONG AND EXPERIENCED MANAGEMENT TEAM Joseph Bartolacci Chief Executive Officer and President Chief Executive Officer and President since 2006 and previously served as Chief Operating Officer from 2005-2006 President of York Casket division and EVP of Matthews from 2004-2005 Joined Matthews in 1997 and later served as president of Caggiati and Matthews, Europe from 1999-2004 Greg Babe Chief Technology Officer Chief Technology Officer since 2015 Served as interim Chief Information Officer / Chief Technology Officer in 2014 Also served as President and Chief Executive Officer of Bayer Corporation North America from 2008-2012 before retiring from that role Brian Dunn EVP, Strategy and Corporate Development Responsible for the Industrials Group and Integration Management Group President of Brand Solutions from 2010 to 2014 Served as President, Marking Products Division 2000-2007 Steven Nicola Chief Financial Officer and Secretary Chief Financial Officer since 2003 Vice President, Accounting and Finance from 2001-2003 Served as Controller from 1995-2001 Joined Matthews in 1992 Gary Kohl President, SGK Brand Solutions Became SGK’s president in 2017 Prior to serving in his current role, he was the executive vice president, global development at SGK Prior to joining SGK, he was the group senior vice president of the digital solutions, global packaging and printed electronics team at RR Donnelley Steven Gackenbach Group President of Memorialization Joined Matthews in January 2011 and originally served as Chief Commercial Officer, Memorialization Group Spent 18 years in marketing, general management and strategy assignments with Kraft Foods prior to joining Matthews Steven has been a consultant at Monitor Group and Booz & Company Steven graduated from University of Pennsylvania and earned his MBA from Harvard Business School 5
FINANCIAL OVERVIEW TBU – new image
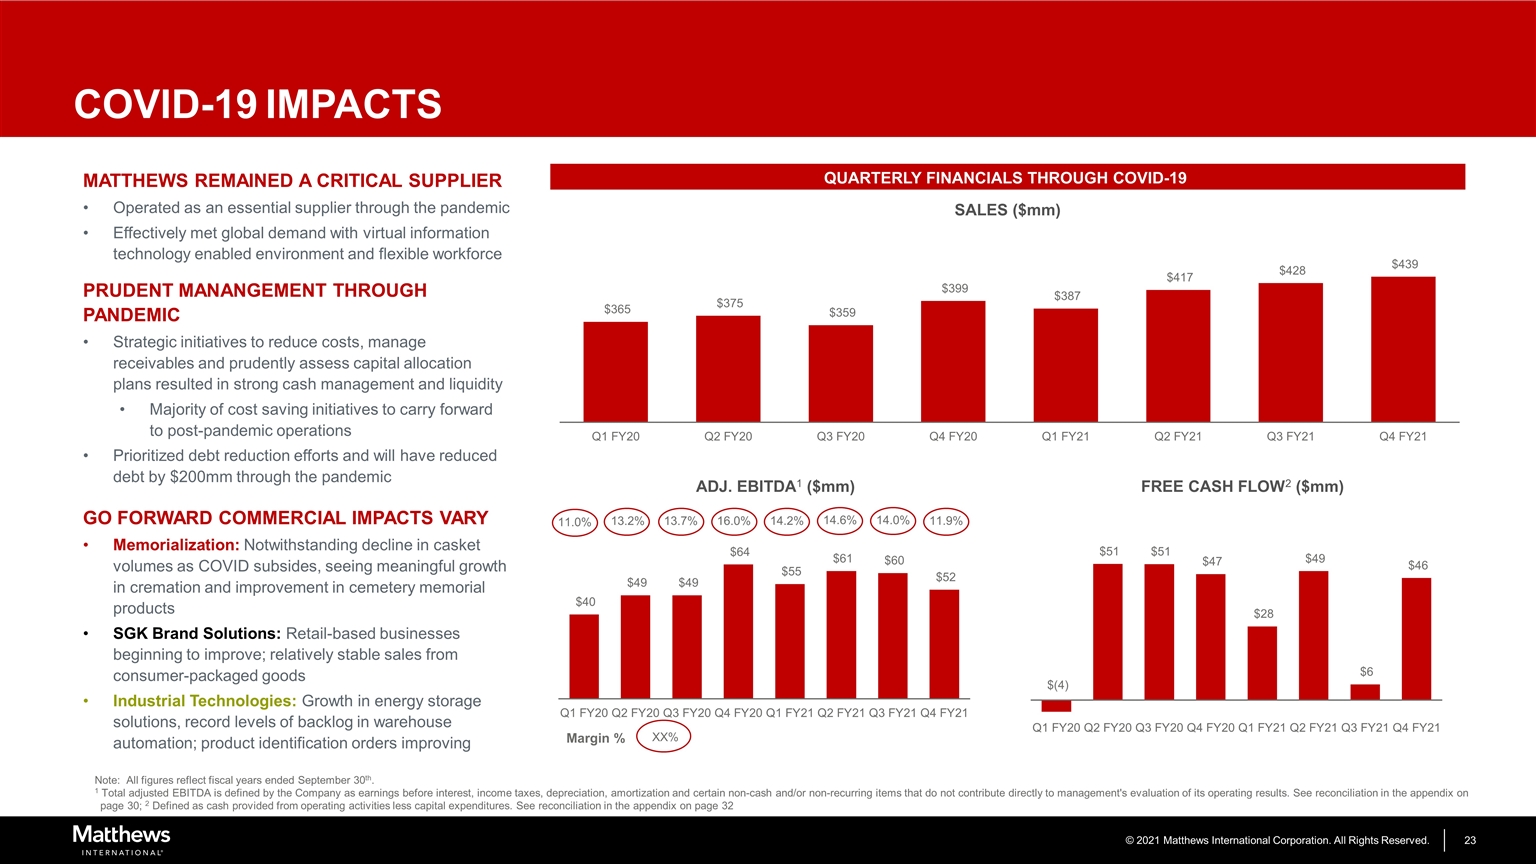
COVID-19IMPACTS MATTHEWS REMAINED A CRITICAL SUPPLIER Operated as an essential supplier through the pandemic Effectively met global demand with virtual information technology enabled environment and flexible workforce PRUDENT MANANGEMENT THROUGH PANDEMIC Strategic initiatives to reduce costs, manage receivables and prudently assess capital allocation plans resulted in strong cash management and liquidity Majority of cost saving initiatives to carry forward to post-pandemic operations Prioritized debt reduction efforts and will have reduced debt by $200mm through the pandemic GO FORWARD COMMERCIAL IMPACTS VARY Memorialization: Notwithstanding decline in casket volumes as COVID subsides, seeing meaningful growth in cremation and improvement in cemetery memorial products SGK Brand Solutions: Retail-based businesses beginning to improve; relatively stable sales from consumer-packaged goods Industrial Technologies: Growth in energy storage solutions, record levels of backlog in warehouse automation; product identification orders improving SALES ($mm) ADJ. EBITDA1 ($mm) FREE CASH FLOW2 ($mm) 11.0% 13.2% 13.7% 16.0% 14.2% Margin % XX% 14.6% QUARTERLY FINANCIALS THROUGH COVID-19 14.0% 11.9% Note: All figures reflect fiscal years ended September 30th. 1 Total adjusted EBITDA is defined by the Company as earnings before interest, income taxes, depreciation, amortization and certain non-cash and/or non-recurring items that do not contribute directly to management's evaluation of its operating results. See reconciliation in the appendix on page 30; 2 Defined as cash provided from operating activities less capital expenditures. See reconciliation in the appendix on page 32
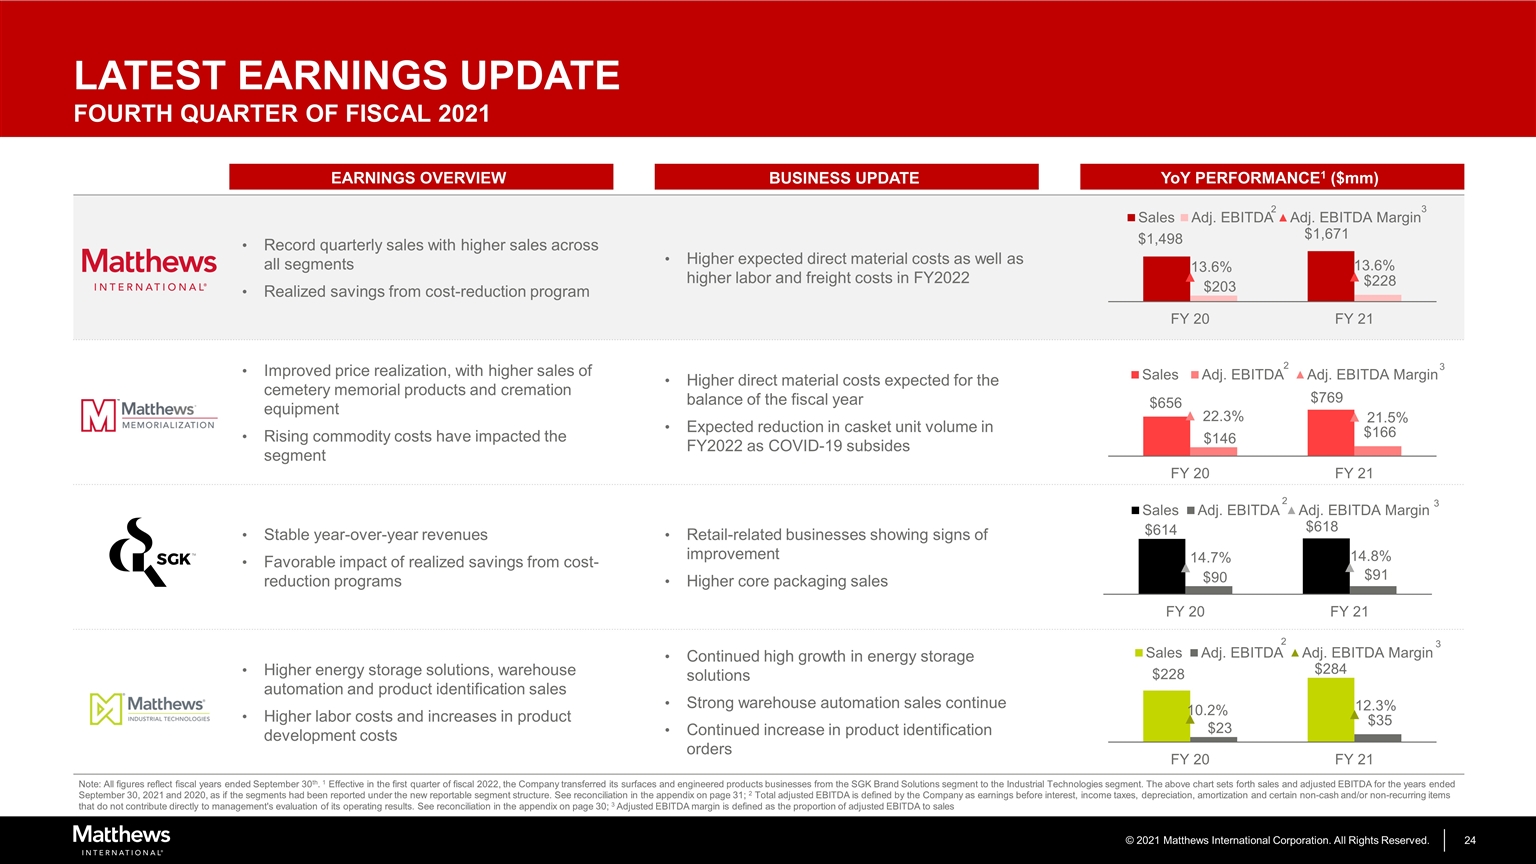
Record quarterly sales with higher sales across all segments Realized savings from cost-reduction program Higher expected direct material costs as well as higher labor and freight costs in FY2022 Improved price realization, with higher sales of cemetery memorial products and cremation equipment Rising commodity costs have impacted the segment Higher direct material costs expected for the balance of the fiscal year Expected reduction in casket unit volume in FY2022 as COVID-19 subsides Stable year-over-year revenues Favorable impact of realized savings from cost-reduction programs Retail-related businesses showing signs of improvement Higher core packaging sales Higher energy storage solutions, warehouse automation and product identification sales Higher labor costs and increases in product development costs Continued high growth in energy storage solutions Strong warehouse automation sales continue Continued increase in product identification orders EARNINGS OVERVIEW BUSINESS UPDATE YoY PERFORMANCE1 ($mm) LATEST EARNINGS UPDATE FOURTH QUARTER OF FISCAL 2021 2 2 Note: All figures reflect fiscal years ended September 30th. 1 Effective in the first quarter of fiscal 2022, the Company transferred its surfaces and engineered products businesses from the SGK Brand Solutions segment to the Industrial Technologies segment. The above chart sets forth sales and adjusted EBITDA for the years ended September 30, 2021 and 2020, as if the segments had been reported under the new reportable segment structure. See reconciliation in the appendix on page 31; 2 Total adjusted EBITDA is defined by the Company as earnings before interest, income taxes, depreciation, amortization and certain non-cash and/or non-recurring items that do not contribute directly to management's evaluation of its operating results. See reconciliation in the appendix on page 30; 3 Adjusted EBITDA margin is defined as the proportion of adjusted EBITDA to sales 2 3 2 3 3 3 3
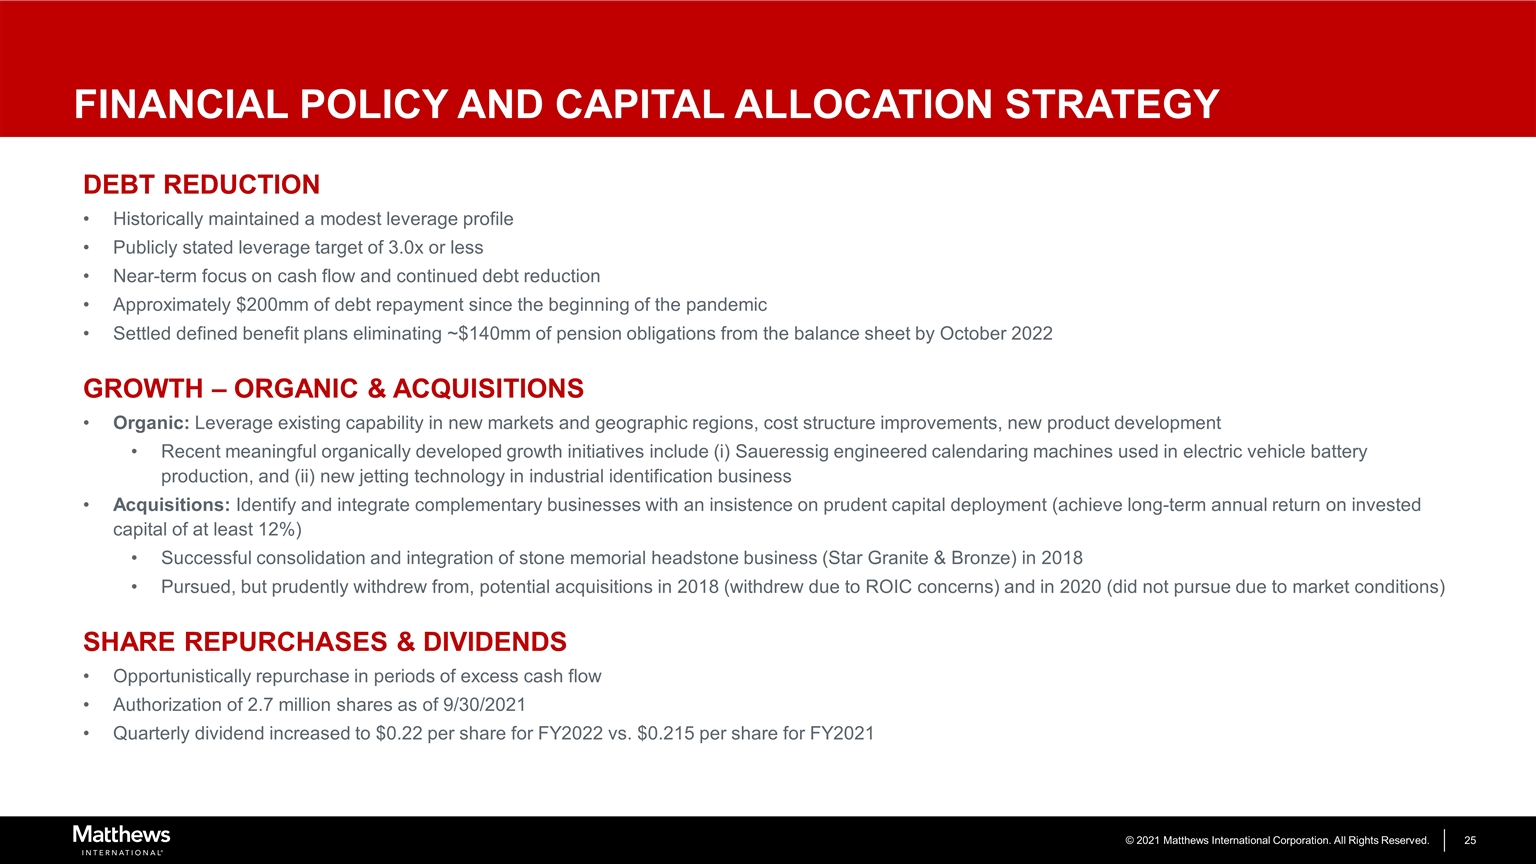
FINANCIAL POLICY AND CAPITAL ALLOCATION STRATEGY DEBT REDUCTION Historically maintained a modest leverage profile Publicly stated leverage target of 3.0x or less Near-term focus on cash flow and continued debt reduction Approximately $200mm of debt repayment since the beginning of the pandemic Settled defined benefit plans eliminating ~$140mm of pension obligations from the balance sheet by October 2022 GROWTH – ORGANIC & ACQUISITIONS Organic: Leverage existing capability in new markets and geographic regions, cost structure improvements, new product development Recent meaningful organically developed growth initiatives include (i) Saueressig engineered calendaring machines used in electric vehicle battery production, and (ii) new jetting technology in industrial identification business Acquisitions: Identify and integrate complementary businesses with an insistence on prudent capital deployment (achieve long-term annual return on invested capital of at least 12%) Successful consolidation and integration of stone memorial headstone business (Star Granite & Bronze) in 2018 Pursued, but prudently withdrew from, potential acquisitions in 2018 (withdrew due to ROIC concerns) and in 2020 (did not pursue due to market conditions) SHARE REPURCHASES & DIVIDENDS Opportunistically repurchase in periods of excess cash flow Authorization of 2.7 million shares as of 9/30/2021 Quarterly dividend increased to $0.22 per share for FY2022 vs. $0.215 per share for FY2021
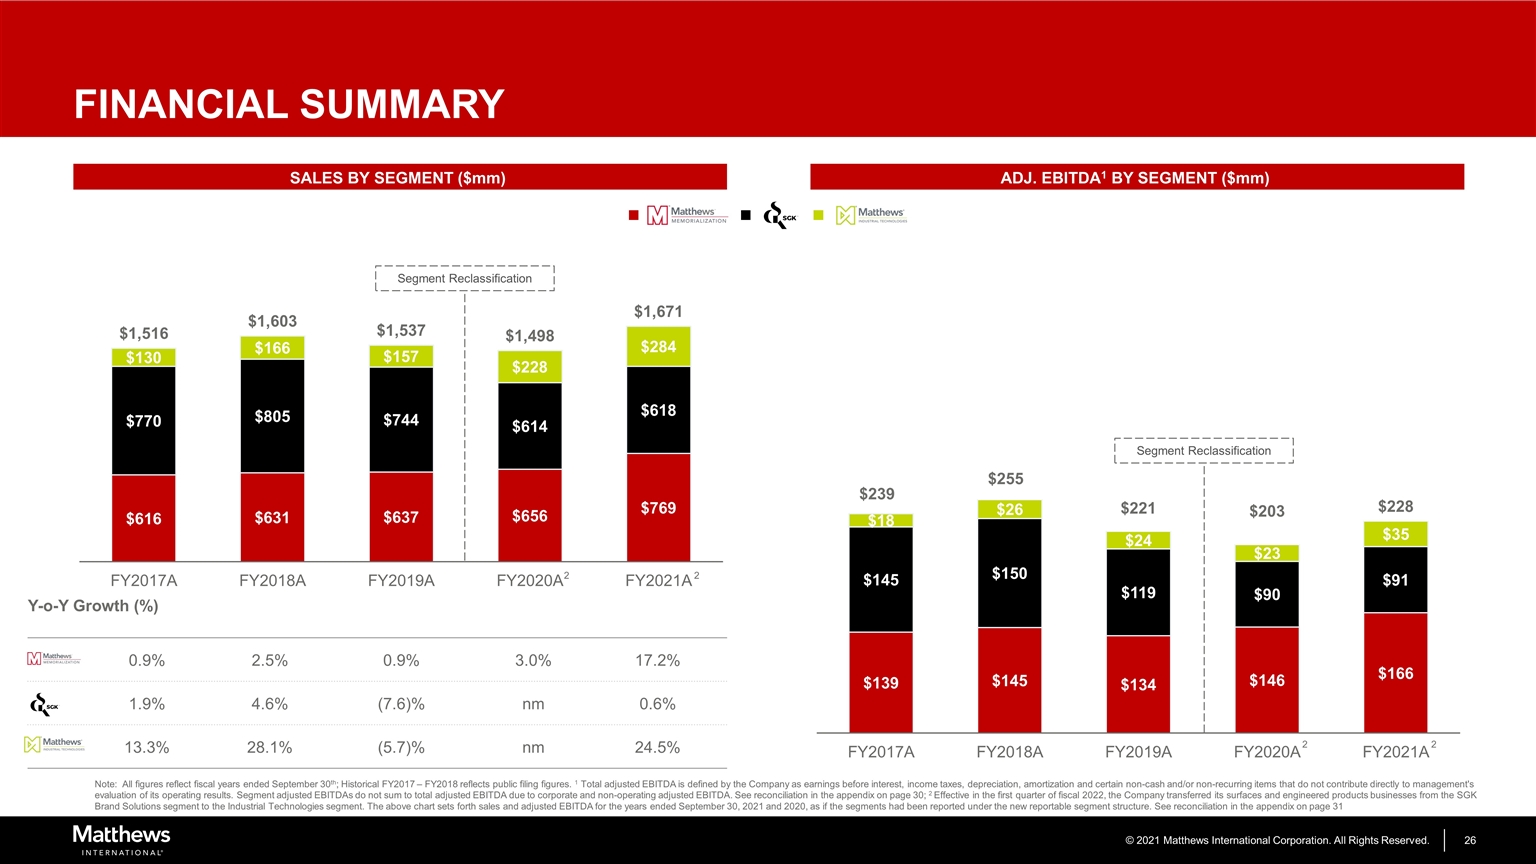
FINANCIAL SUMMARY SALES BY SEGMENT ($mm) ADJ. EBITDA1 BY SEGMENT ($mm) Y-o-Y Growth (%) 0.9% 2.5% 0.9% 3.0% 17.2% 1.9% 4.6% (7.6)% nm 0.6% 13.3% 28.1% (5.7)% nm 24.5% Note: All figures reflect fiscal years ended September 30th; Historical FY2017 – FY2018 reflects public filing figures. 1 Total adjusted EBITDA is defined by the Company as earnings before interest, income taxes, depreciation, amortization and certain non-cash and/or non-recurring items that do not contribute directly to management's evaluation of its operating results. Segment adjusted EBITDAs do not sum to total adjusted EBITDA due to corporate and non-operating adjusted EBITDA. See reconciliation in the appendix on page 30; 2 Effective in the first quarter of fiscal 2022, the Company transferred its surfaces and engineered products businesses from the SGK Brand Solutions segment to the Industrial Technologies segment. The above chart sets forth sales and adjusted EBITDA for the years ended September 30, 2021 and 2020, as if the segments had been reported under the new reportable segment structure. See reconciliation in the appendix on page 31 Segment Reclassification Segment Reclassification 2 2 2 2
ESG OVERVIEW
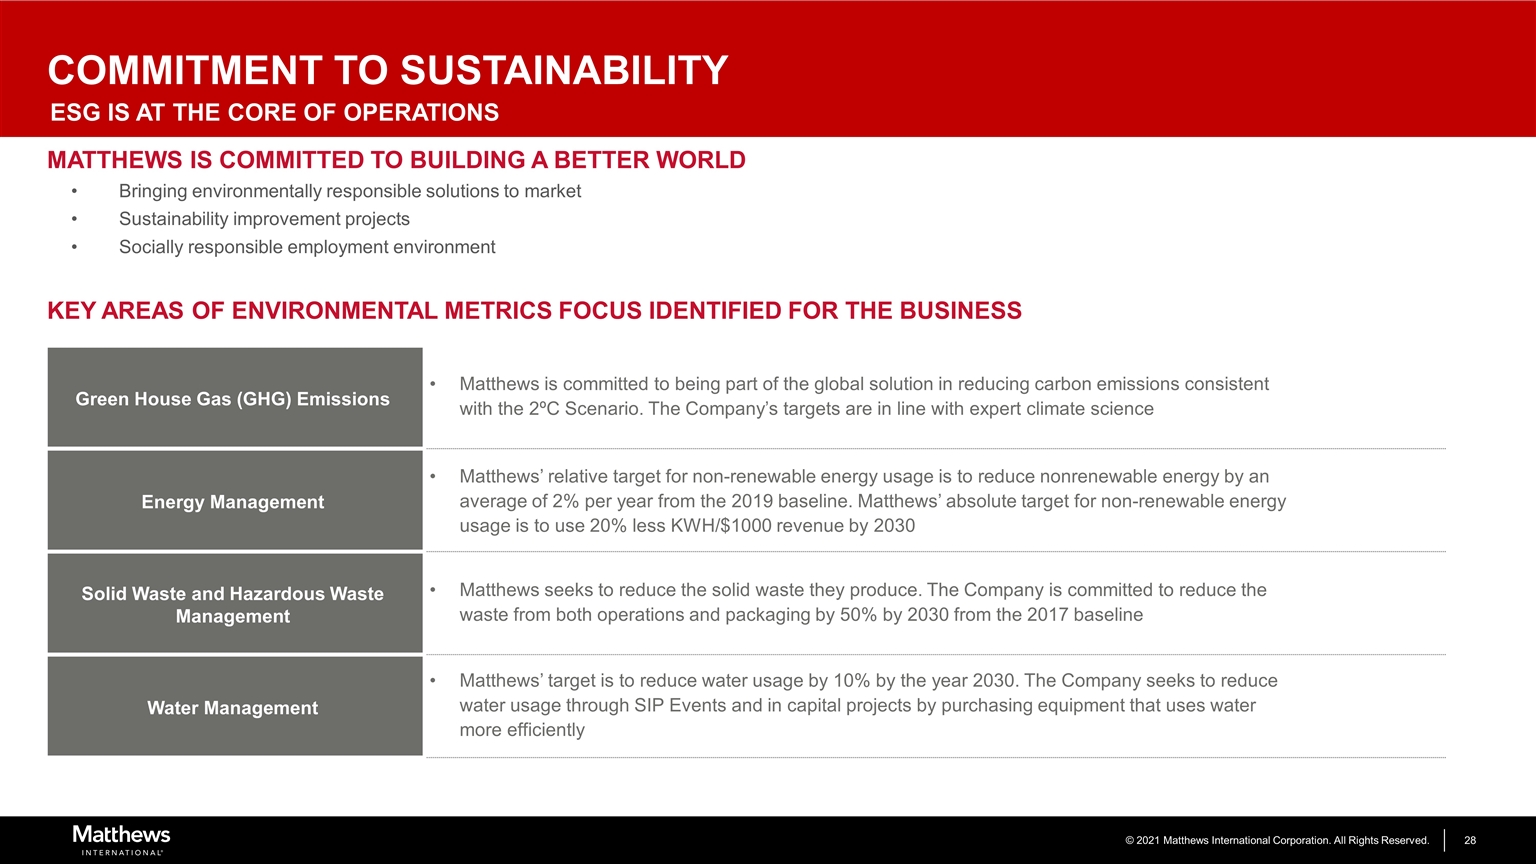
COMMITMENT TO SUSTAINABILITY ESG IS AT THE CORE OF OPERATIONS MATTHEWS IS COMMITTED TO BUILDING A BETTER WORLD Bringing environmentally responsible solutions to market Sustainability improvement projects Socially responsible employment environment KEY AREAS OF ENVIRONMENTAL METRICS FOCUS IDENTIFIED FOR THE BUSINESS Green House Gas (GHG) Emissions Matthews is committed to being part of the global solution in reducing carbon emissions consistent with the 2ºC Scenario. The Company’s targets are in line with expert climate science Energy Management Matthews’ relative target for non-renewable energy usage is to reduce nonrenewable energy by an average of 2% per year from the 2019 baseline. Matthews’ absolute target for non-renewable energy usage is to use 20% less KWH/$1000 revenue by 2030 Solid Waste and Hazardous Waste Management Matthews seeks to reduce the solid waste they produce. The Company is committed to reduce the waste from both operations and packaging by 50% by 2030 from the 2017 baseline Water Management Matthews’ target is to reduce water usage by 10% by the year 2030. The Company seeks to reduce water usage through SIP Events and in capital projects by purchasing equipment that uses water more efficiently

APPENDIX
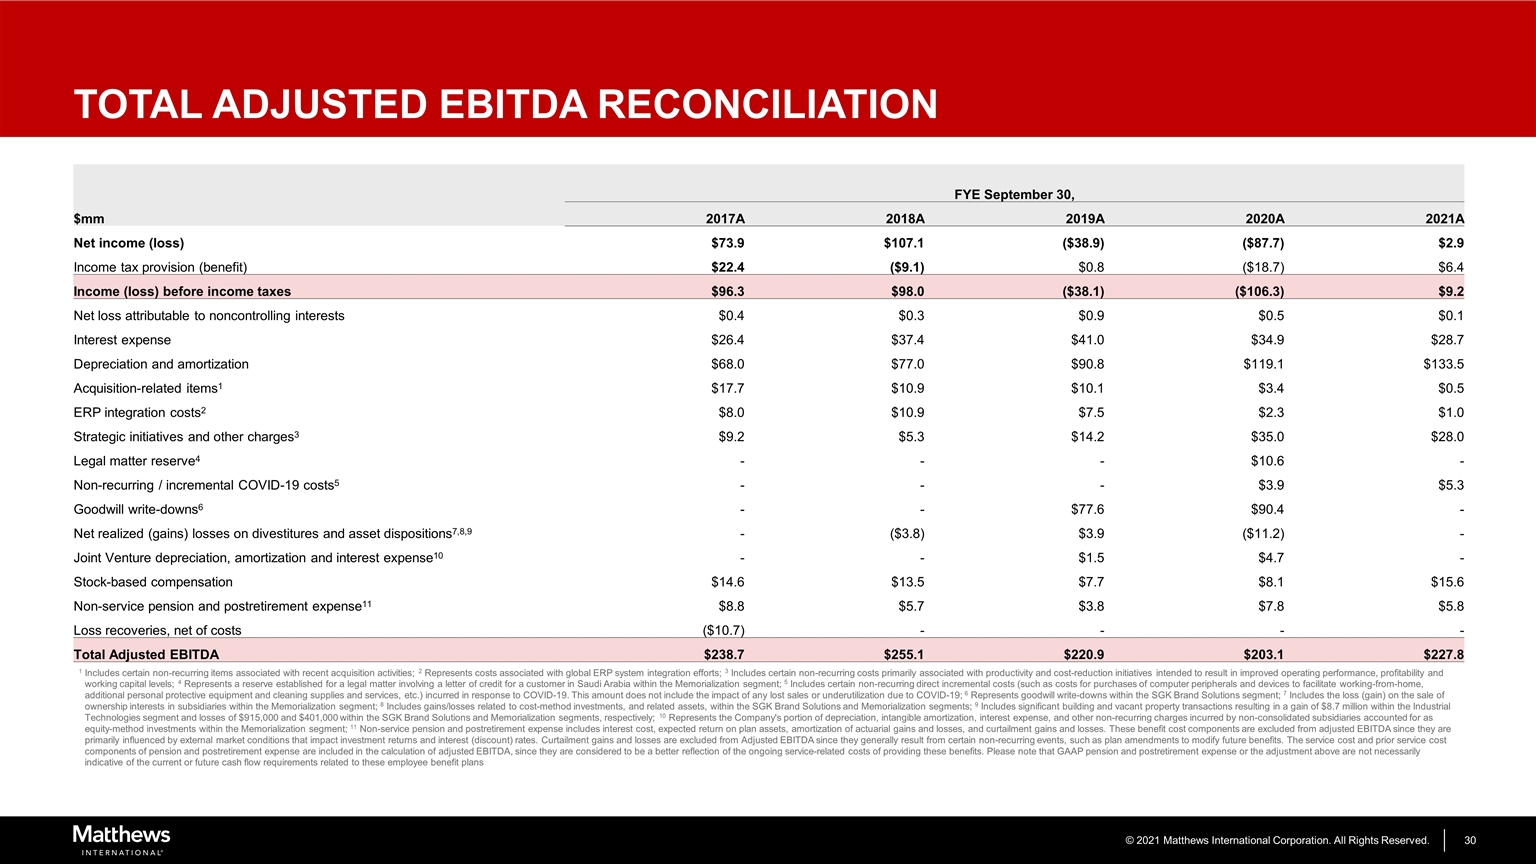
TOTAL ADJUSTED EBITDA RECONCILIATION FYE September 30, $mm 2017A 2018A 2019A 2020A 2021A Net income (loss) $73.9 $107.1 ($38.9) ($87.7) $2.9 Income tax provision (benefit) $22.4 ($9.1) $0.8 ($18.7) $6.4 Income (loss) before income taxes $96.3 $98.0 ($38.1) ($106.3) $9.2 Net loss attributable to noncontrolling interests $0.4 $0.3 $0.9 $0.5 $0.1 Interest expense $26.4 $37.4 $41.0 $34.9 $28.7 Depreciation and amortization $68.0 $77.0 $90.8 $119.1 $133.5 Acquisition-related items1 $17.7 $10.9 $10.1 $3.4 $0.5 ERP integration costs2 $8.0 $10.9 $7.5 $2.3 $1.0 Strategic initiatives and other charges3 $9.2 $5.3 $14.2 $35.0 $28.0 Legal matter reserve4 - - - $10.6 - Non-recurring / incremental COVID-19 costs5 - - - $3.9 $5.3 Goodwill write-downs6 - - $77.6 $90.4 - Net realized (gains) losses on divestitures and asset dispositions7,8,9 - ($3.8) $3.9 ($11.2) - Joint Venture depreciation, amortization and interest expense10 - - $1.5 $4.7 - Stock-based compensation $14.6 $13.5 $7.7 $8.1 $15.6 Non-service pension and postretirement expense11 $8.8 $5.7 $3.8 $7.8 $5.8 Loss recoveries, net of costs ($10.7) - - - - Total Adjusted EBITDA $238.7 $255.1 $220.9 $203.1 $227.8 1 Includes certain non-recurring items associated with recent acquisition activities; 2 Represents costs associated with global ERP system integration efforts; 3 Includes certain non-recurring costs primarily associated with productivity and cost-reduction initiatives intended to result in improved operating performance, profitability and working capital levels; 4 Represents a reserve established for a legal matter involving a letter of credit for a customer in Saudi Arabia within the Memorialization segment; 5 Includes certain non-recurring direct incremental costs (such as costs for purchases of computer peripherals and devices to facilitate working-from-home, additional personal protective equipment and cleaning supplies and services, etc.) incurred in response to COVID-19. This amount does not include the impact of any lost sales or underutilization due to COVID-19; 6 Represents goodwill write-downs within the SGK Brand Solutions segment; 7 Includes the loss (gain) on the sale of ownership interests in subsidiaries within the Memorialization segment; 8 Includes gains/losses related to cost-method investments, and related assets, within the SGK Brand Solutions and Memorialization segments; 9 Includes significant building and vacant property transactions resulting in a gain of $8.7 million within the Industrial Technologies segment and losses of $915,000 and $401,000 within the SGK Brand Solutions and Memorialization segments, respectively; 10 Represents the Company's portion of depreciation, intangible amortization, interest expense, and other non-recurring charges incurred by non-consolidated subsidiaries accounted for as equity-method investments within the Memorialization segment; 11 Non-service pension and postretirement expense includes interest cost, expected return on plan assets, amortization of actuarial gains and losses, and curtailment gains and losses. These benefit cost components are excluded from adjusted EBITDA since they are primarily influenced by external market conditions that impact investment returns and interest (discount) rates. Curtailment gains and losses are excluded from Adjusted EBITDA since they generally result from certain non-recurring events, such as plan amendments to modify future benefits. The service cost and prior service cost components of pension and postretirement expense are included in the calculation of adjusted EBITDA, since they are considered to be a better reflection of the ongoing service-related costs of providing these benefits. Please note that GAAP pension and postretirement expense or the adjustment above are not necessarily indicative of the current or future cash flow requirements related to these employee benefit plans
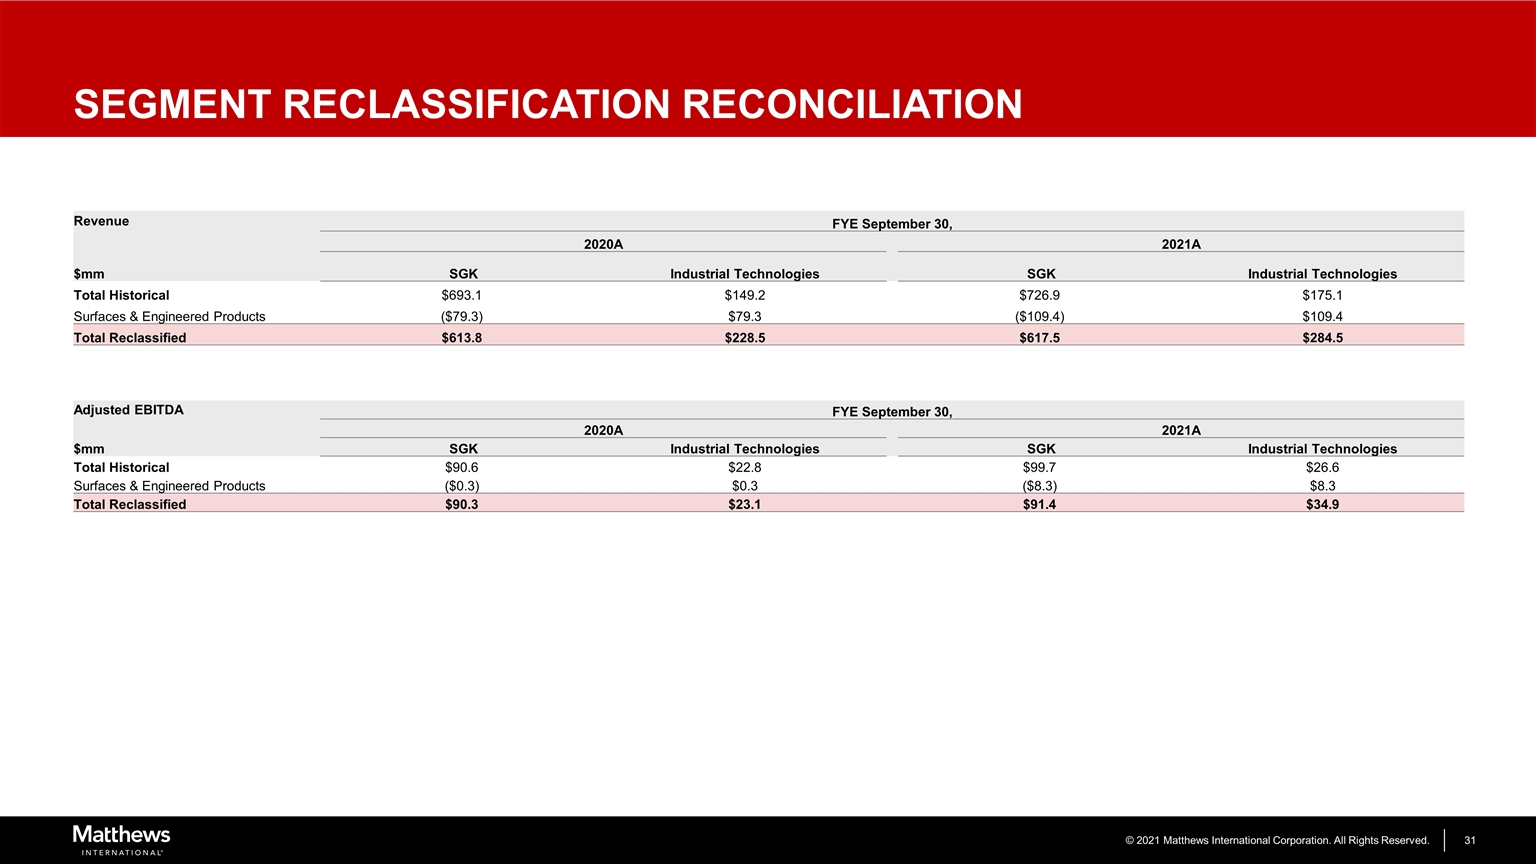
Revenue FYE September 30, 2020A 2021A $mm SGK Industrial Technologies SGK Industrial Technologies Total Historical $693.1 $149.2 $726.9 $175.1 Surfaces & Engineered Products ($79.3) $79.3 ($109.4) $109.4 Total Reclassified $613.8 $228.5 $617.5 $284.5 Adjusted EBITDA FYE September 30, 2020A 2021A $mm SGK Industrial Technologies SGK Industrial Technologies Total Historical $90.6 $22.8 $99.7 $26.6 Surfaces & Engineered Products ($0.3) $0.3 ($8.3) $8.3 Total Reclassified $90.3 $23.1 $91.4 $34.9 SEGMENT RECLASSIFICATION RECONCILIATION
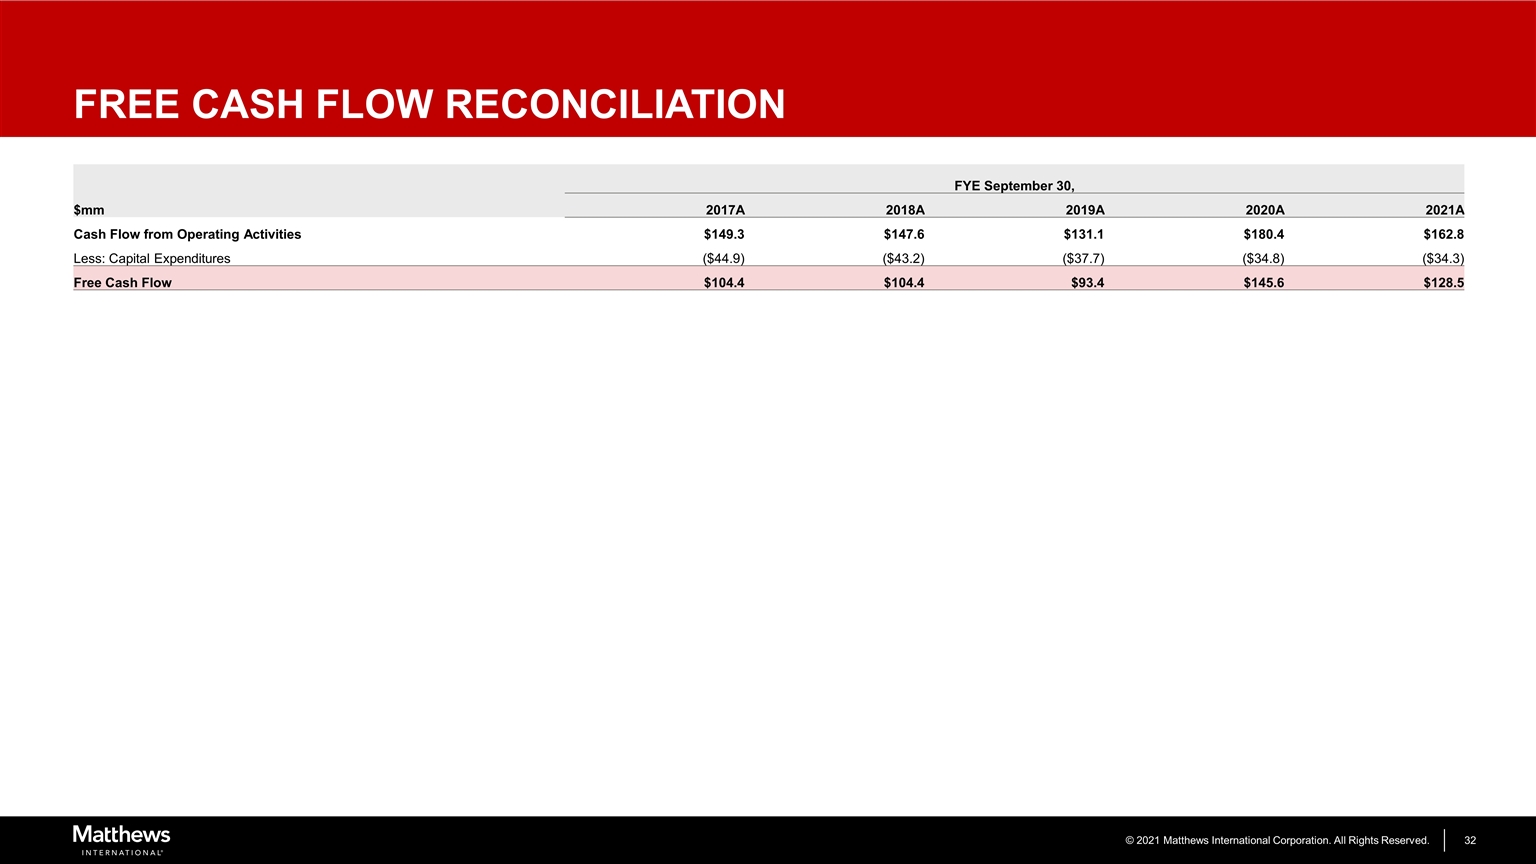
FREE CASH FLOW RECONCILIATION FYE September 30, $mm 2017A 2018A 2019A 2020A 2021A Cash Flow from Operating Activities $149.3 $147.6 $131.1 $180.4 $162.8 Less: Capital Expenditures ($44.9) ($43.2) ($37.7) ($34.8) ($34.3) Free Cash Flow $104.4 $104.4 $93.4 $145.6 $128.5
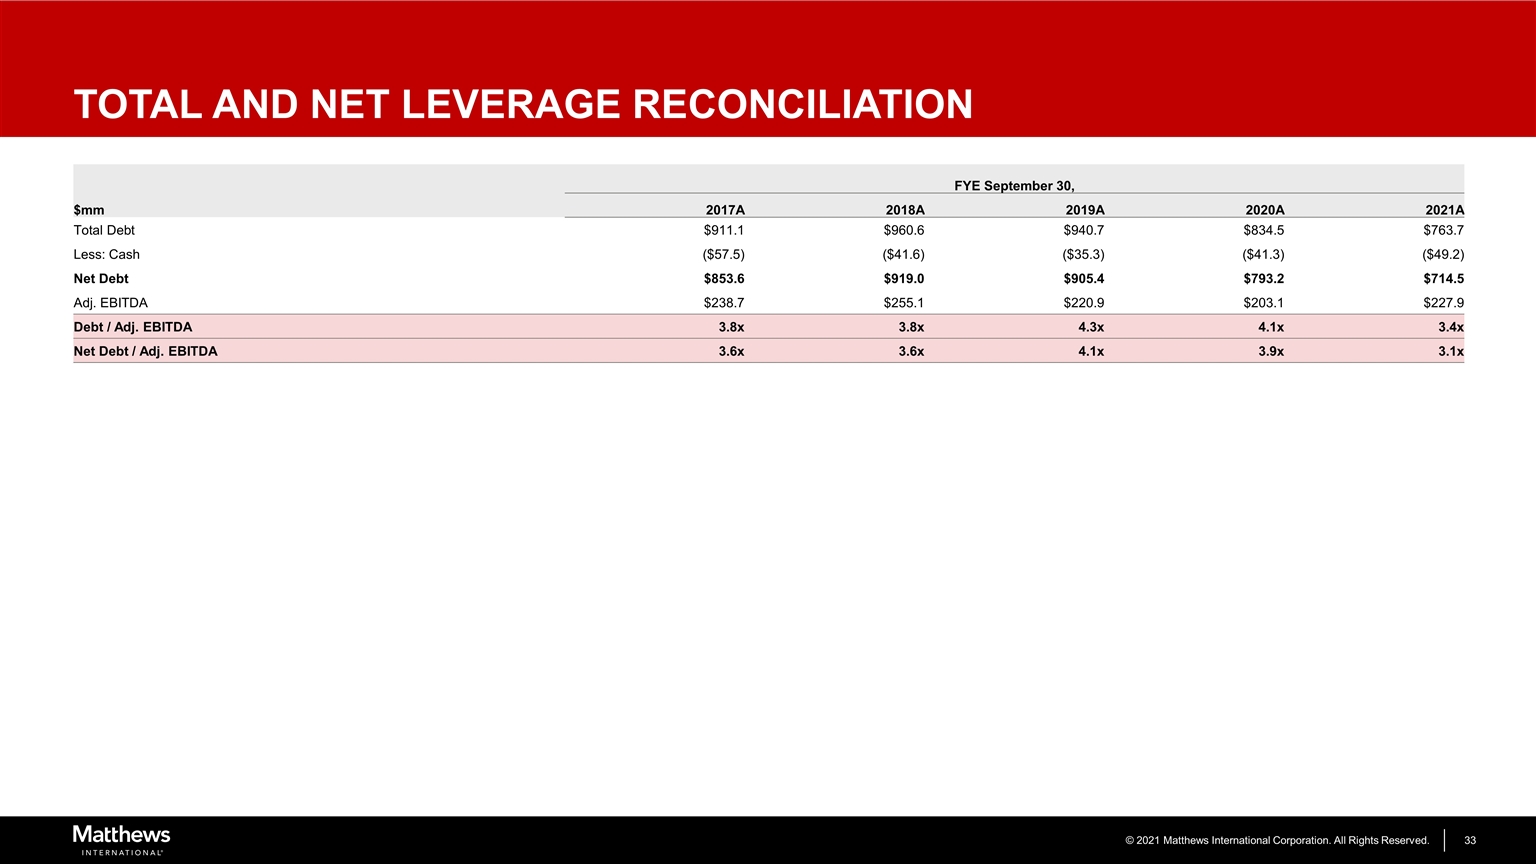
TOTAL AND NET LEVERAGE RECONCILIATION FYE September 30, $mm 2017A 2018A 2019A 2020A 2021A Total Debt $911.1 $960.6 $940.7 $834.5 $763.7 Less: Cash ($57.5) ($41.6) ($35.3) ($41.3) ($49.2) Net Debt $853.6 $919.0 $905.4 $793.2 $714.5 Adj. EBITDA $238.7 $255.1 $220.9 $203.1 $227.9 Debt / Adj. EBITDA 3.8x 3.8x 4.3x 4.1x 3.4x Net Debt / Adj. EBITDA 3.6x 3.6x 4.1x 3.9x 3.1x
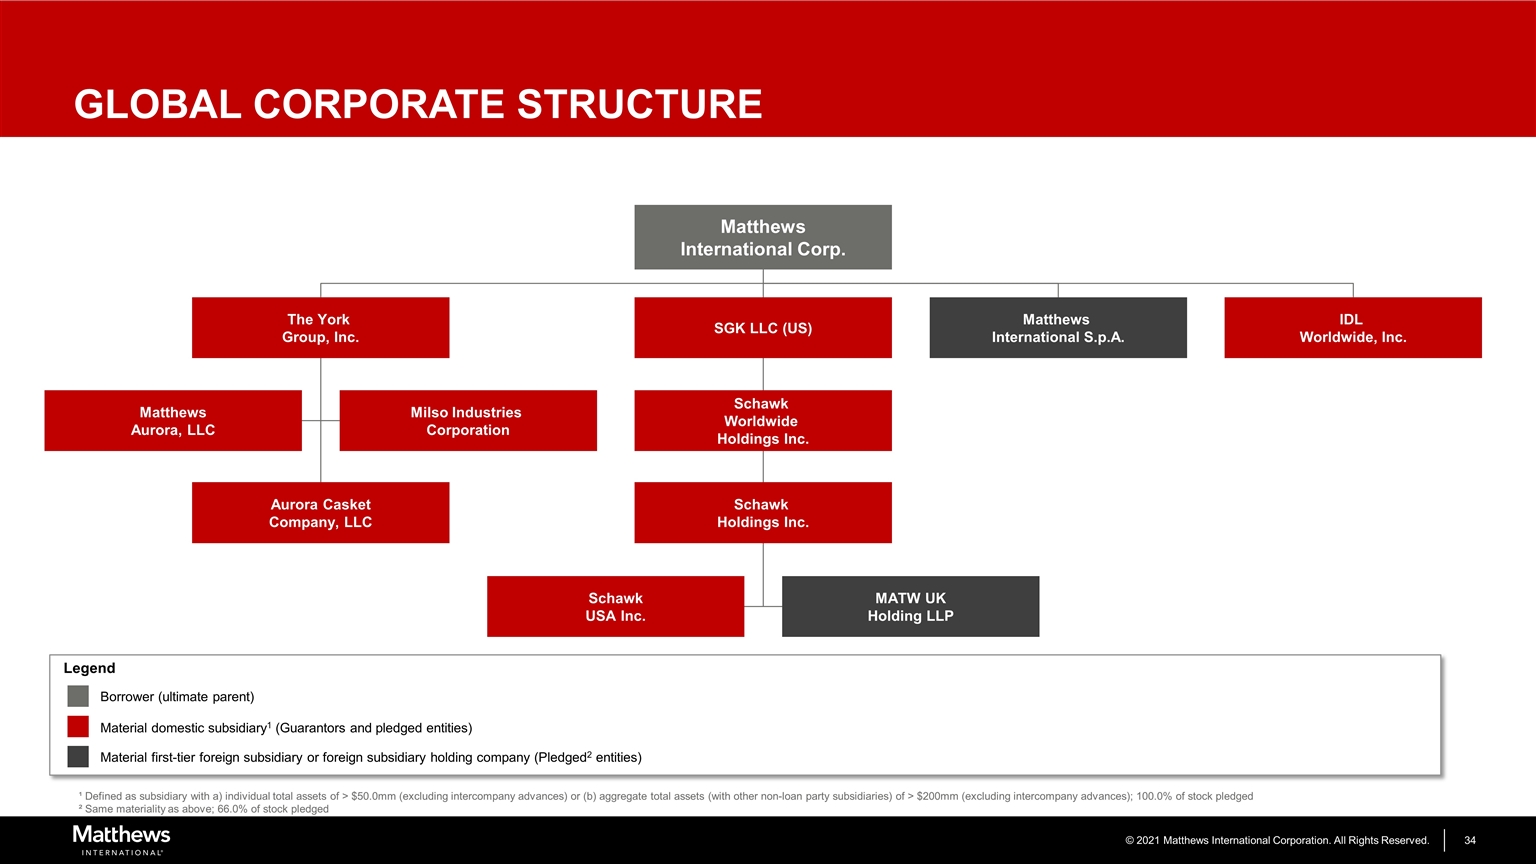
GLOBAL CORPORATE STRUCTURE ¹ Defined as subsidiary with a) individual total assets of > $50.0mm (excluding intercompany advances) or (b) aggregate total assets (with other non-loan party subsidiaries) of > $200mm (excluding intercompany advances); 100.0% of stock pledged ² Same materiality as above; 66.0% of stock pledged Borrower (ultimate parent) Material domestic subsidiary1 (Guarantors and pledged entities) Material first-tier foreign subsidiary or foreign subsidiary holding company (Pledged2 entities) Matthews International Corp. Legend The York Group, Inc. Milso Industries Corporation Schawk USA Inc. Matthews Aurora, LLC Aurora Casket Company, LLC Matthews International S.p.A. MATW UK Holding LLP IDL Worldwide, Inc. Schawk Worldwide Holdings Inc. Schawk Holdings Inc. SGK LLC (US)
DECEMBER 2021